This article follows on from earlier articles where I explored the XSO.ASX Small Ordinaries Index and was updated on February 2nd 2020. The XSO is an index of Australian stocks that appear in the ASX-300 but not in the ASX-100. In this article I look at the relative performance of the XSO versus the ASX-200 (XJO) Index by using the ratio XSO/XJO. The XSO Small Ordinaries has under performed the XJO but there are some signs that this decline is slowing. I will be watching to see if there is any shift in this relationship such that the XSO might start to out perform the XJO.
The XSO is an index of Australian stocks comprised of those that appear in the ASX-300 but not in the ASX-100. A full list of the most recent 200 stocks in this index can be found at the following website: https://www.smallordslist.com/
In the previous YTE article I noted how the XSO was trading well below its all-time High whereas the ASX-200 was flirting up close to its all-time High. In this article I look at the relative performance of the XSO versus the XJO Index by using the ratio XSO/XJO that presents on a single chart; by using this ratio it is much easier to see the relative performance of each index. The XSO Small Ordinaries has under performed the XJO, however, this ratio chart shows that there are some signs this decline is slowing. Traders might benefit from watching to see if there is any shift in this relationship, such that the XSO might starts to outperform the XJO, as this could help traders identify candidates for potential trading opportunities.
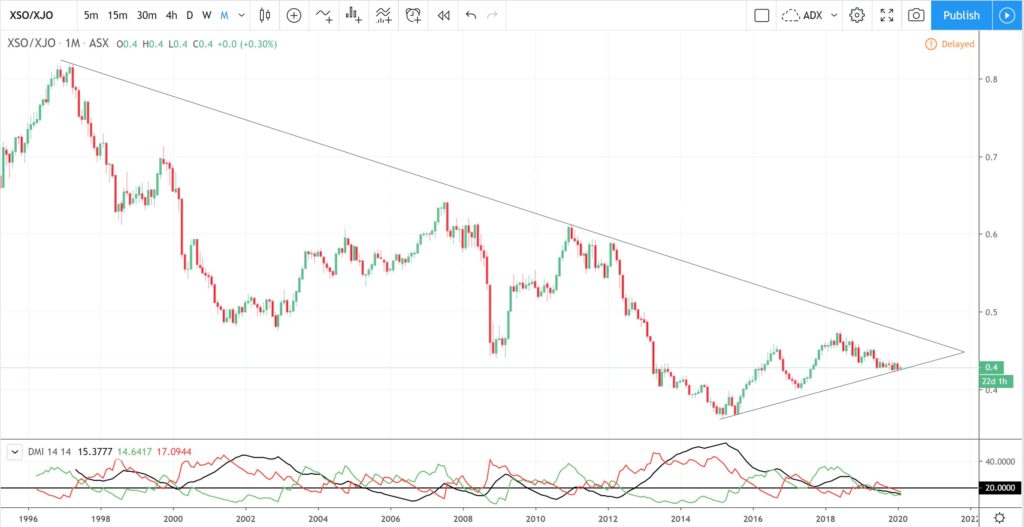
XSO/XJO monthly: The chart below is a monthly chart of the ratio of the XSO, ASX Small Ordinaries Index, versus the XJO, the ASX-200 Index. The chart shows raw price action with candlesticks and with only one added indicator, the ADX /DMI Momentum Indicator, which appears in the pane below the candlestick price action.
The ADX Momentum Indicator is made up of three lines: the ADX Momentum Indicator (Black), the +DMI (bullish) Directional Movement Indicator (green) and the –DMI (bearish) Directional Movement Indicator (red). An upward trending ADX black line indicates increasing momentum and the DMIs indicate whether this is bearish or bullish momentum; depending whether the –DMI or +DMI is trending upwards. Traders usually include a horizontal ‘threshold’ level so as to delineate when the ADX reflects sufficient momentum to be consider a trending market. The threshold level I use is 20 but other traders use 25 or even 30. Thus, for my trading, an ADX above 20 reflects a trending market and suitable for trading but below 20 reflects insufficient trend where trading is avoided.
This chart below shows that price action on the XSO v XJO was in a period of decline from 1996 to 2015 and this is evident from the print of lower Highs and lower Lows. There has been a period of sideways consolidation since 2015, however, and this has enabled the entire price action to be captured into a symmetrical triangle chart pattern. The upper triangle trend line is of 23-years duration and the lower triangle trend line is of 5-years duration.
Note how the the ADX Momentum Indicator shows a decline in overall momentum / trend since this 2015 consolidation period and how the ADX and DMIs are all currently below the threshold level of 20. Traders should watch for any shift to print higher Highs, or, for a resumption of the printing of lower Lows and the ADX could be helpful to confirm any new trend line breakout move. Watching for a move of the ADX back above the 20 threshold is a useful gauge for evaluating any new momentum breakout move.
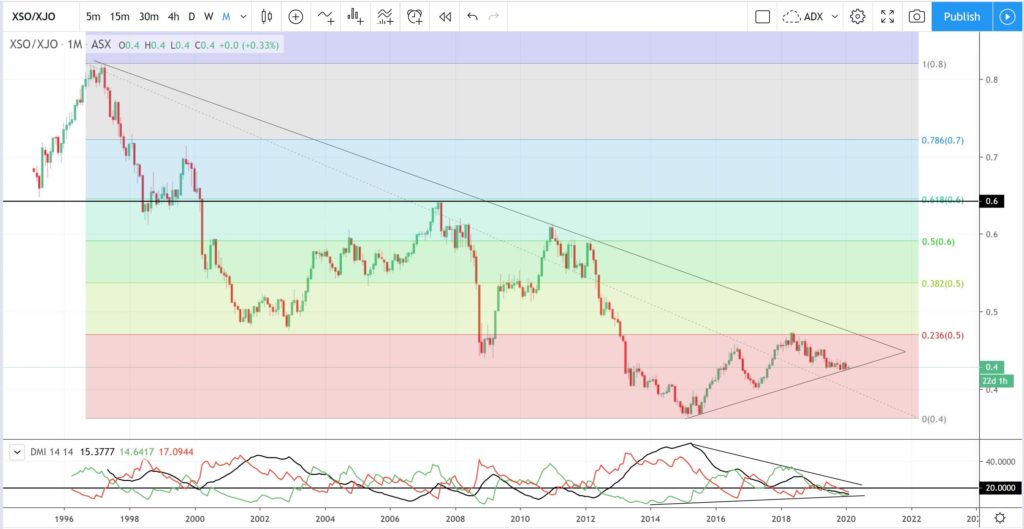
XSO/XJO monthly + Fibonacci: The chart below has been overlaid with a Fibonacci retracement tool. The 61.8% Fibonacci level is a popular retracement level and note how this aligns with previous reaction of price; what I refer to as previous Support / Resistance or, previous S/R. There is a solid horizontal line drawn on the chart to illustrate this 61.8% Fibonacci level. There are many more examples of the significance of the 61.8% Fibonacci level that can be found by running a search of my website at Tradecharting.com.
Note how the ADX is currently declining and contracting towards the 20 threshold. Any momentum-based triangle breakout to the upside would bring the 61.8% Fibonacci level into focus. By momentum-based I mean watching for a breakout of the ADX and the bullish +DMI above the 20 level:
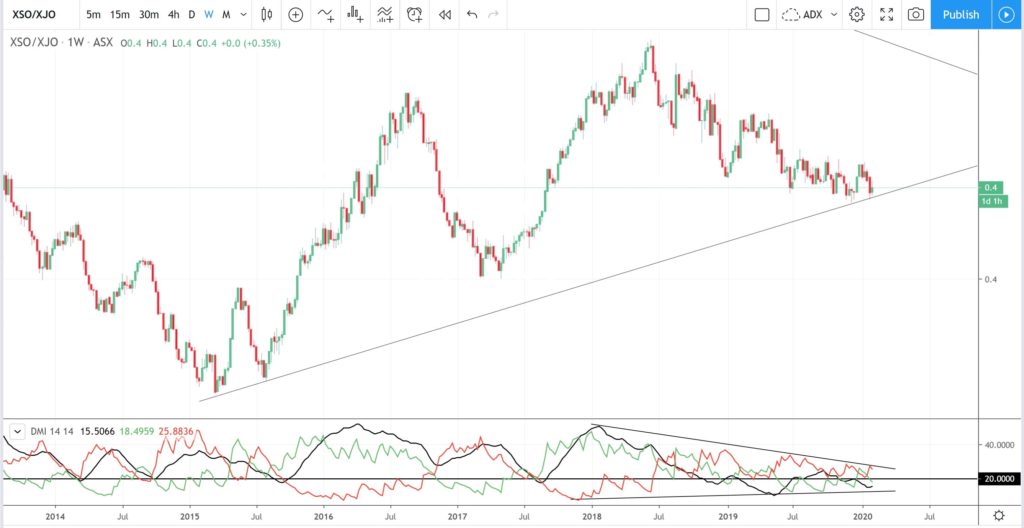
XSO/XJO weekly: This weekly chart captures a more recent period of price action. This chart shows that the more recent trend on this weekly time frame, since 2015, has been UP given the print of higher Highs and higher Lows:
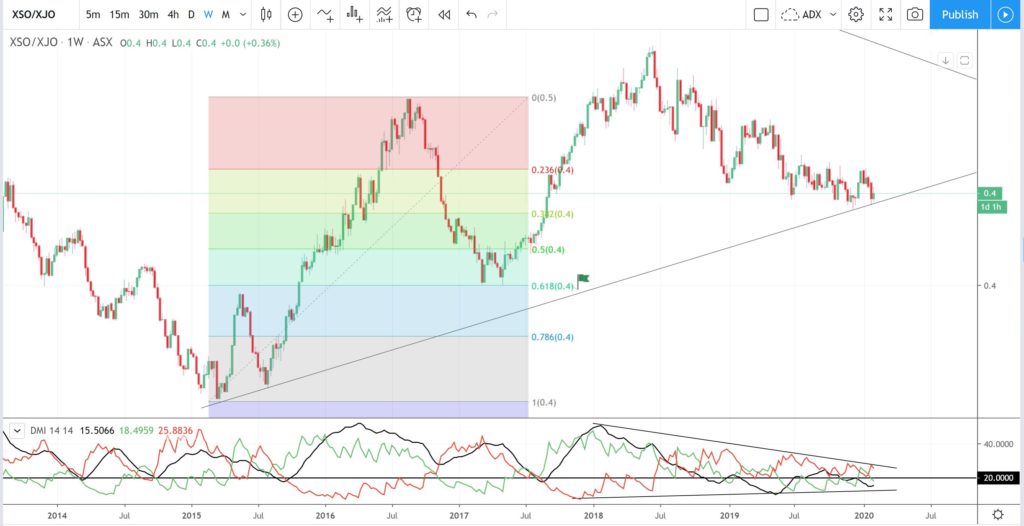
XSO/XJO weekly + Fibonacci: The chart below is offered to give just one example of how the 61.8% Fibonacci level is a popular pullback level. Fibonacci retracement was placed on the 2015 – 2017 swing High move. Note how the subsequent pullback reached down to the 61.8% Fibonacci level before reversing; this has been flagged with a green flag! There are many more examples of this 61.8% Fibonacci phenomenon that can be found on my website at through this link.
XSO/XJO weekly + Fibonacci: The Fibonacci retracement tool, for the chart in below, was placed on the May 2017- May 2018 swing High move. Note how, here too, the subsequent pullback reached down to the 61.8% Fibonacci level where price action is currently still consolidating:
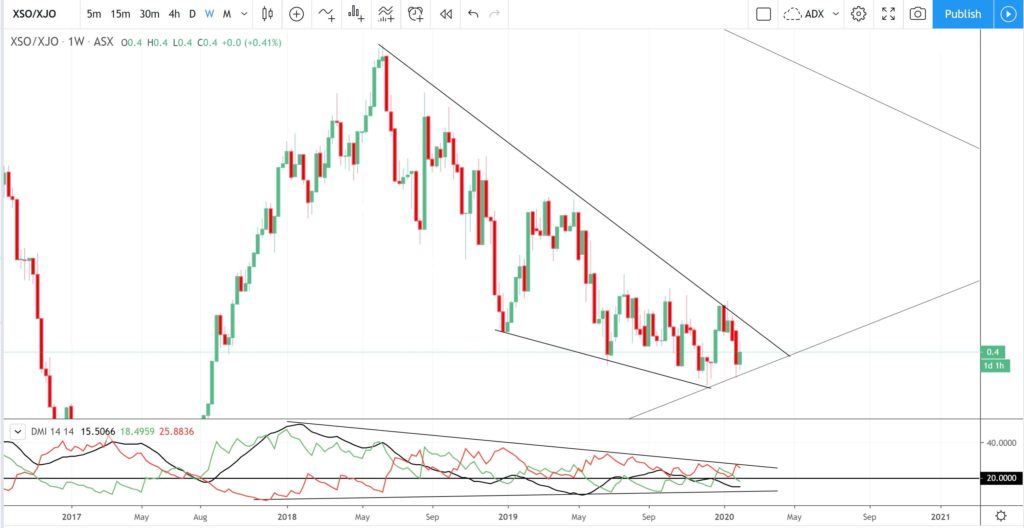
XSO/XJO weekly: The weekly chart below shows how recent price action can be captured into a descending wedge pattern giving traders trend lines to monitor for any new momentum-based trend line breakout. The descending wedge is considered a bullish-reversal technical pattern and examples of this can also be found through this link. Note how overall momentum has been declining and converging during this pullback period for the formation of the descending wedge:
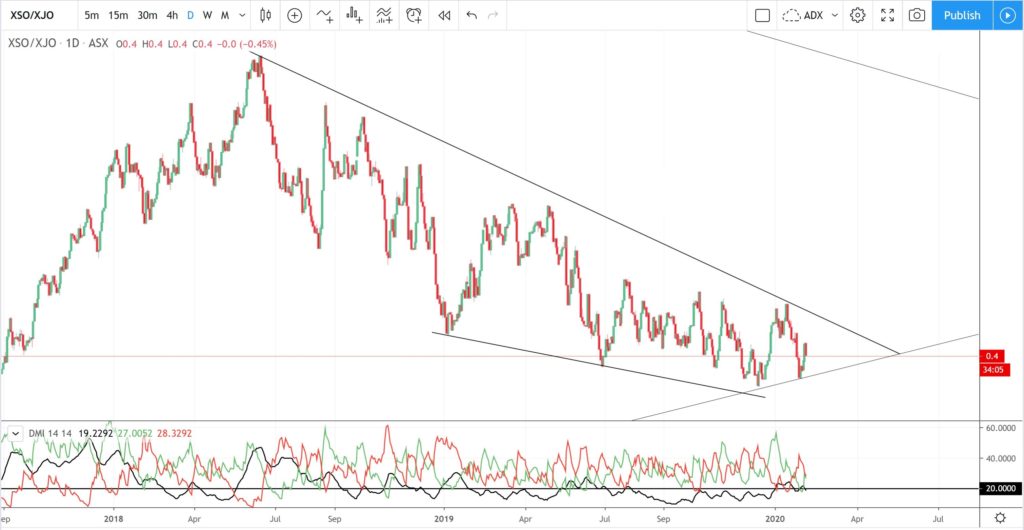
XSO/XJO daily: The chart below shows this descending wedge on the daily time frame. The more recent trend on this time frame is DOWN due to the print of lower Highs and lower Lows. Note how the the ADX is still below 20 but the bearish –DMI is edging down whereas the bullish +DMI is edging higher. Watch for any new ADX momentum-based trend line breakout here: up or down!
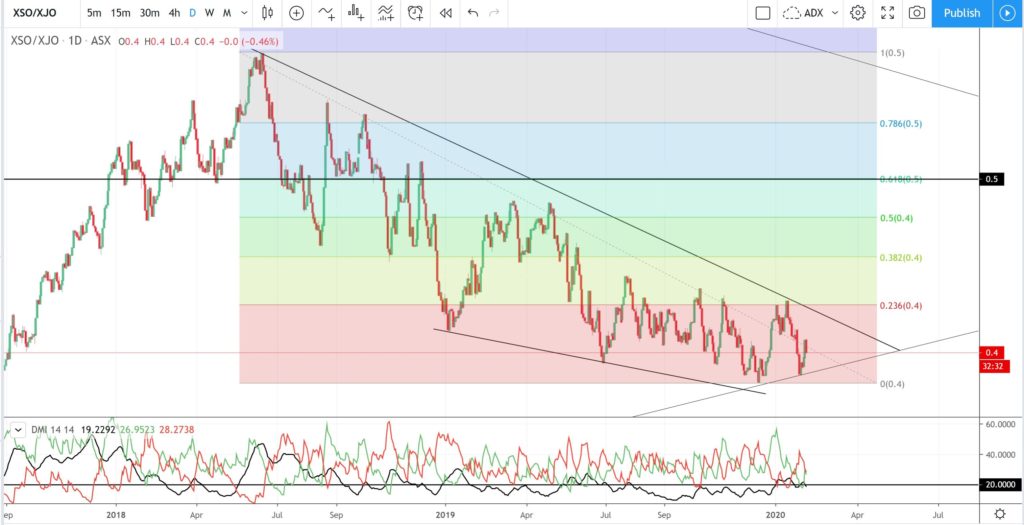
XSO/XJO daily + Fibonacci: The chart below has been overlaid with a Fibonacci retracement too. Note how the popular 61.8% Fibonacci level is up near previous S/R and this would be the first target for any momentum-based, bullish trend line breakout. This level has been noted with a solid horizontal line.
For the time being, however, price action continues consolidating within the descending wedge and just above the 5-year support trend line; there have been four bullish bounce up off this 5-year support trend line since 2015:
Summary: The XSO Small Ordinaries index has under performed the XJO ASX-200 index since 1996 but there are some signs that this relationship could be shifting:
- The monthly chart shows a slowing in the print of lower Lows: The last major Low was printed in 2015 and price has been edging higher, albeit in fits and spurts, since then. Any new Low, one that closes below the 0.4 ratio level, would suggest a resumption of the decline. Watch the monthly chart trend lines for clues here as well.
- The weekly / daily chart shows the formation of a descending wedge: the more recent price action on the daily and weekly chart shows price shaping up in a descending wedge and these are considered bullish-reversal patterns. Any momentum-based trend line breakout to the upside would confirm this technical pattern.
Traders should watch for any momentum-based trend line breakout on the daily chart wedge for clues about any shift in the relationship of the XSO to the XJO index. Traders should then watch for any monthly chart-based triangle breakout. Any sustained bullish breakout would support a thesis of looking for appropriate XSO stocks, over XJO stocks, which might meet a traders trading plan.
As always, traders should only trade with funds they can afford to lose and they should perform their own due diligence in accordance with their particular risk tolerance and within the framework of their documented trading plan.


