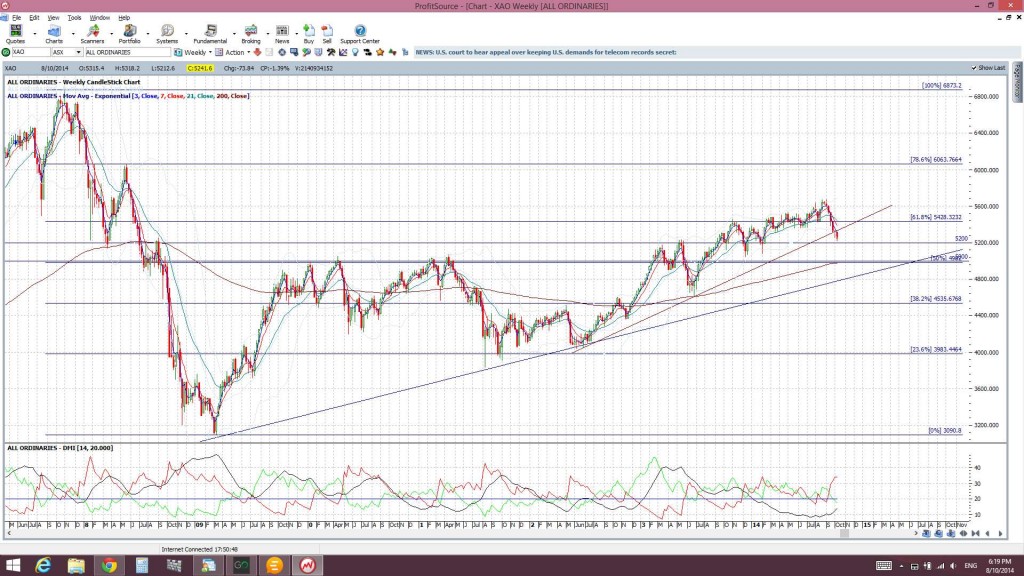
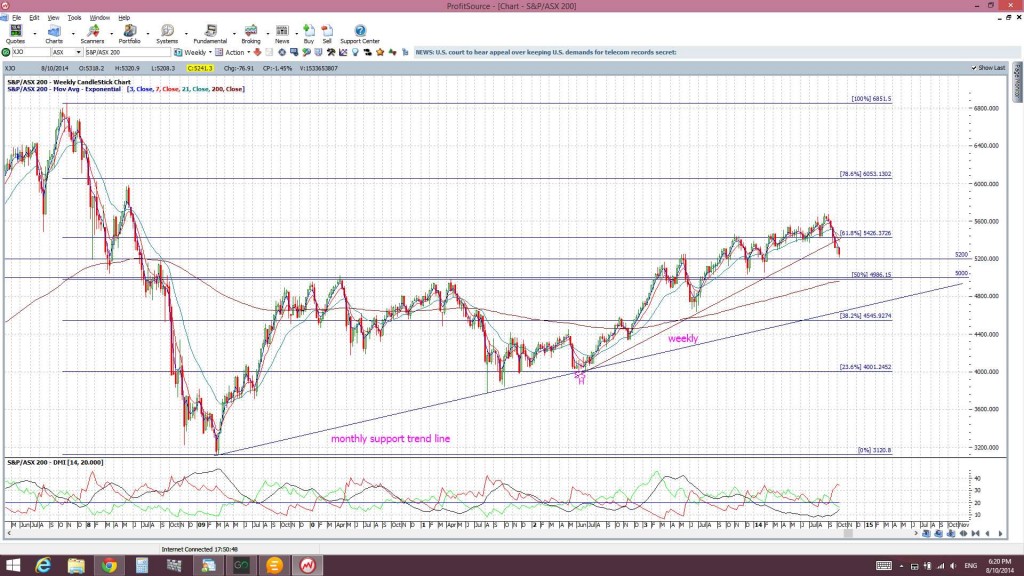
The two main Aussie stock market indices are the XAO (All Ordinaries) and the XJO (S&P: ASX 200). The XAO is currently printing its seventh consecutive bearish week and the XJO is printing its sixth out of the last seven.
The markets have been rattled recently but last nights IMF global growth downgrades and today’s ABS revision of employment data have added further uncertainty and continued to unsettle investors. The markets do not like uncertainty!
This bearish activity on the Aussie indices seems grim but it isn’t in the ‘dire’ category just yet. Both indices have enjoyed a bull run since early 2012 and have only recently pulled back and broken through weekly support trend lines BUT both are also holding above key support of 5,200, for the time being at least.
XAO weekly: weekly support broken but holding above 5,200 support:
XJO weekly: weekly support broken but holding above 5,200 support:
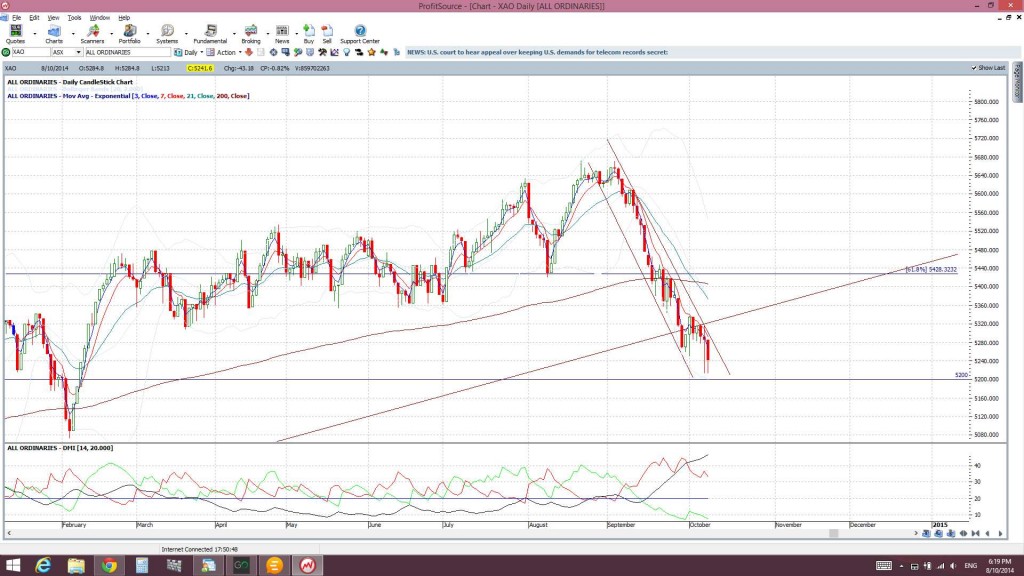
The pull back activity on both could indices is worth mentioning here too. The daily charts of both indices show this price action conforming to a descending trading channel and this is giving the current charts a bit of a ‘Bull Flag’ appearance:
XAO daily: the pull back conforming to a descending trading channel giving a ‘Bull Flag’ appearance:
XJO daily: the pull back conforming to a descending trading channel giving a ‘Bull Flag’ appearance:
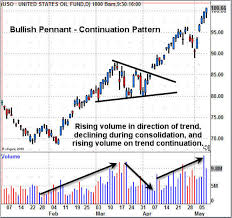
‘Bull Flag’ patterns are, as their name suggests, bullish continuation patterns. Traders need to watch these potential ‘Flag’ trend lines on both indices for guidance about the next directional move:
Example of a ‘Bull Flag’:
Summary: Traders need to watch the daily chart ‘Flag’ trend lines of the XAO and XJO for guidance as to the next major move for these indices:
- A bearish breakdown below the ‘Flag’ and any close and hold below the support of 5,200 would be bearish.
- A bullish breakout might lend weight to the ‘Bull Flag’ suggestion.


I agree with you on the weekly chart of the XAO.
However, when looking at the hourly charts, the behaviour could also be the big money making an orderly exit. Presumably, the volume will provide the missing clue in due course.
Would flags go on for that long though? Looks to be out of symmetry to me?
IMHO…….If you look at the weekly charts…the ‘Flags’ look in reasonable perspective.