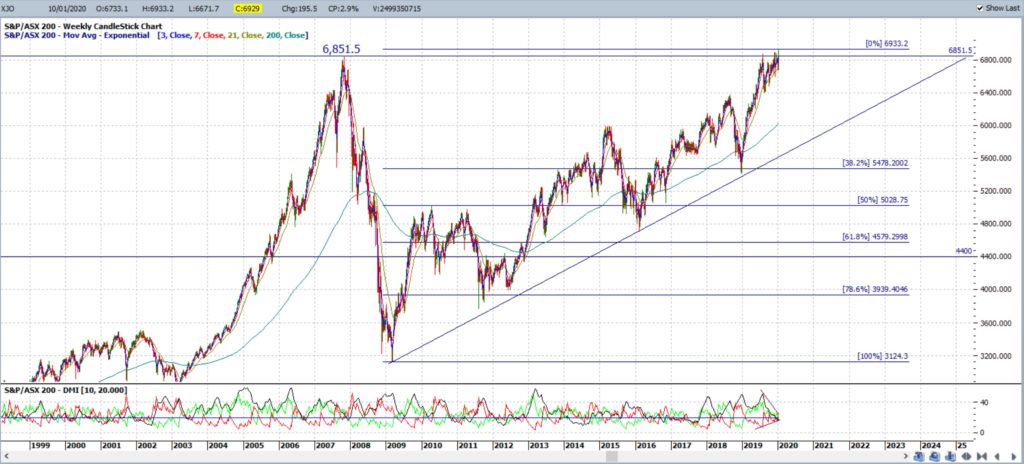
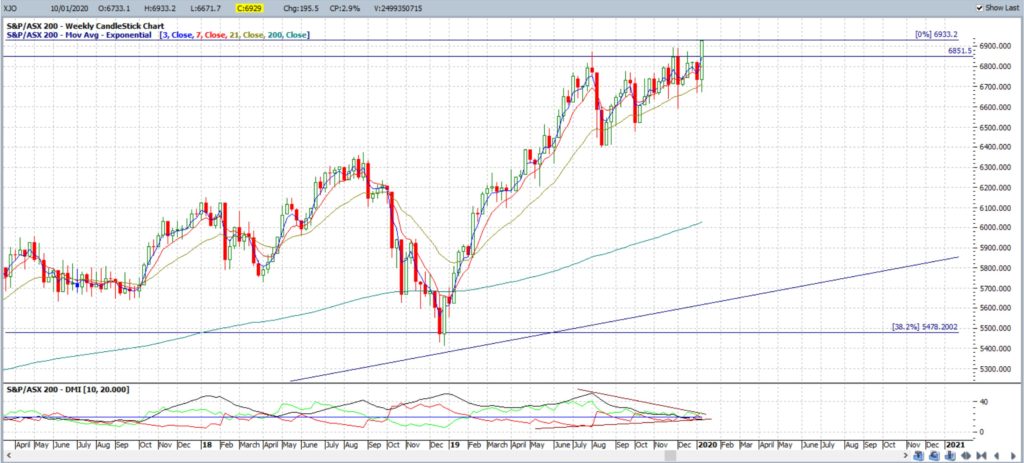
The ASX-200 index is sniffing new territory as it finally made a weekly candle close above the pre-Global Financial Crisis High of 6,851.50 and above the recent all time intra-day High level of 6,893.70. The index closed at 6,929 and, whilst one swallow does not a summer maketh, this is an impressive close and traders will now be watching to see if the index can hold above these levels for any new monthly closing High.
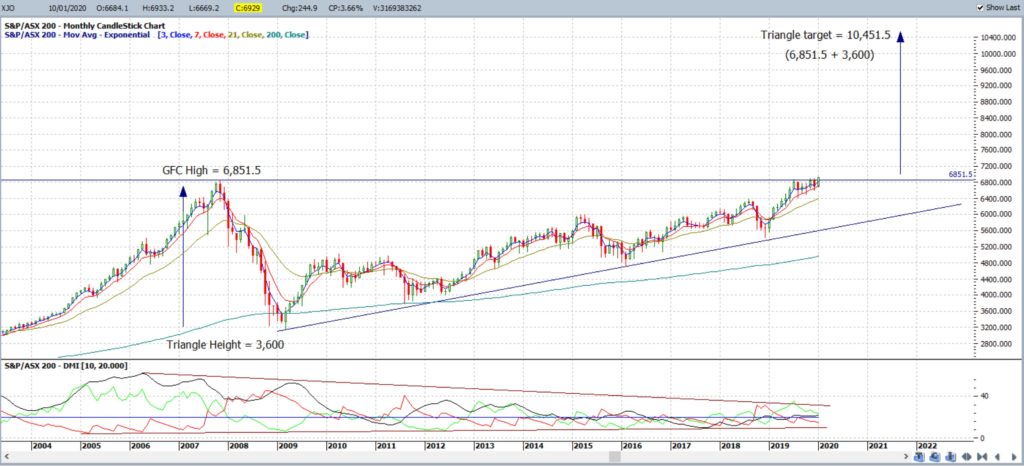
Regular readers will recall ascending triangle breakout patterns that I charted back in 2014 on both the S&P500 and DJI that have now completed. There is a similar charting pattern evolving on the monthly chart of the ASX-200 index so the next monthly close will be important to see if any breakout does trigger. The ASX-200 is one of the few global stock indices to still be trading below their pre-GFC Highs and so some catch up would not be a surprise!
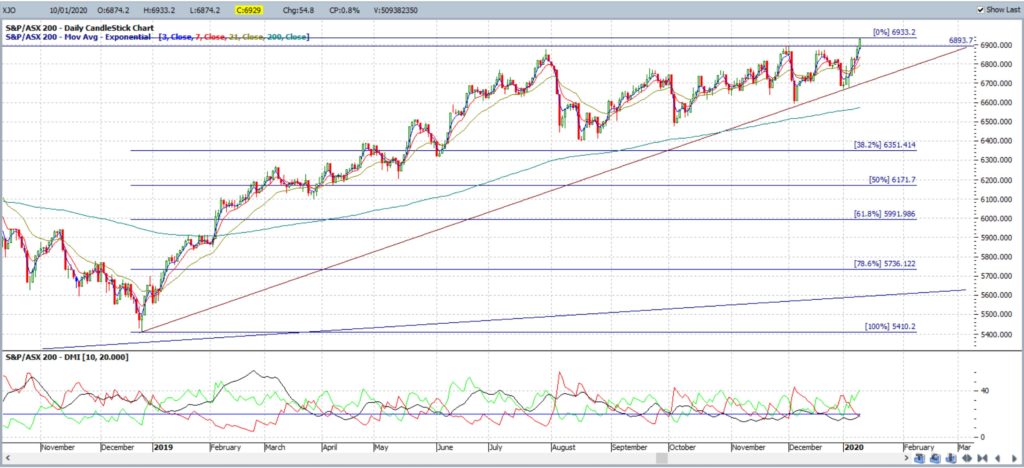
XJO daily: still in an uptrend as the print of higher Highs and higher Lows continues. Any break of the support trend line would have me looking for a potential Bull Flag in the first instance and, then, for any pullback to the daily chart’s 61.8% fib, circa 6,000 S/R. Note how the ADX is starting to move higher so watch for any push above the 20 threshold level here:
XJO weekly: a new weekly all time High BUT watch for any momentum breakout to support this move:
XJO weekly expanded: a bullish ‘engulfing’ weekly candle. Watch for any new momentum breakout to support this uptrend:
XJO monthly: there is an ascending triangle breakout brewing BUT traders need to wait and watch for the monthly candle close to confirm any breakout:
Summary: the ASX-200 Index has made an impressive new all-time High close but traders really need to wait and see where the index closes for the month before any bullish ascending triangle can be confirmed.


