Australia’s primary stock index, the XJO (index of the largest 200 Australian companies: ASX-200), closed 2021 strongly with a bullish yearly candle and a bullish December monthly candle capping a gain of 13% for 2021.
The yearly close at 7,444.60, being well above the pre-2021 all-time high region near the whole-number 7,200 level, is rather bullish but this is not the only encouraging signal evident on charts of the index. In this article I review different time frame charts of the XJO and note a number of bullish signals although, as I’ve mentioned previously, I do wonder if the index might chop along sideways, above 7,200 and under the resistance of the 2021 high of 7,632.8, until after the next Australian Federal election, likely sometime in the first quarter of 2022? A change of Government might just be the catalyst needed to invigorate market confidence and get the index moving to tackle the previous high region.
NB: I remind readers that I am taking a break from the regular publishing of articles as I have a fair bit of travel planned for 2022, Covid permitting of course, and I wish you all safe, happy and prosperous new year!
Technical Analysis: It is important to keep in mind that this analysis is Technical and chart-based but that any major Fundamental news items, as recently seen with Covid-19, have the potential to quickly undermine identified chart patterns. This is why it is critical that traders appropriately manage their trade exposure and risk per trade during volatile market conditions.
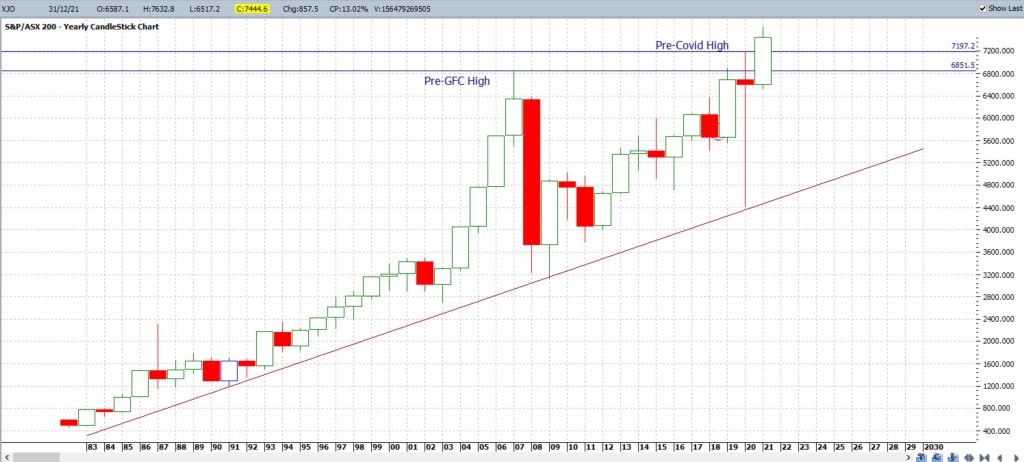
XJO yearly: the XJO closed 2021 with a fairly large and bullish candle and above the pre-2021 all-time high region of circa 7,200. This strong performance may be of some surprise given the bearish-reversal Hanging Man-style candle that printed for 2020 and the continued impact of Covid throughout 2021.
Despite this bearish landscape, there are a few bullish features worth noting on the yearly chart:
- the long-term trend remains UP given the index continues to hold above the support trend line and prints higher Highs and higher Lows.
- price action closed the year above the pre-Global Financial Crisis (GFC 2007 – 2009) High of 6,851.5.
- price action closed the year above the pre-Covid-19 Crisis High of 7,197.2.
Rounding off the pre-2021 High to near the whole-number level of 7,200 means that this is the key level to keep monitoring. This was resistance prior to 2022 and any hold above this region would be a rather bullish signal as it would suggest that this old Resistance may be evolving into new Support.
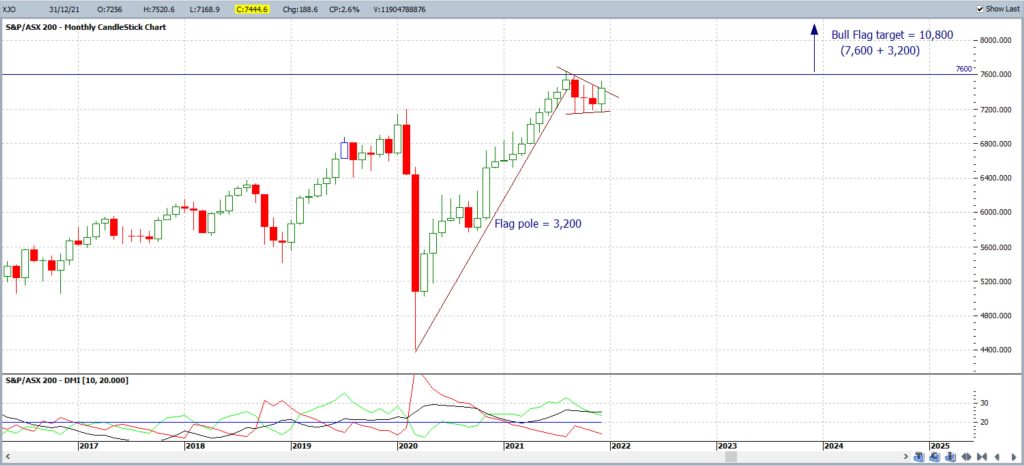
XJO monthly: there are two bullish features evident on the monthly chart:
- the XJO closed December with a bullish, almost engulfing, monthly candle.
- there is a Bull Flag pattern brewing on this monthly chart and traders should watch for any monthly candle breakout that evolves with an uptick on the ADX and +DMI momentum indicators.
The Bull Flag pattern has a Flag pole that is approximately 3,200 pints in length. The theory behind these bullish continuation patterns is that any break to the upside might be expected to extend by a similar order of magnitude as the the original Flag pole. The projected target for the XJO with this Flag pole then is up above 10,000 so this is one pattern worth well monitoring!
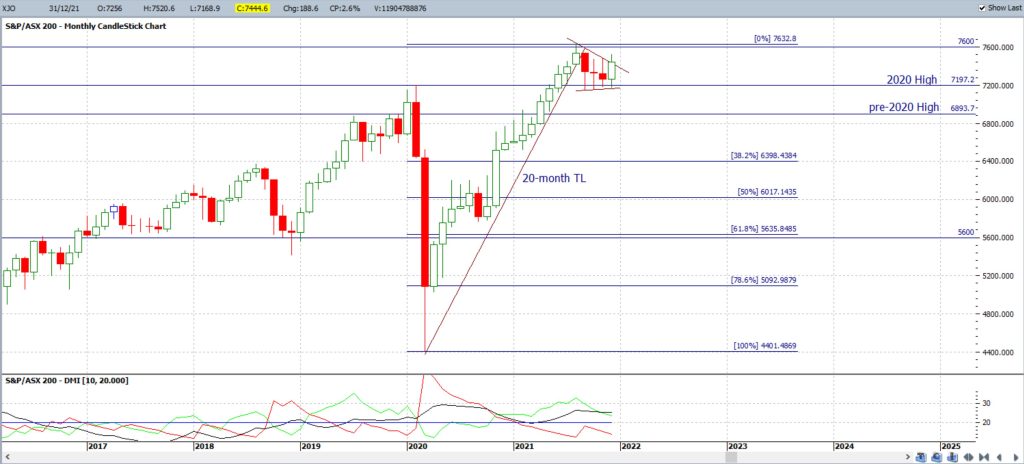
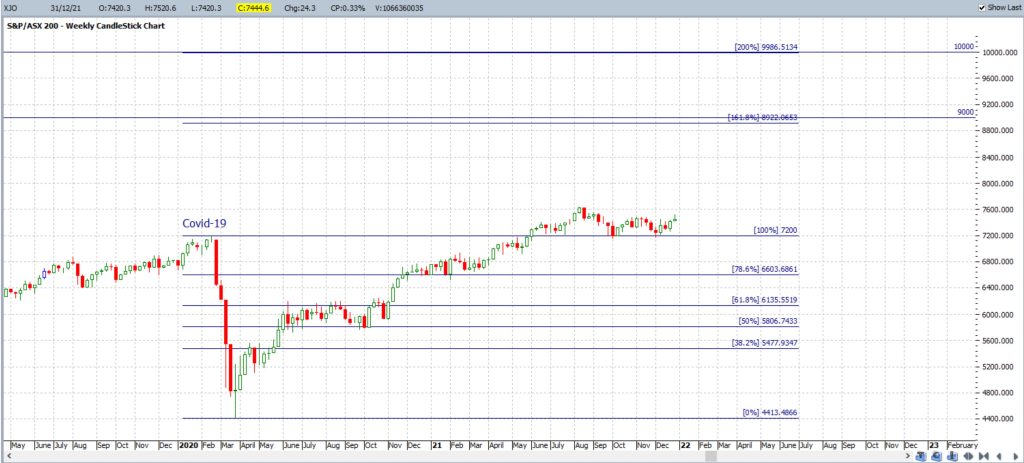
Fibonacci tools are useful to help map targets for any bearish breakdown though. The most recent swing-high move for the XJO, from the 2020 Covid low to the 2021 high, has been mapped with a Fibonacci retracement tool. Note how the popular 61.8% Fibonacci is down near a previous reaction zone at circa 5,600 and this would be one key level to monitor if price action retreats from current levels and suffers a significant pullback.
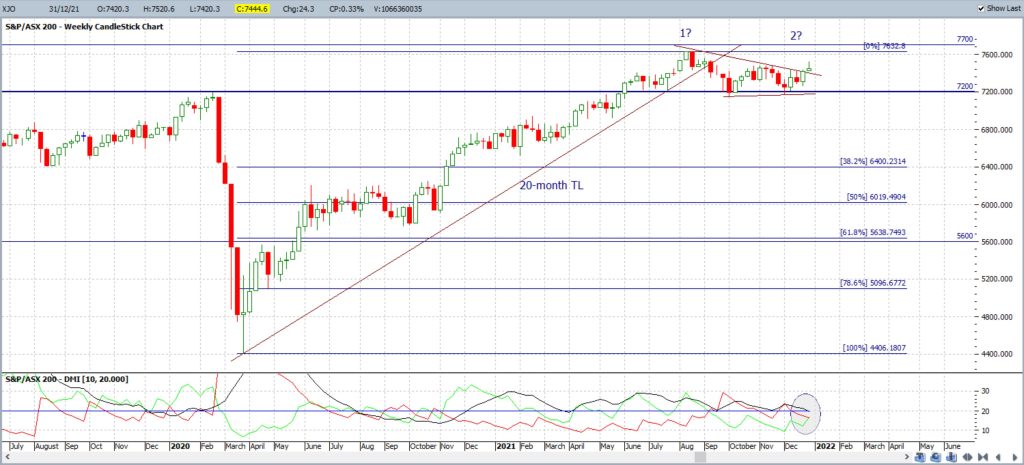
XJO weekly + ADX: the weekly chart reveals that a Bull Flag breakout may already be starting on this time frame. However, momentum is not supporting this signal at the moment as the ADX is trending downwards and the bullish +DMI, whilst trending up, remains below the 20 threshold.
Traders should monitor these ADX momentum signals for any shift to support this early, trend-line breakout. That is, watch for any ADX and +DMI shift to trend upwards AND above the 20 level as this would then support the bullish trend line breakout.
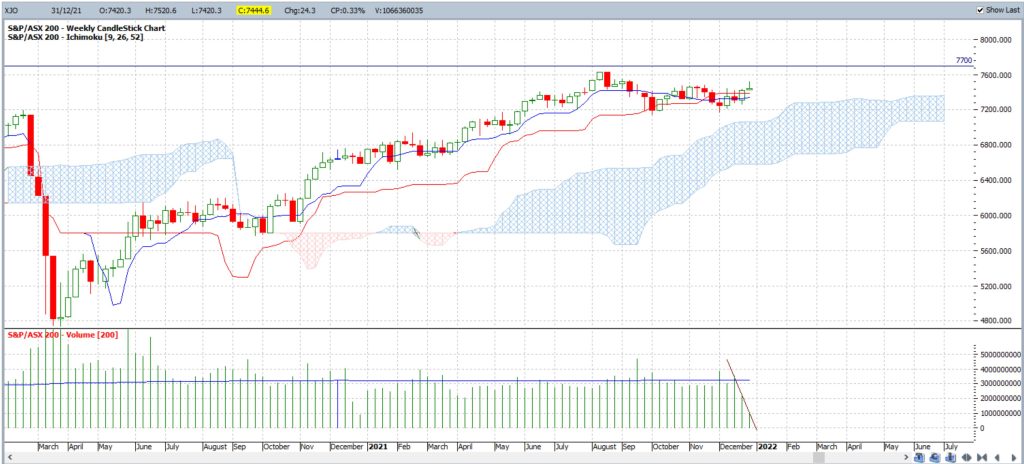
XJO weekly + Volume: the chart below shows how trading volume has been much lower over the last few weeks; during the lead up to Christmas and the New Year. Traders should watch for any new uptick with volume, and for any move above the 200 Moving Average, to support any new directional move on the index; whether that move be up or down.
XJO weekly + Fib retracement:
The weekly chart below shows the Fibonacci retracement of the Covid swing low move and projects bullish levels that are worth monitoring. Note how the 161.8% retracement level lies near the whole-number 9,000 level but the most interesting level would have to be the 200% retracement, up near the whole-number level of 10,000; a nice round number to monitor!
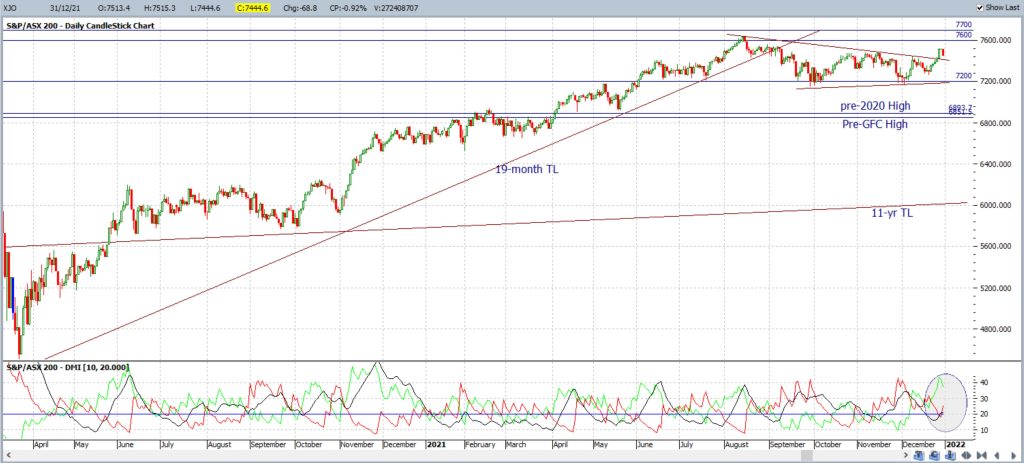
XJO daily: the daily chart below shows that some selling evolved on the last day of the year which was not too surprising. Some profit taking at the end of the year likely being one reason for this sell-off.
XJO daily + Volume: Daily volume has been well below average so watch to see how price action reacts at the start of the new year when volume / liquidity return to some kind of normal.
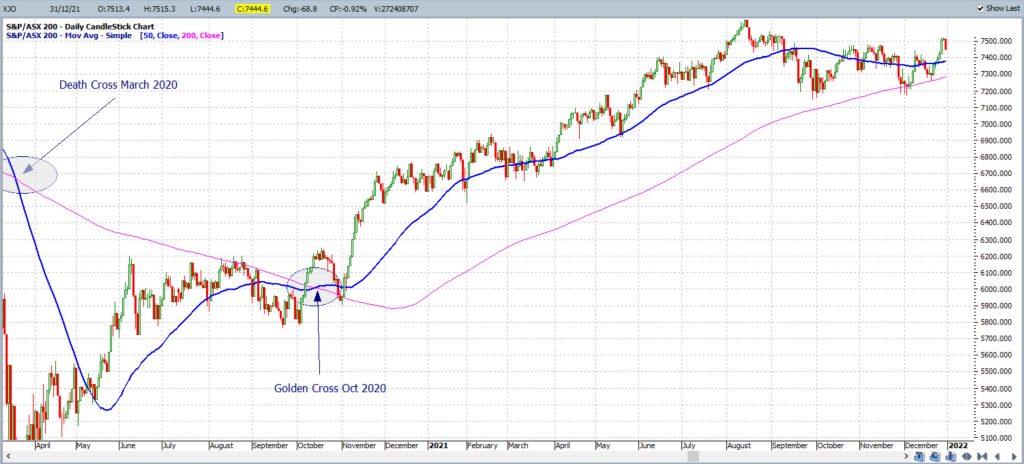
XJO daily Golden Cross: Keep in mind that the recent Golden Cross remains valid here and the index is holding above the 50 SMA. The Golden Cross is a bullish signal where the 50 SMA crosses above the 200 SMA. Such crosses are often, but not always, followed by a decent bullish run so these crosses are worth noting and this current Golden Cross proved to be great signal. The the SMAs are converging though so watch for any new bearish Death Cross.
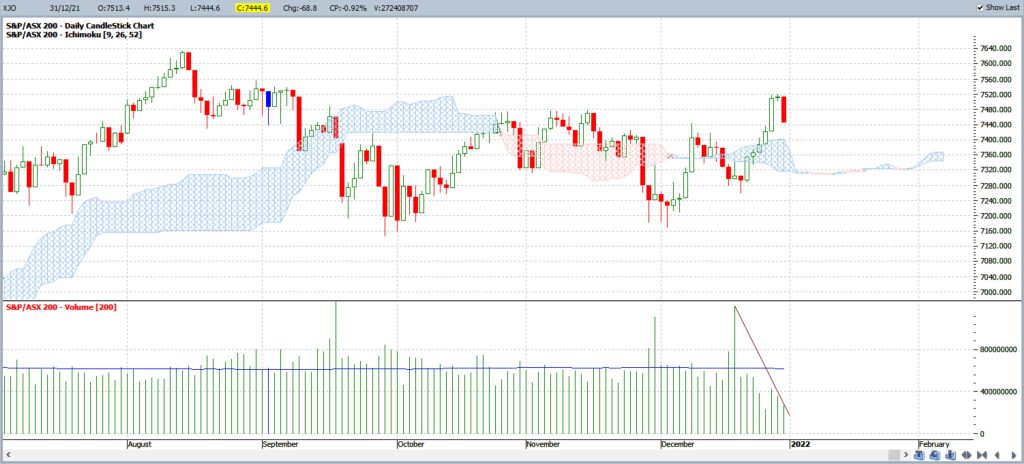
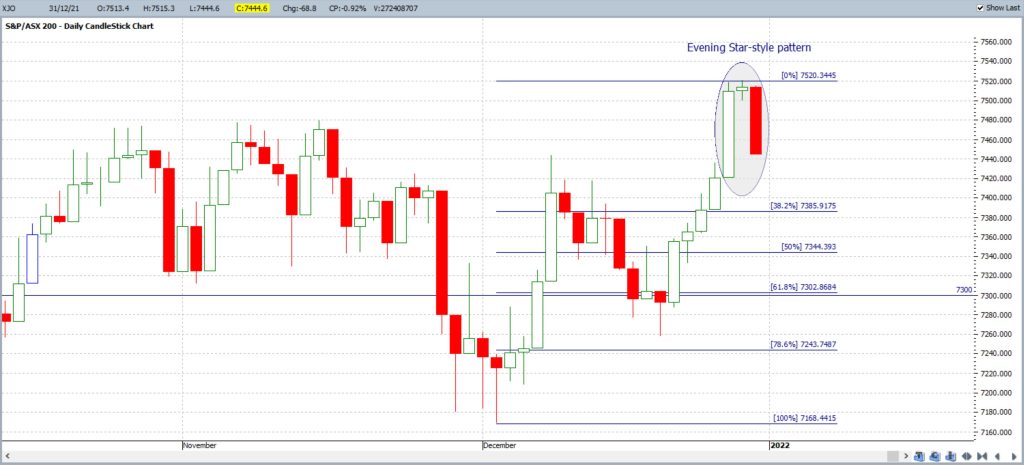
XJO daily expanded: the chart below has been expanded to show the individual candlesticks more clearly. The last three daily candles have formed a pattern very similar to that of a bearish-reversal Evening Star pattern. A text-book style pattern would show a gap up between candle 1 and 2 but this is not the case on this chart, however, I think it is worth noting as being a potentially bearish signal.
In summary: The XJO closed higher for 2022, despite the ongoing ravages of Covid-19, and there are a number of bullish features evident on various time frame charts and two potentially bearish ones. These are summarised below:
Bullish chart features:
- a monthly support trend line remains intact.
- the monthly chart print of higher Highs and higher Lows.
- The December monthly candle was a bullish engulfing style candle.
- price action closed the year above the pre-GFC High of 6,851.5.
- price action closed the year above the pre-Covid High of 7,197.2.
- a Bull Flag pattern on the monthly chart.
- A bullish Golden Cross pattern remains intact.
Bearish chart features:
- a daily chart, three-candle pattern similar to a bearish-reversal Evening Star pattern.
- The 50 SMA and 200 SMA are converging on the daily chart time frame.
Traders would be well advised to watch for any monthly chart momentum based trend line breakout so as to gauge the next directional move on the index; whether that be up or down. Breakout targets to monitor are repeated below:
- Bullish targets: Any bullish monthly chart Bull Flag trend line breakout would bring the previous all-time High region of 7,632.8 into focus. After that, watch the 161.8% retracement of the Covid swing low (near 9,000) followed by the 200% level (near 10,000) and the Bull Flag target, near 10,800.
- Bearish targets: Any bearish monthly chart Bull Flag trend line breakout would render a break of the key 7,200 back and would bring 7,100 into focus. After that, watch 7,000, the pre-2020 High of 6,893.70 and the pre-GFC High of 6,851.50. The weekly chart’s 61.8% Fibonacci is down near 5,600 so that would be the next support to monitor.


