The ASX-200 index, the XJO, has made its first monthly close above the pre-Global Financial Crisis (GFC 2007-2009) High level of 6,851.50. The index closed for the month of January at 7,017.20 meaning it has also closed above the psychological and whole-number level of 7,000. Technical analysts will often note how ‘old Resistance becomes new Support‘, or in another way, ‘Ceilings becomes Floors‘, and so the big question for Aussie traders is: Will this be the case for our ASX-200?
XJO monthly: note the decent sized bullish monthly candle that has closed above the psychological 7,000 level. You can also see how the pre-GFC High level, of 6,851.50, had formed up as considerable Resistance throughout the latter part of 2019. The monthly candle close above 6,851.50 is bullish and will have traders and analysts watching to see if this level, that was previous Resistance, might now become Support:
The Aussie XJO is one of the few global stock indices that, until the last two months, had been trading below it’s GFC High. The charts below show just two examples of global indices, the S&P500 and DJIA indices, that are trading well above their GFC Highs. It seems like the XJO has got some catching up to do!
S&P500 monthly: trading well above it’s GFC High:
DJIA monthly: also trading well above it’s GFC High:
XJO weekly: the weekly chart shows how the index has essentially been printing higher Highs and higher Lows since the end of the GFC period, since around February 2009:
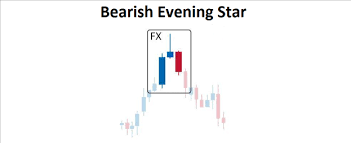
XJO weekly expanded: some caution is needed at these lofty levels though; especially as the last three weekly candles have shaped up in a bullish-reversal Evening Star pattern. The next few weekly candles will be important here, obviously, and any retreat and new hold below back 6,851.50 would be bearish and help to confirm this technical pattern:
XJO daily: the daily chart shows that a support trend line has been in place for over 12 months; since December 2018. There is also a bit of a daily chart Bull Flag pattern evident so watch these trend lines in coming sessions for any new breakout: up or down!
XJO weekly + Fibonacci projection: a Fibonacci extension has been added to the weekly chart of the XJO; spanning from the 2009 Low to the January 2020 breakout level, that is, the breakout above the 6,850 Resistance region. Many traders use the Fibonacci extension tools, in cases of bullish continuation, to help identify future Resistance zones. Note how the 61.8% extension is near the whole-number 9,000 level, the 100% extension is near the round number 10,500 level and the 161.8% Fibonacci level is near the whole-number 13,000. These would be three targets to monitor IF there is to be bullish continuation:
Summary: the ASX-200 index, the XJO, has finally made a monthly candle close above it’s pre-GFC High. Traders and analysts will be watching to see if, like with many other global indices, this breakout above the pre-GFC High will be another example of old Resistance evolving into new Support.


