It has been a bit of ‘paint-dry’ stuff across many FX pairs today but the Aussie ASX-200 had another wild ride although, essentially, the index remains range bound. The advantage of this however is that it gives us technical traders some trend lines to focus on!
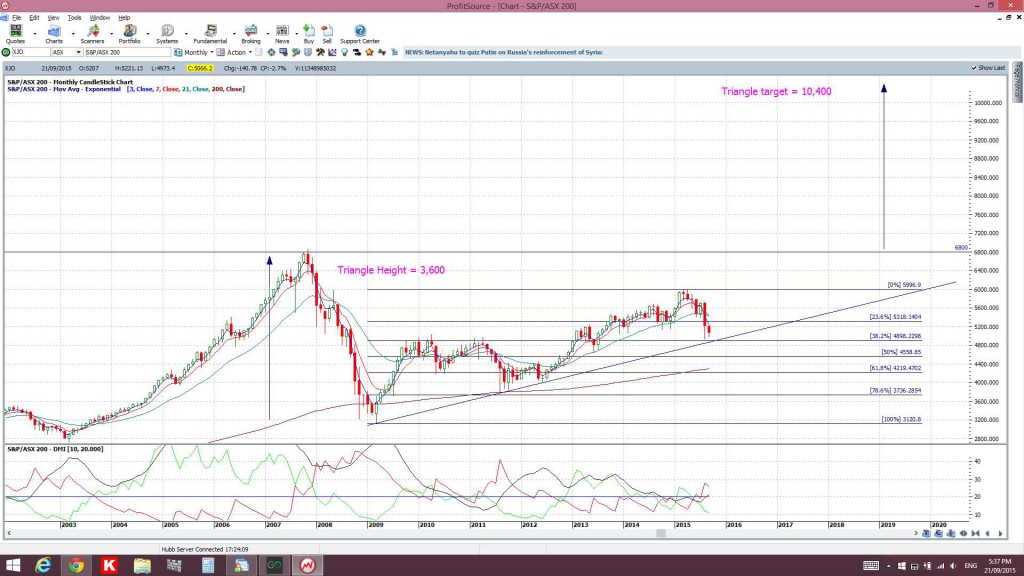
XJO monthly: I still have the index in a longer-term bullish ascending triangle. For any resumption of bullish sentiment traders should focus on the 5,200 level followed by the previous recent high near 6,000, then the pre-GFC high near 6,800 before the bullish target of 10,400. However, there could be some more pain here before any bullish targets are reached. There is the psychological 5,000 level below current price as well as a major support trend line. Any failure of these would bring the 50% fib near 4,500 and then the 61.8% fib near 4,200 and the monthly 200 EMA into focus:
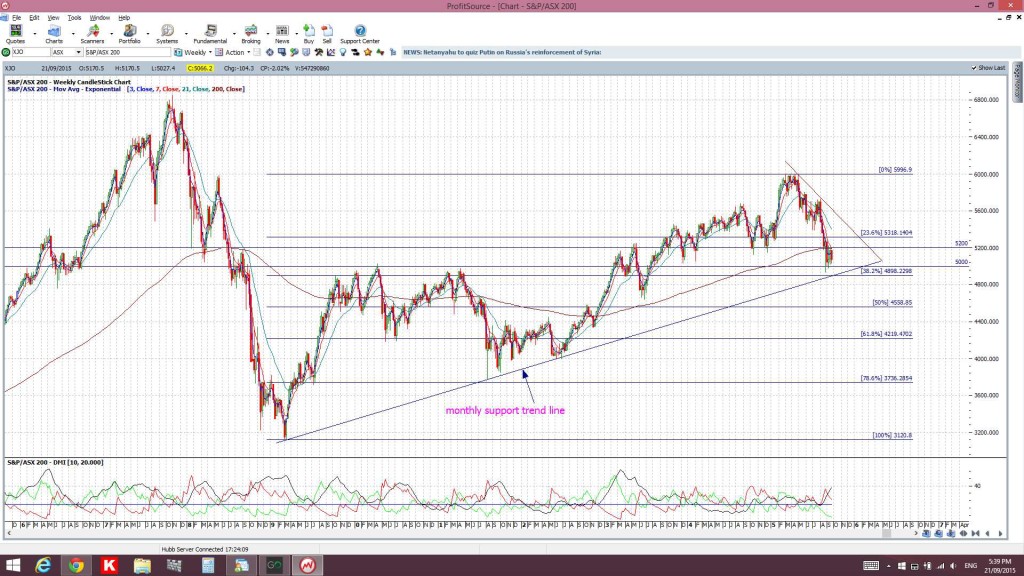
XJO weekly: this chart shows price action also within a more recent and smaller-scale triangle:
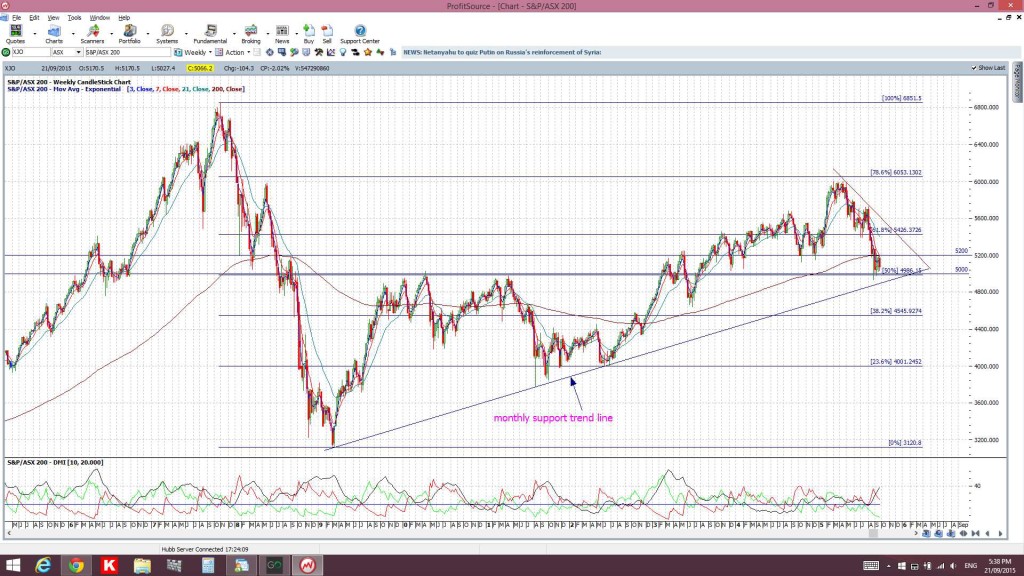
XJO weekly: Placing Fibonacci on the GFC swing-low move shows how the 5,000 level ties in closely with the 50% retracement fib. This is a huge level for the index and if this gives way then the support trend line will come into focus, closely followed by the next fib near 4,500:
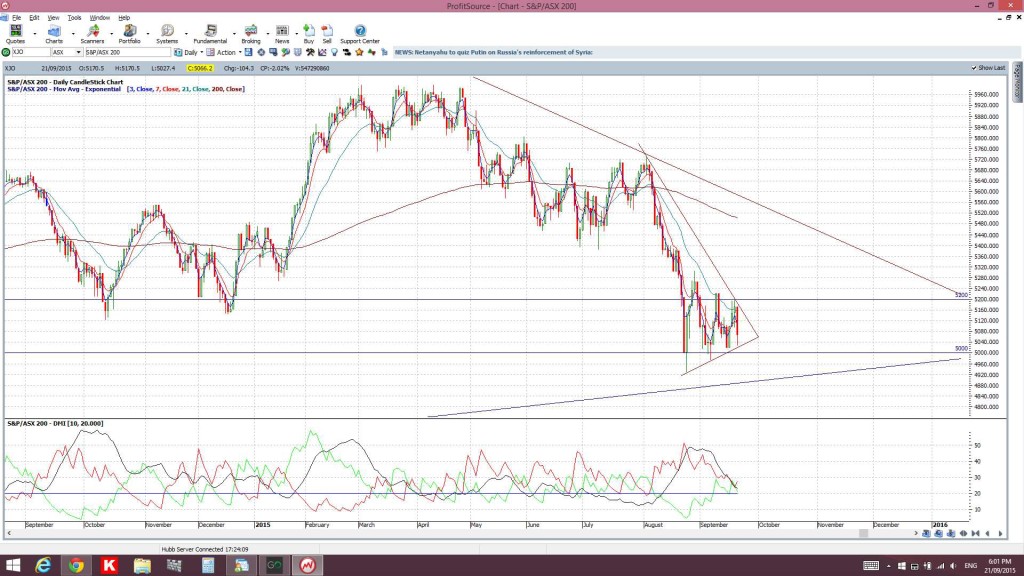
XJO daily: there is an even smaller triangle on the daily chart. Thus, making for a daily triangle within a weekly triangle within a monthly triangle. Note also how the ADX (black line) is still trending lower. This all simply spells out Consolidation!
Summary: there are plenty of levels to watch on the XJO:
- daily, weekly and monthly triangle trend lines: bullish and bearish.
- For bearish breakdown: the 5,000, 4,500 and 4,200 sit near multiple Fibonacci levels and deserve focus.
- For bullish breakout: 5,200, the previous high near 6,000 and, then, the pre-GFC high near 6,800 before the target of 10,400.


