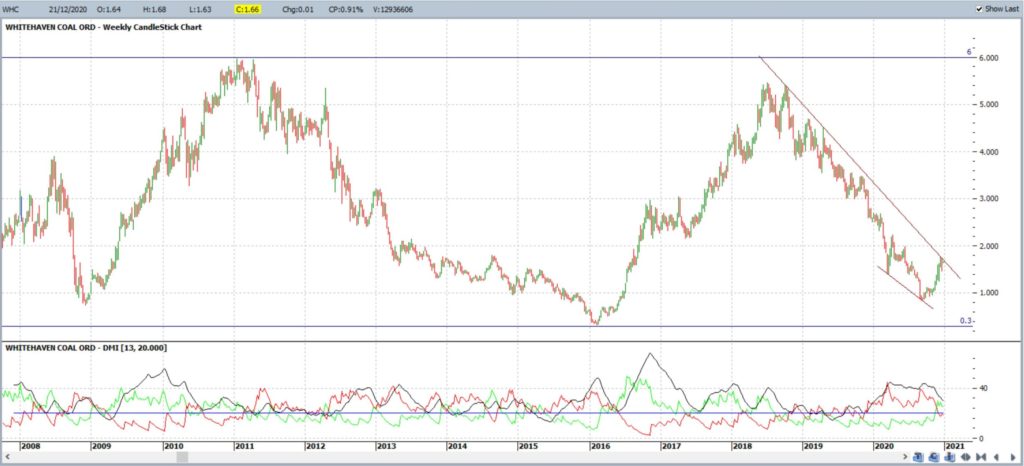
A member asked me to review an Australian ASX stock, Whitehaven Coal: WHC. Coal mining and Aussie coal exports have been in the news of late as part of the evolving trade tensions experienced with China. There have also been some management issues for the company this year. Despite all of this, price action for Whitehaven Coal has been recovering over the last two months and is now shaping up within a potential bullish-reversal pattern. The charts below show how I am seeing price action on Whitehaven coal shaping up from a technical perspective. As I always advise, trade what you see and not what you think.
WHC weekly: the price range for WHC has been from Lows around $0.30 up to Highs around $6. I do note the look of a bullish-reversal Descending Wedge on the weekly chart:
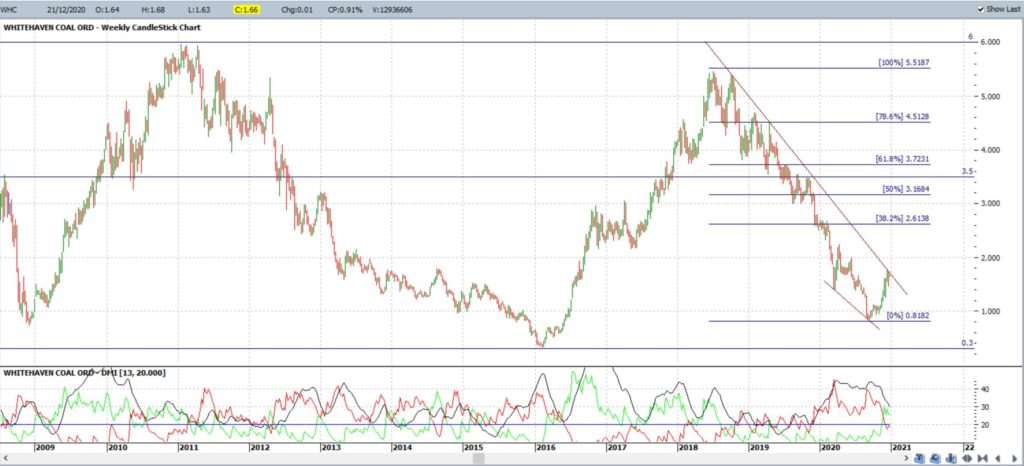
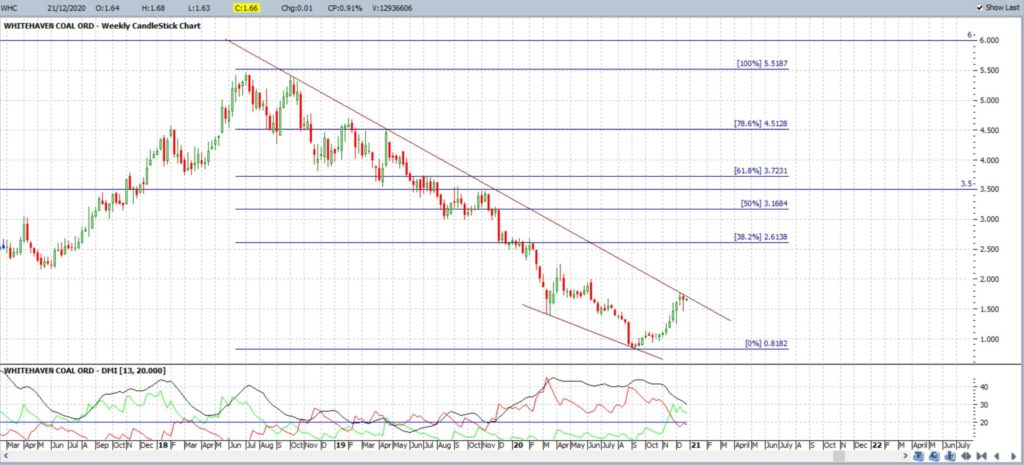
WHC weekly + Fibonacci: I have placed Fibonacci retracement on the latest swing Low move: Oct 2018- Sept 2020. The $3.50 region seems to be a decent reaction zone and this lies just before the weekly chart’s 61.8% Fibonacci so would be the target for any bullish wedge breakout:
WHC weekly + Fibonacci (expanded): the expanded chart shows the wedge trend lines more clearly:
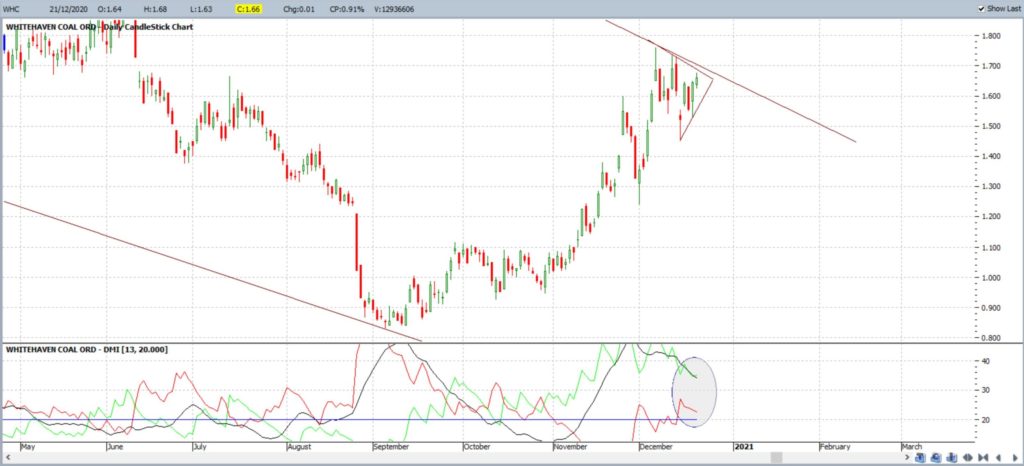
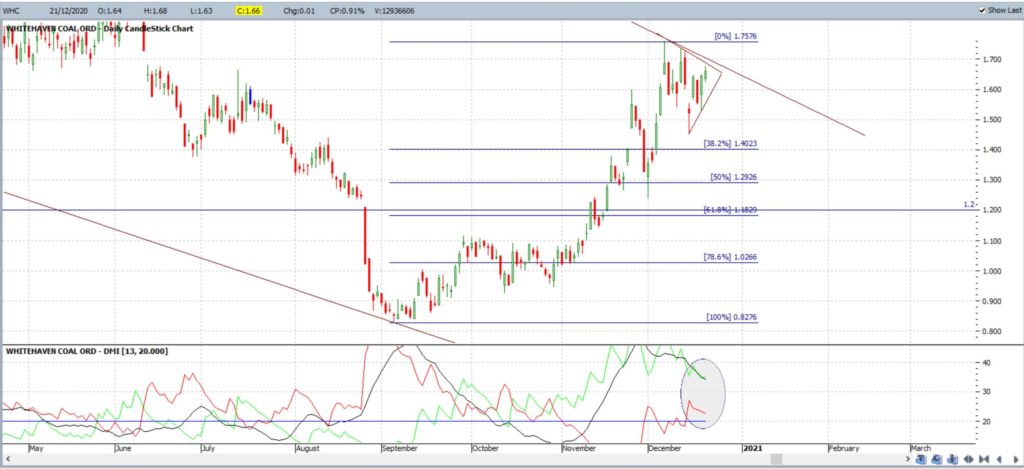
WHC daily: the daily chart shows a Bull Flag style formation as price consolidates under the weekly chart’s upper wedge trend line:
WHC daily+ Fibonacci: Fibonacci retracement has been placed on this latest swing High move: Sept 2020 – Dec 2020. Any bearish Flag breakout here would bring the $1.20 region into focus as this is near the 61.8% Fibonacci and is also a bit of a reaction zone.
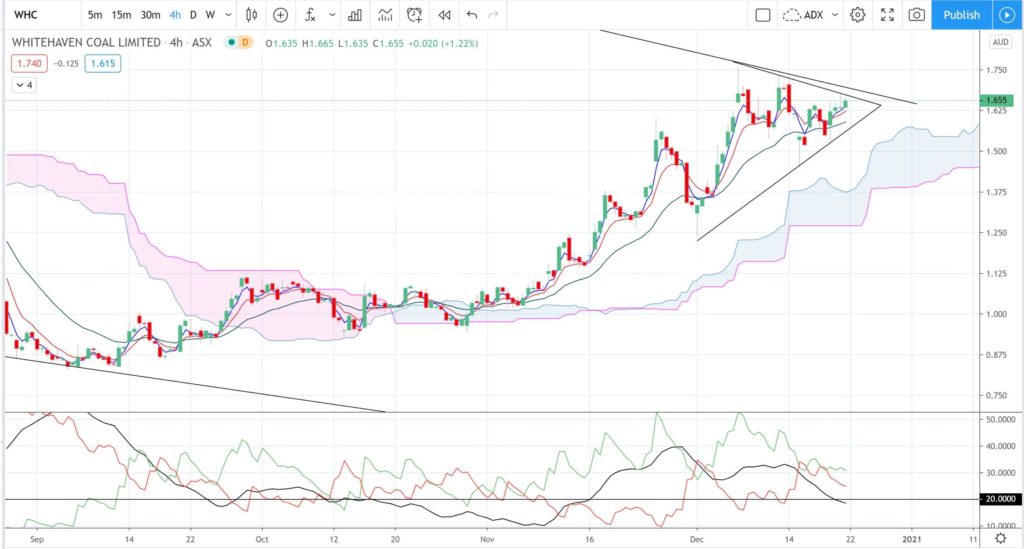
WHC 4hr: note how price action is above the 4hr Ichimoku Cloud which is supportive. Note, also, how the ADX gave a good clue about the start of this recent bullish run. The ADX is currently back below the 20 threshold so watch the Bull Flag trend lines for any new momentum breakout:
Concluding thoughts: Price action on WHC is shaping up in weekly chart bullish-reversal Descending Wedge and there is a Bull Flag within this wedge. Breakout targets are summarised below:
- Any bullish daily Flag and weekly wedge breakout would bring $3.50 into focus.
- Any bearish Flag breakdown would bring $1.20 into focus.


