Oil and USO have been in general decline since the 2008 Global Financial Crisis period but might be worth watching for any mean-reversion activity. Oil has spent much of the last two years chopping around either side of the $60 S/R level but is now starting to look a bit bullish as it holds above this key level with increased ADX and +DMI momentum on the daily chart time frame. The Oil-based ETF, USO, is also starting to look more bullish on this time frame and may be worth considering for some trading potential.
Oil
Oil monthly: the monthly chart of Oil shows how significant the $60 has been over recent years. The monthly candle has yet to close but is currently popping up through a 12-month triangle trend line so watch to see how this closes after Tuesday. The ADX momentum indicator (black line) has yet to engage above 20 so keep an eye on this metric as well. Note the 12-year bear trend line above current price that cuts in near the $70 region:
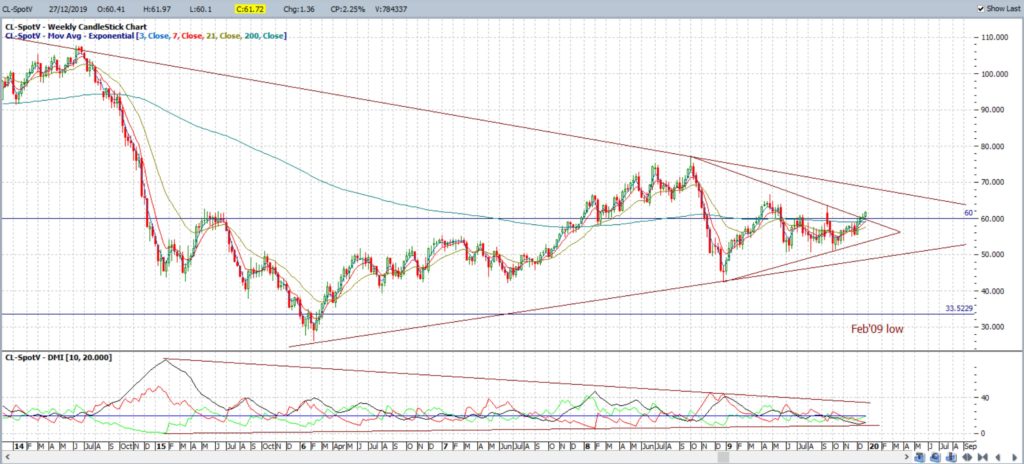
Oil weekly: The weekly time frame shows this triangle breakout and bullish momentum looks to be ticking higher so watch for any ADX (black line) and +DMI (green line) move above the 20 threshold:
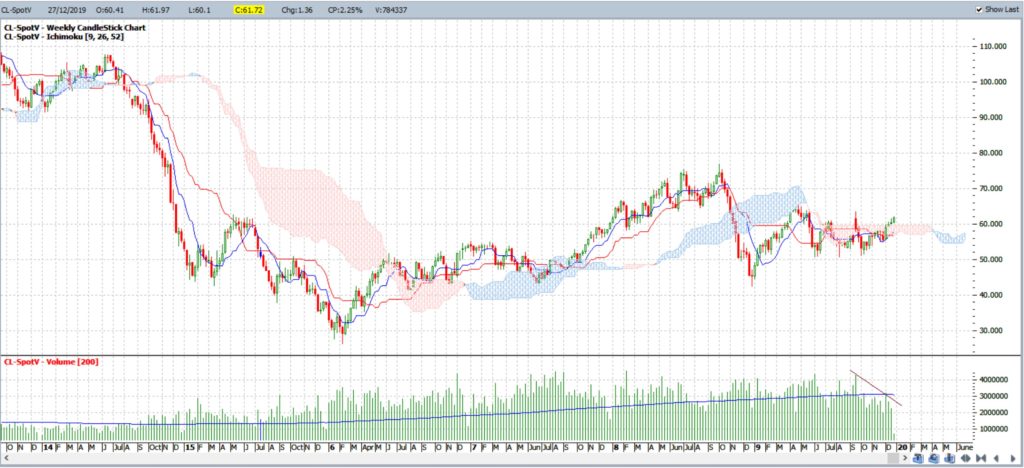
Oil weekly Cloud: Price action is back above the weekly Ichimoku Cloud which is bullish though. For those who do not know about the Ichimoku indicator: do not stress; I use the Ichimoku Cloud as a measure of fluid support and resistance: trading above the Cloud is bullish and trading below the Cloud is bearish:
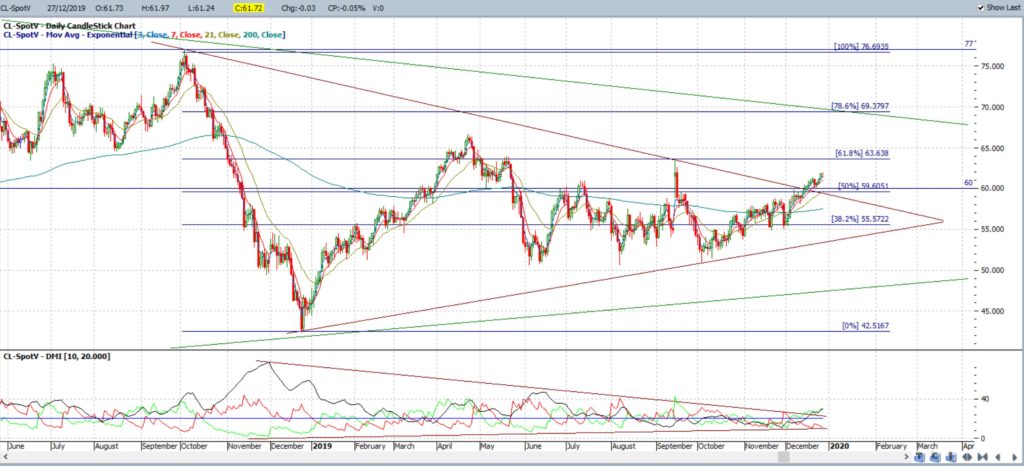
Oil daily: the daily time frame shows bullish momentum supporting this triangle breakout. Note how the ADX and +DMI are above 20 and have broken out of their trading range:
USO: United States Oil ETF
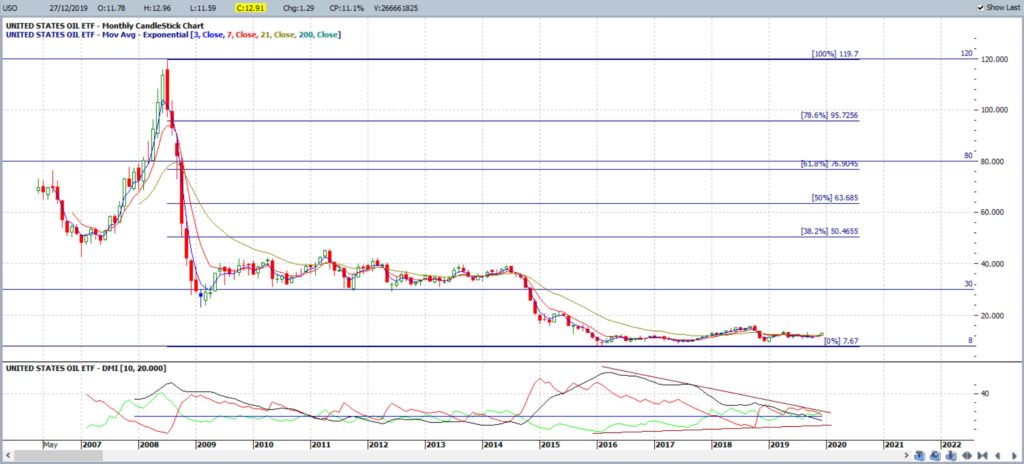
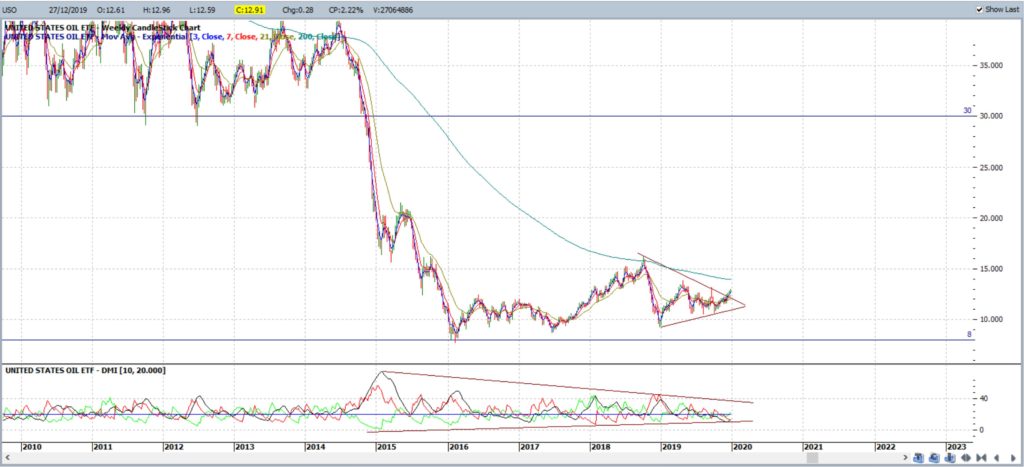
USO monthly: the main points to note on the USO monthly chart is that price action seems to have based above $8 and that momentum has been declining and contracting for the last four years:
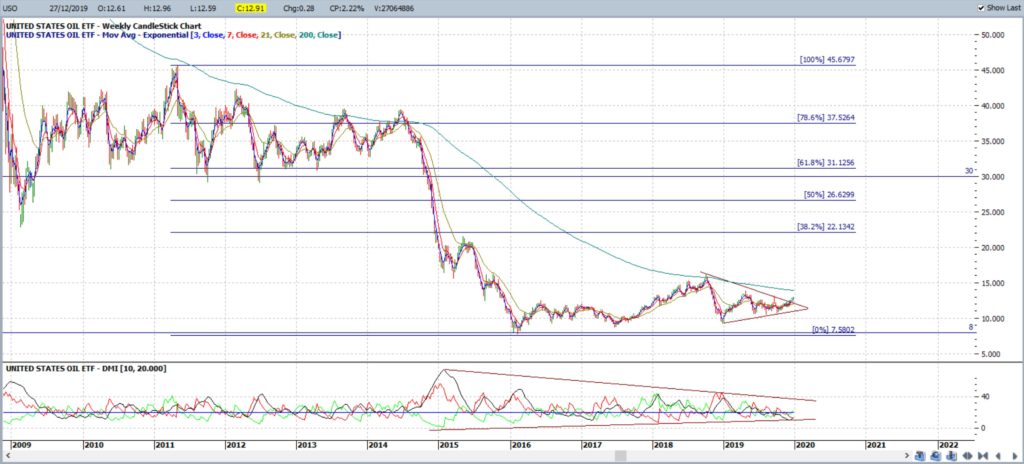
USO weekly: like with Oil, there has been a triangle breakout but no momentum breakout just yet. However, the +DMI is above 20 so watch for any move of the ADX above 20. Any bullish continuation would bring the $30 level into focus as this is previous S/R and is near the 61.8% fib of the most recent swing Low move (2011- 2019):
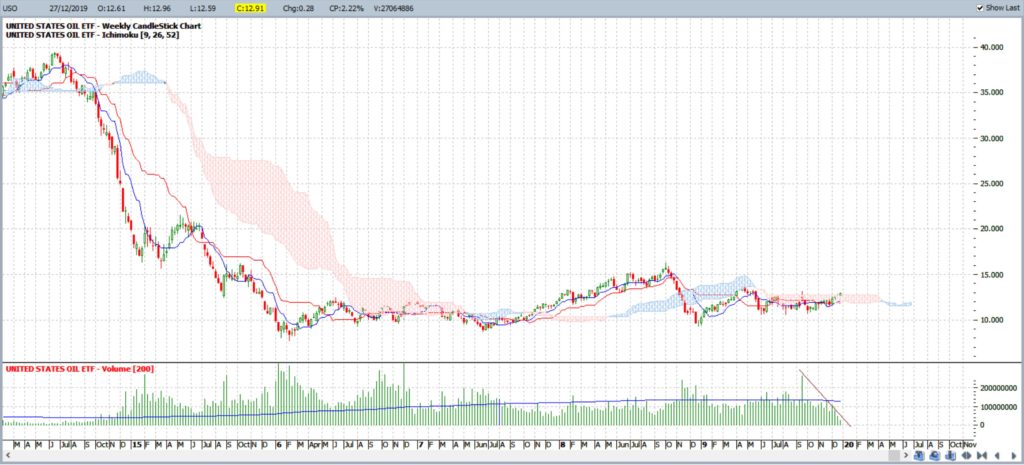
USO weekly + Cloud: here, too, price action is back above the weekly Ichimoku Cloud which is bullish:
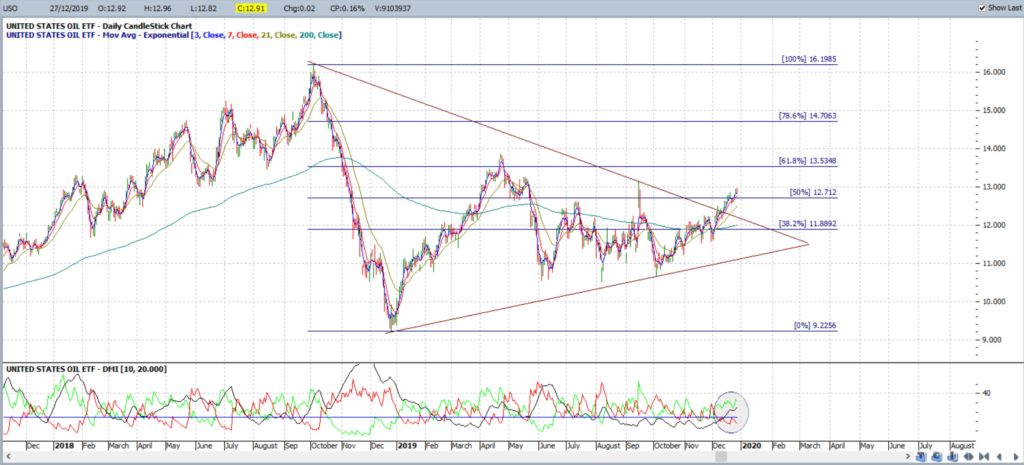
USO daily: the daily chart of USO mirrors the daily chart of Oil in that the triangle breakout is supported by the ADX and +DMI being above 20. The $13 level looks to be a reaction level of late and so it might be worth watching for any close and hold above $13 before engaging with any USO trades.
Concluding thoughts:
Oil and USO have been in general decline since the 2008 Global Financial Crisis period but I am on the lookout for any mean-reversion. Recent daily chart trend line breakouts show bullish momentum support but this is not yet reflected on weekly or monthly time frames. The Oil ETF, USO, is currently just below $13 but any close and hold above this level would be encouraging and would bring the $30 level into focus.
NB: All traders need to manage risk in their activities and only use funds that are surplus to need.


