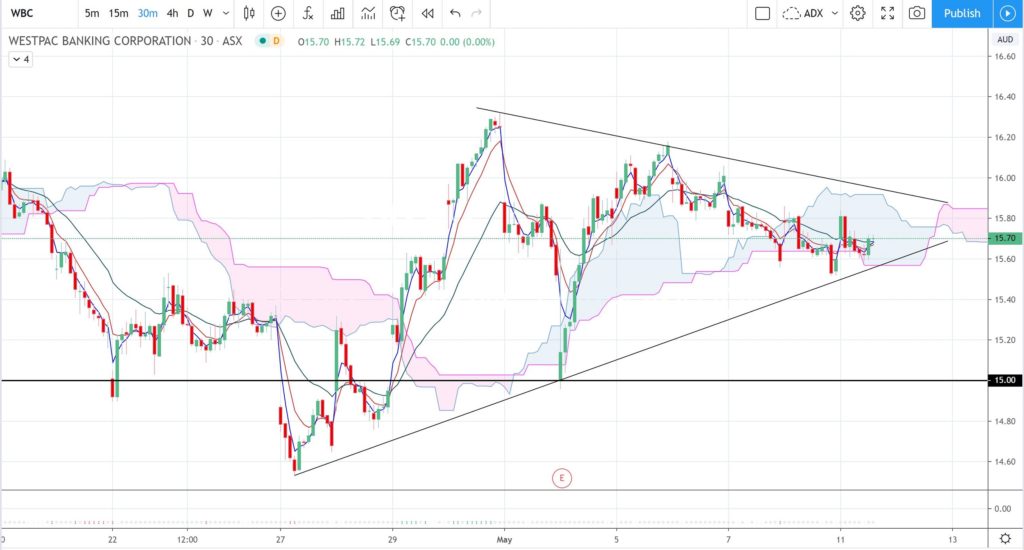
Back in November 2019, when Westpac Banking Corporation (WBC) was trading at $24.77, I flagged $15 as a worst case scenario level for the bank stock. Price action has now tested this key level and is currently consolidating above this support zone. There are no guarantees which way price action will head from here but I’m on the lookout for any relief rally, even if only short lived.
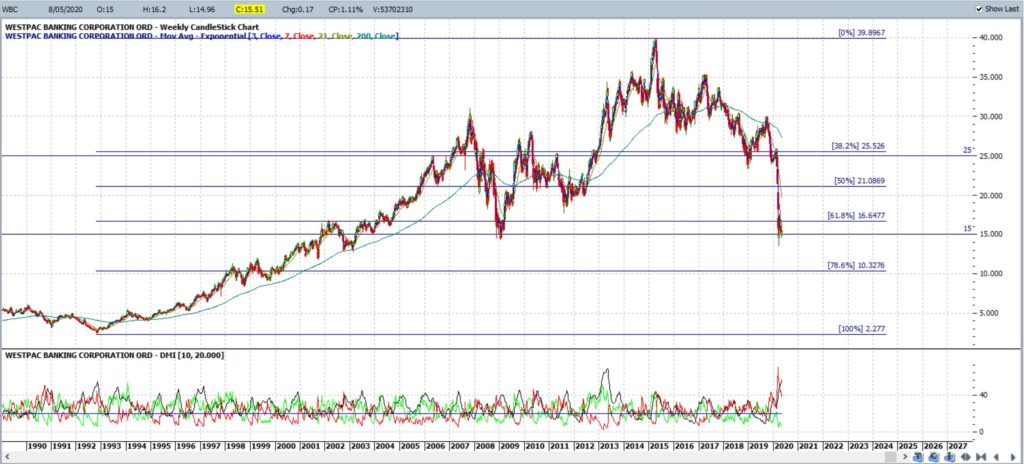
WBC weekly: Westpac Banking Corporation (WBC) has pulled back to the $15 support zone so watch to see if this level will hold. This was a previous support zone and is also near the weekly chart’s 61.8% Fibonacci; level for added confluence:
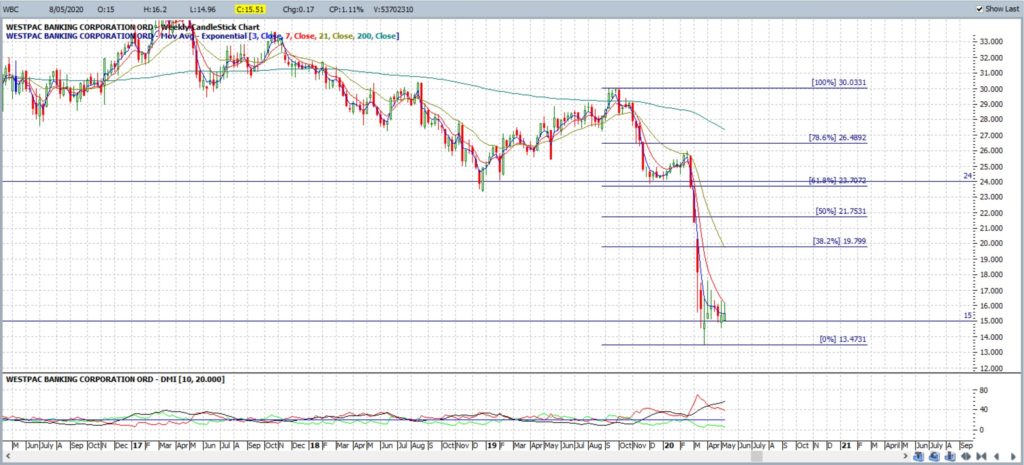
WBC weekly (expanded): note how price is holding above the $15 level. Any relief rally from here would bring the daily chart’s 61.8% Fibonacci level into focus and this is up near $24 which is another S/R zone for the stock:
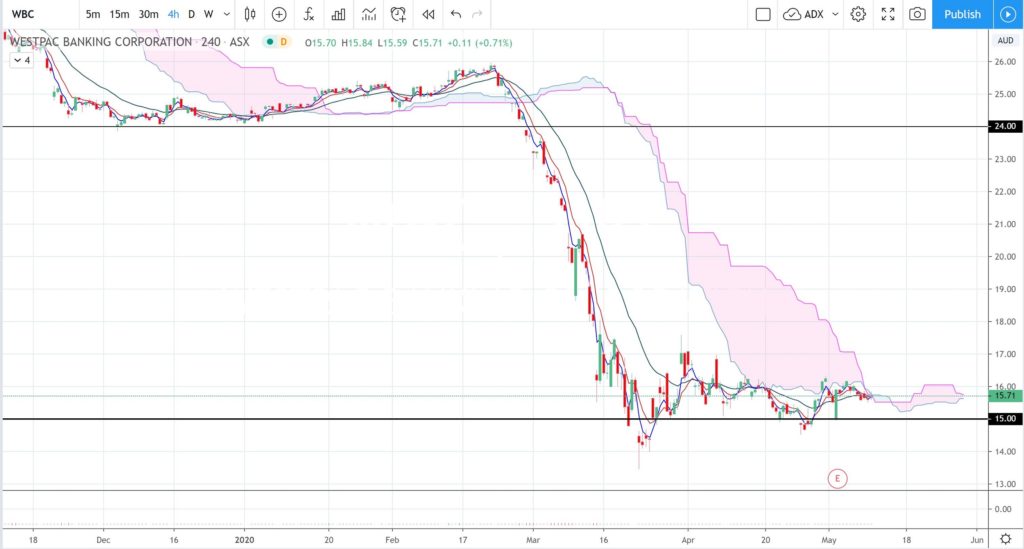
WBC 4hr: The 4hr chart shows the stock navigating its way through the 4hr Ichimoku Cloud so watch for any successful emergence from this resistance zone:
WBC 30 min: the 30 min chart is worth monitoring for any breakout from the recent consolidation. There are trend lines to monitor for any new momentum breakout:
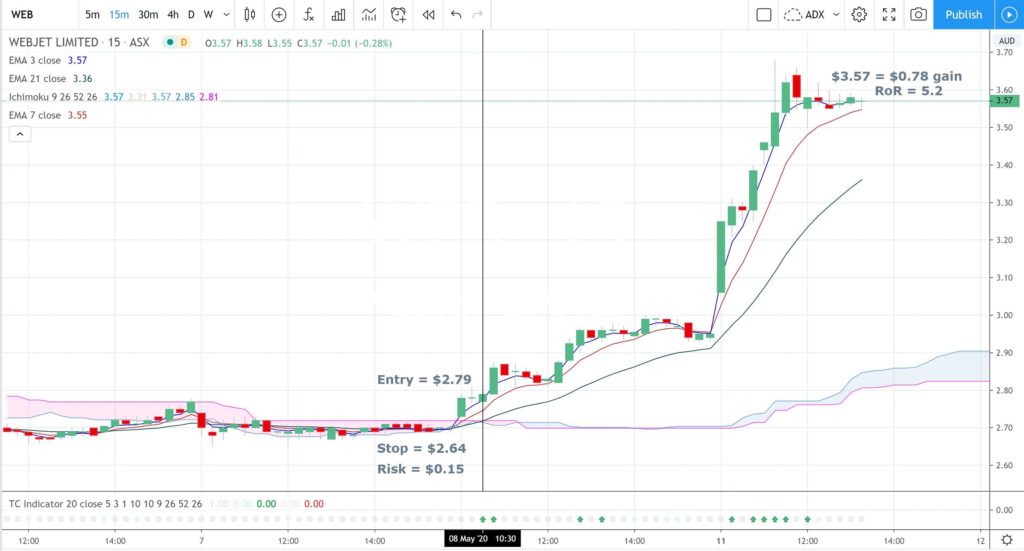
TC signal: I will also be dropping down to the 15 min chart to monitor for any TC signal on WBC. The chart below of Webjet (WEB) shows the value of monitoring for these signals on the lower time frame:
WEB 15 min:
Summary:
Westpac Banking Corporation (WBC) has pulled back to a major support zone near $15. I’m on the lookout for any relief rally, even if only temporary, and have the $24 level as a potential target. I will also be stalking Westpac for shorter-term TC signals.


