I have been noting for my subscribers over recent weeks about the mean reversion price action that has been developing on Oil. With this in mind, I thought it might be worth assessing the US Oil ETF, USO, to see whether this might be shaping up with any trading potential. The charts in this post are for educational purposes and represent my technical thoughts about Oil and USO.
Oil
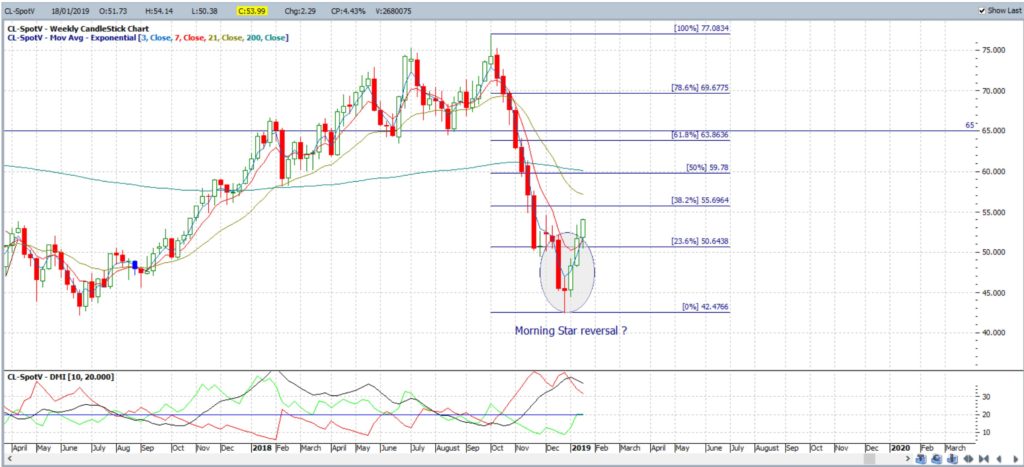
Oil weekly: Following numerous bearish weekly candles, price action for Oil recently printed a bullish-reversal Morning Star pattern and there have been two consecutive bullish weeks since then. Note how the 61.8% fib of this recent swing Low is up near previous S/R of $65: so this is the target for any bullish continuation on Oil:
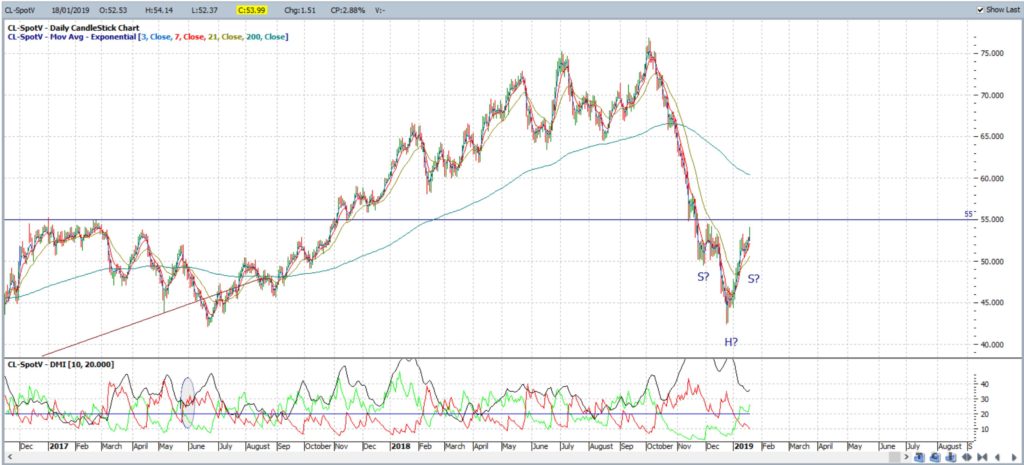
Oil daily: the daily chart of Oil also shows a potential bullish-reversal pattern with an Inverse Head and Shoulder setting up. The neck-line of this pattern is near $55 which is also a previous S/R level:
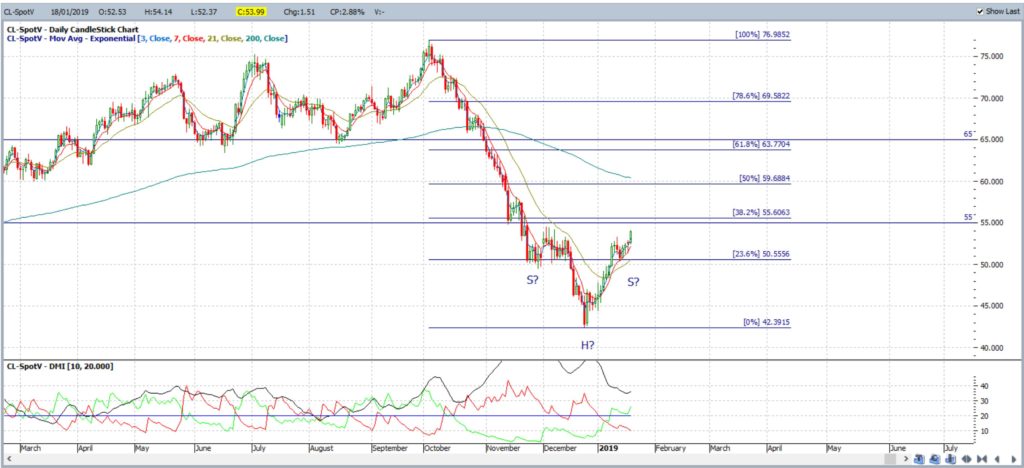
Oil daily: Placing Fibonacci retracement on this daily chart shows the 61.8% level is up near $65, as per the weekly chart above, and so this would be the longer-term target for any bullish break and continuation above $55. For added confluence, this $65 level would also tie in near the target for any Inverse H&S breakout:
USO: Oil ETF
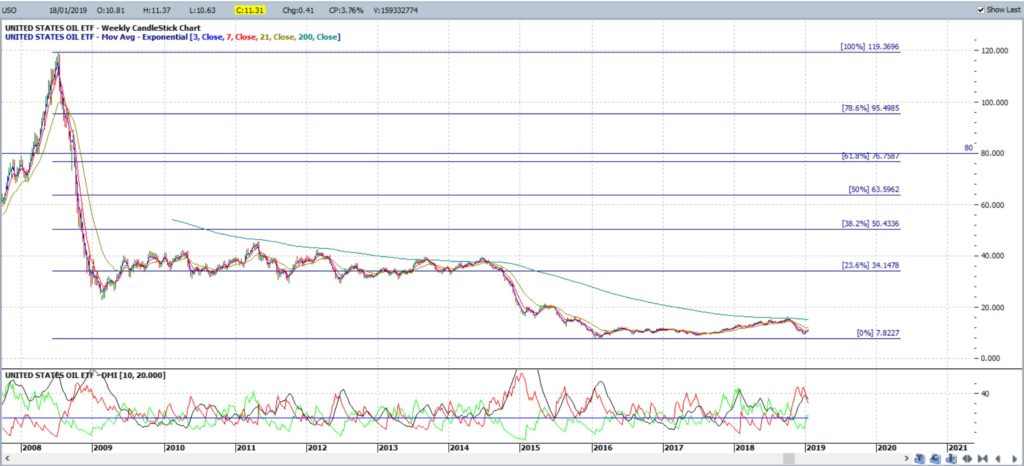
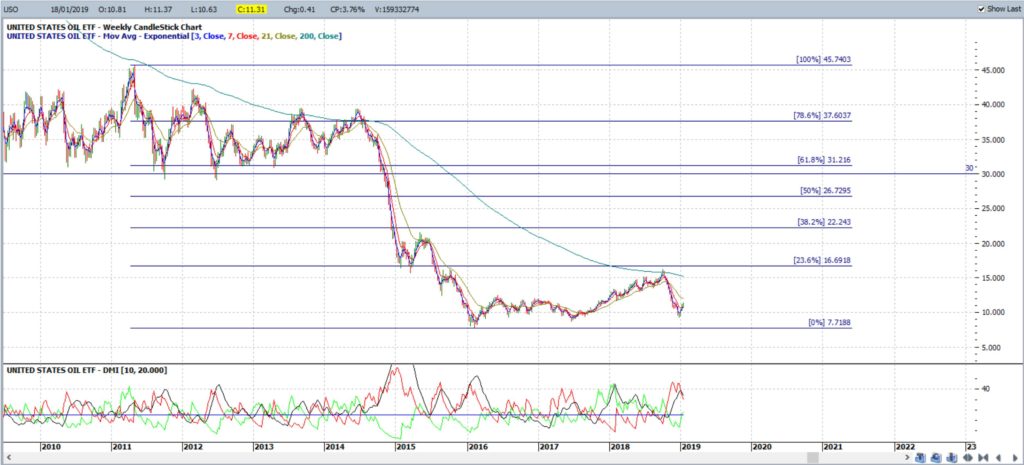
USO weekly (condensed): Price action on the Oil ETF, USO, has been in decline, essentially, since the 2008 GFC and has been skulking along just above the $7 level for the last three years:
USO weekly: Note how the 61.8% Fibonacci level, a popular target for pullbacks, of the most recent weekly swing low move (2011-2019) is near a previous S/R level of $30. This would be the longer-term target for any bullish-reversal continuation move:
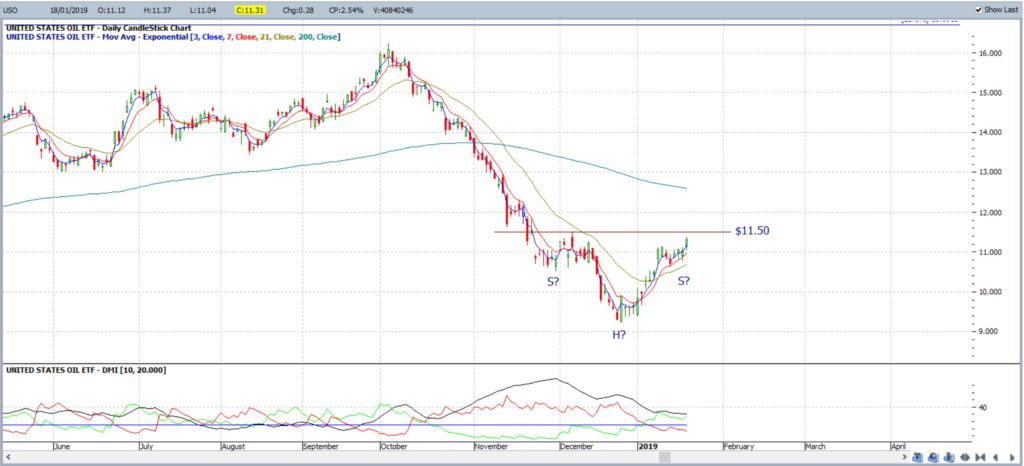
USO daily: drilling down to the daily chart shows a bullish-reversal Inverse Head and Shoulder on this ETF, similar to that seen on Oil. The neck-line here is near $11.50:
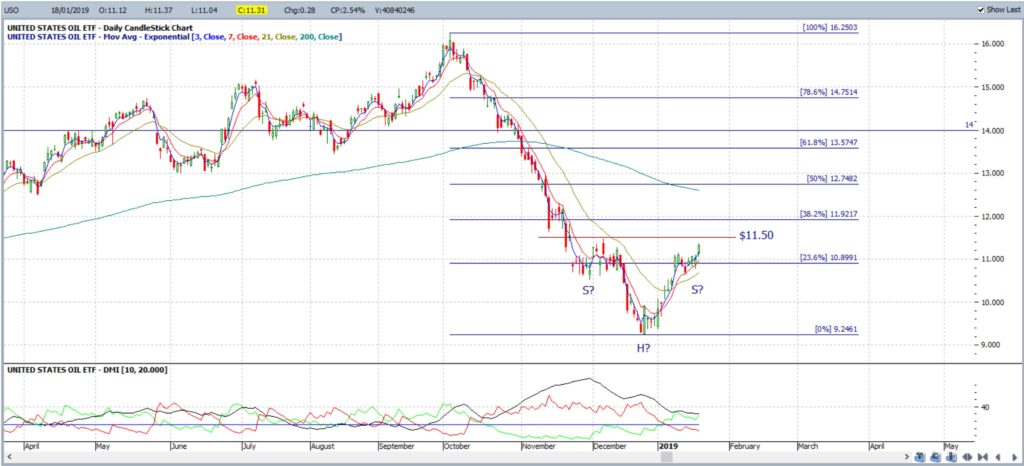
USO daily + Fibs: Placing Fibonacci retracement on this daily chart shows the 61.8% level is up near $14 and so that would be the first target for any bullish break and continuation above the $11.50 neck-line. For added confluence, this $14 level would also tie in near the target for any Inverse H&S breakout:
Summary:
Oil is shaping up with some mean-reversion style price action and so it is not too surprising to see similar evolve on the Oil ETF, USO. The threshold level to watch on USO is the neck-line of a potential bullish-reversal Inverse Head and Shoulder pattern and this comes in at $11.50. Bullish targets for any continuation above $11.50 include:
- $14: the 61.8% fib of the daily chart swing low move and daily chart Inverse H&S target.
- $30: the 61.8% fib of the weekly chart swing low move.


