US stocks have been trading with greater volatility over recent weeks which has sparked some speculation that a major correction is unfolding. Whilst I am the first to agree that trends don’t continue in straight line ad infinitum, I’m not seeing any clues that a correction is underway just yet. In this post I check the pulse of the US majors to get a sense of their current health status. The current monthly candles will close after Monday’s trading so check again to see how trend lines are placed after these candles complete.
S&P500:
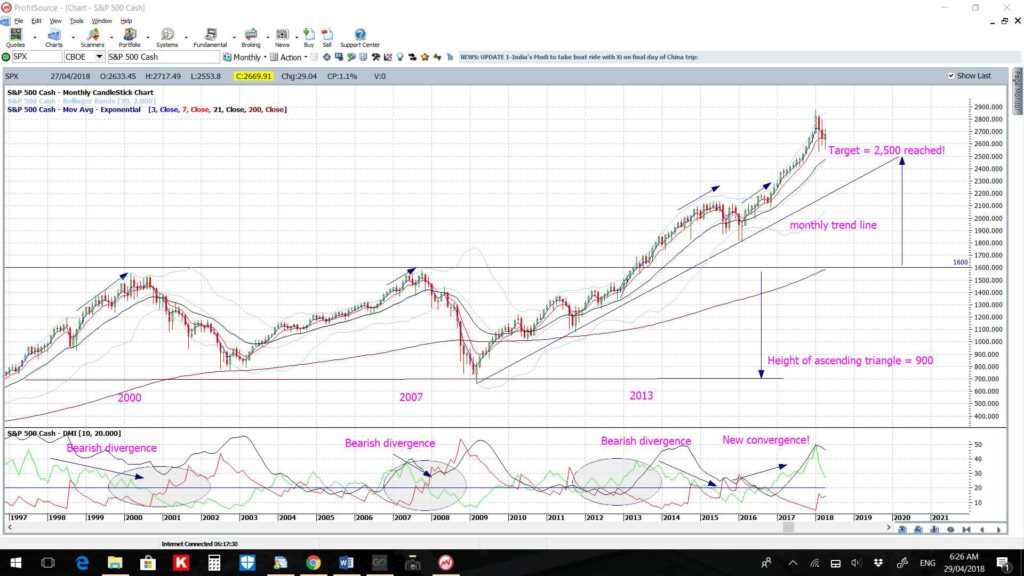
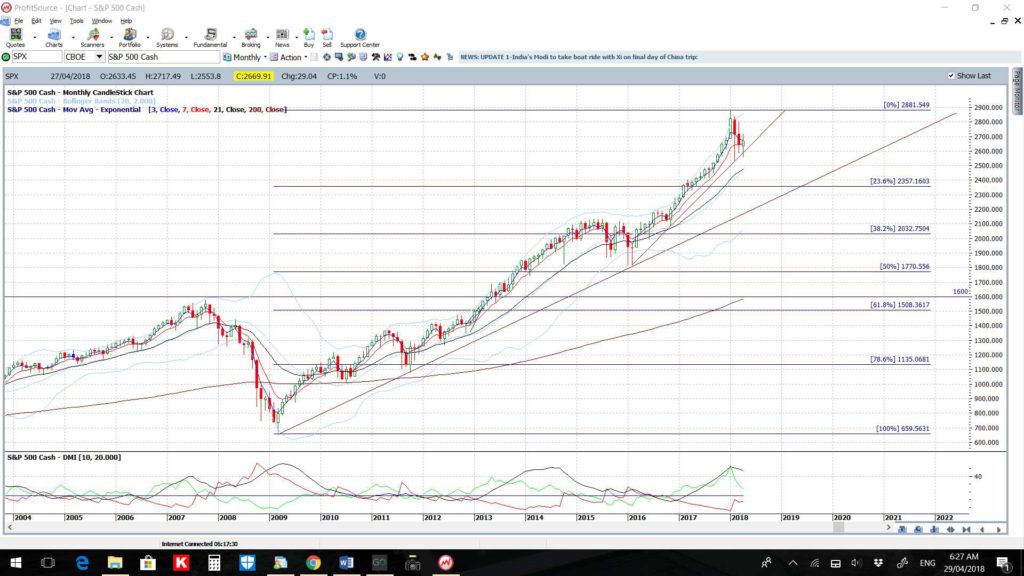
S&P500 monthly: long-term and short term trend lines remain intact.
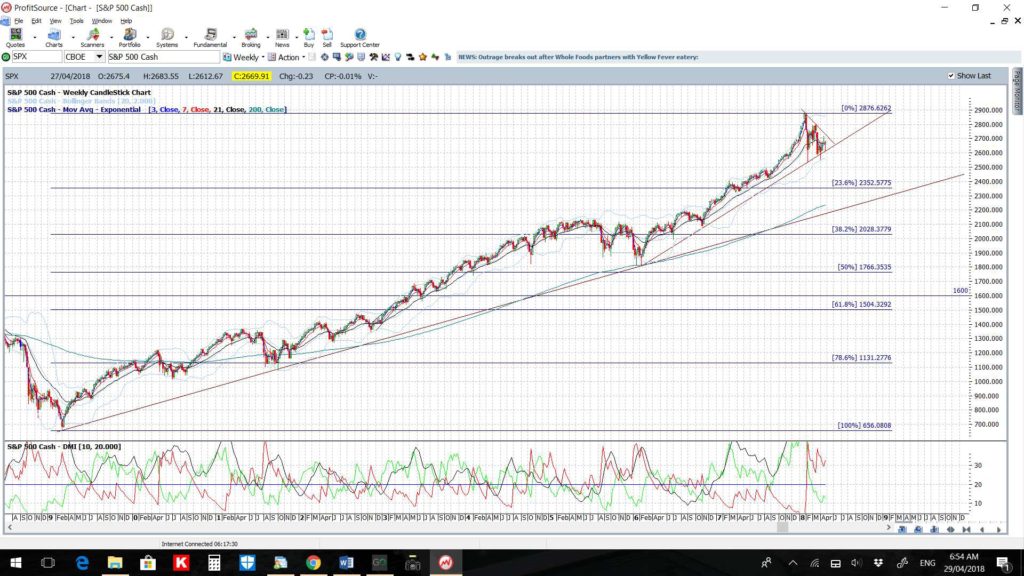
S&P500 weekly: the last 5 weekly candles have been ‘indecision’ style candles. Not very inspiring and certainly demands that caution is required but this is no guarantee that a reversal is underway. ADX momentum is flat at the moment giving little clue.
DJIA:
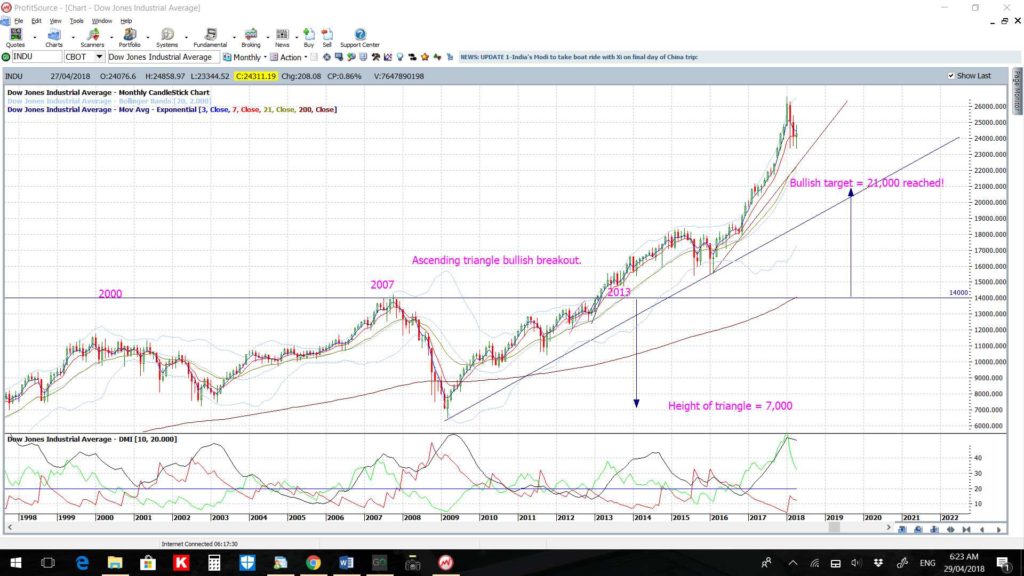
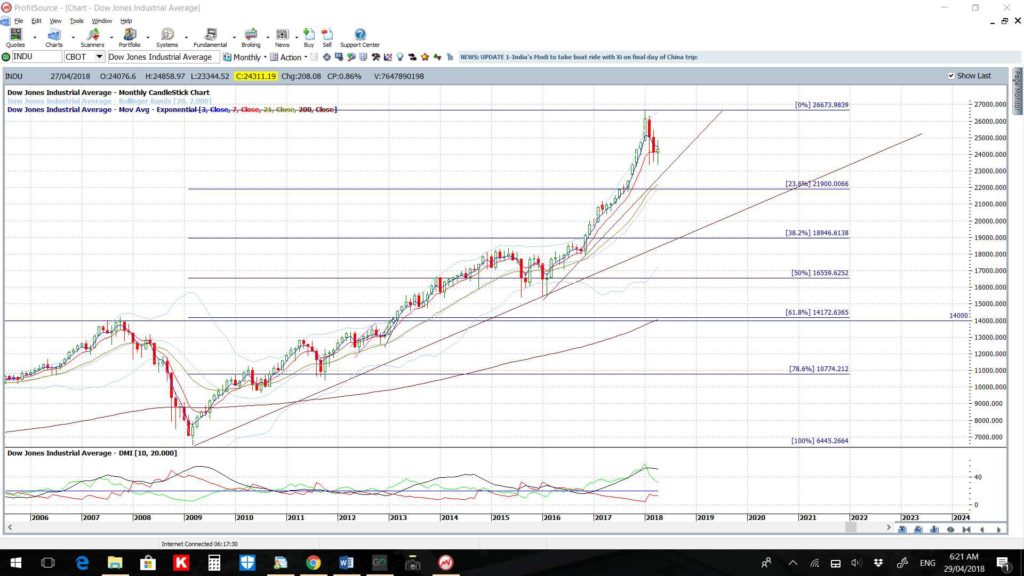
DJIA monthly: long-term and short term trend lines remain intact here too.
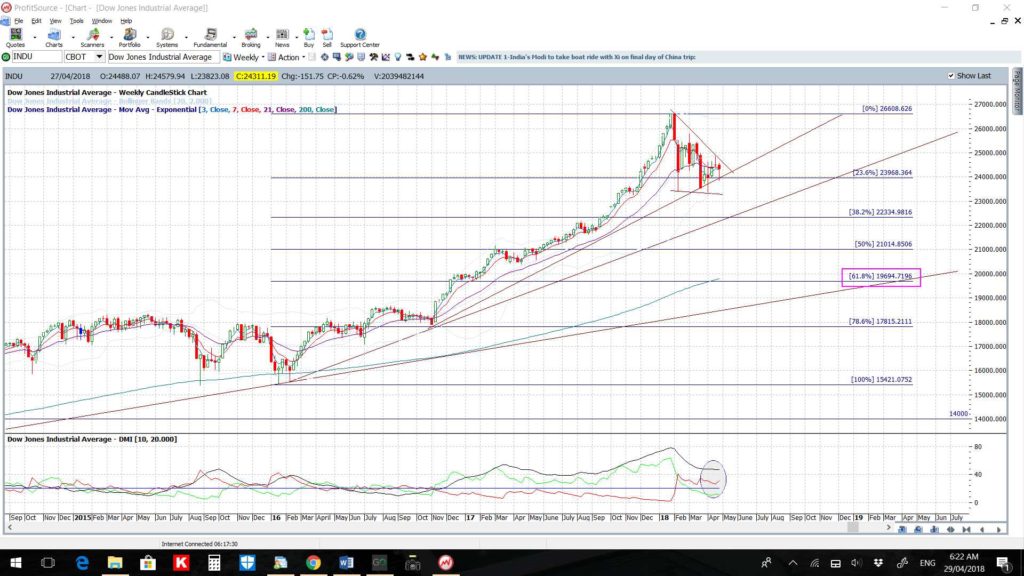
DJIA weekly: as with the S&P500, the last 5 weekly candles have been ‘indecision’ style candles. Not very inspiring and certainly demands that caution is required but this is no guarantee that a reversal is underway. ADX momentum is flat here too at the moment giving little clue.
NASDAQ:
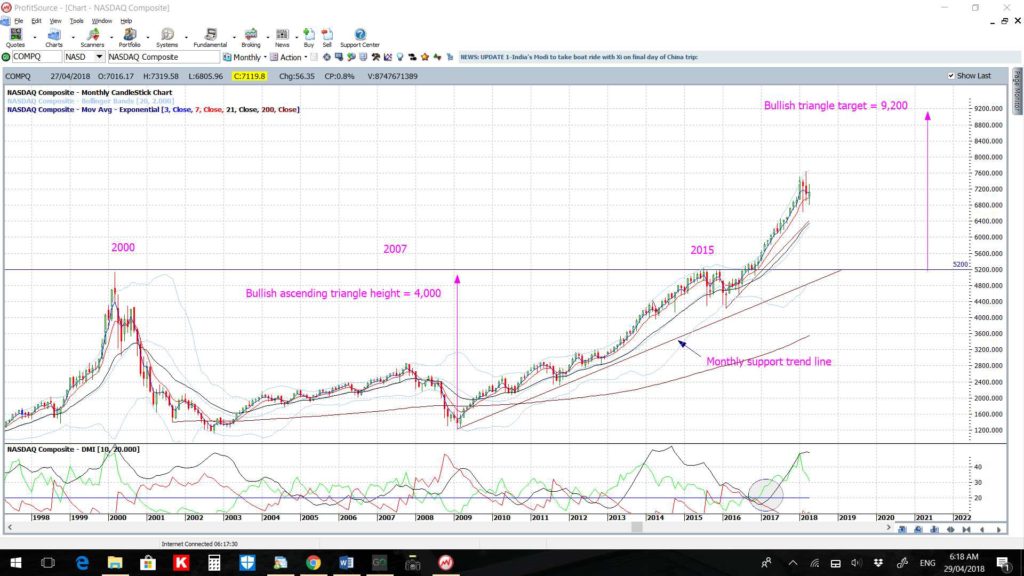
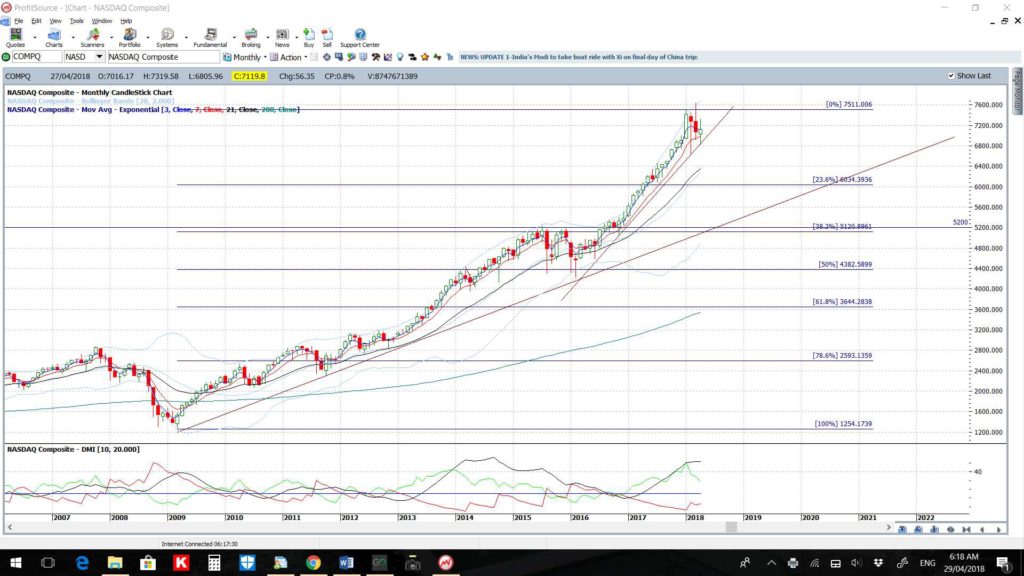
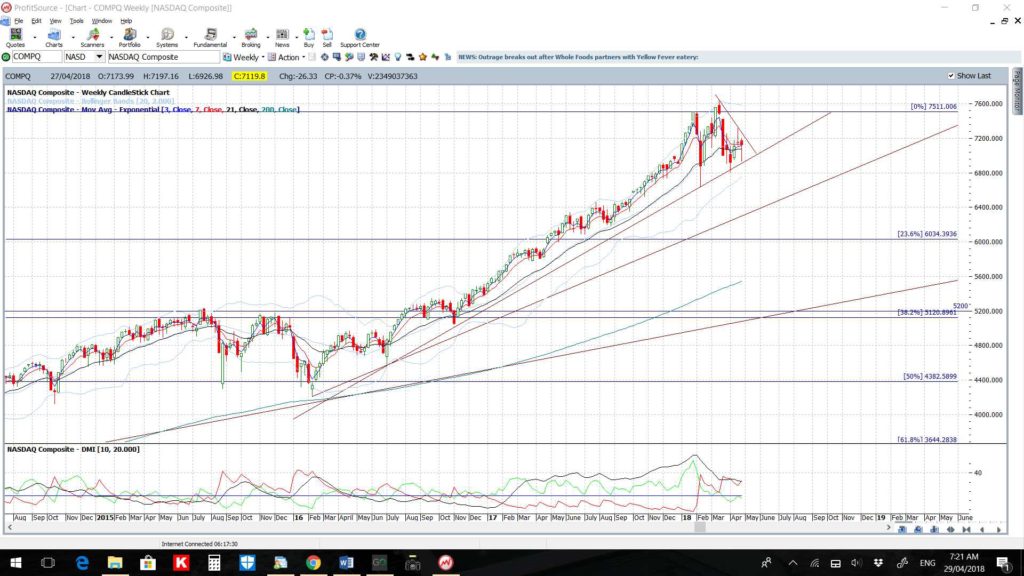
NASDAQ monthly: long-term and short term trend lines remain intact here as well.
NASDAQ weekly: as with the S&P500 and DJIA, the last 5 weekly candles have been indecision style candles. Not very inspiring and certainly demands that caution is required but this is no guarantee that a reversal is underway. ADX momentum is actually declining here so watch for any clues if this resumes to the upside.
Russell-2000:
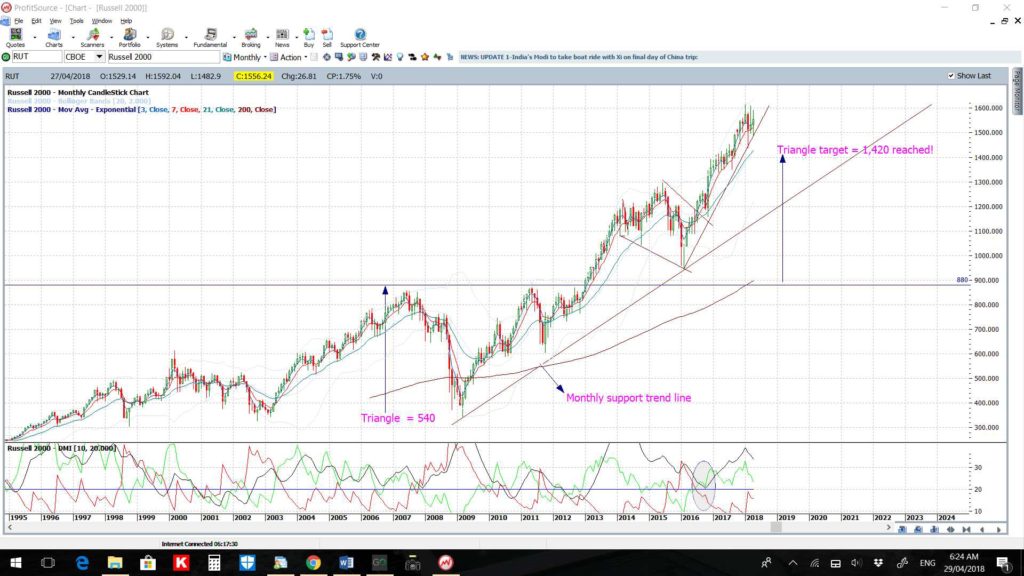
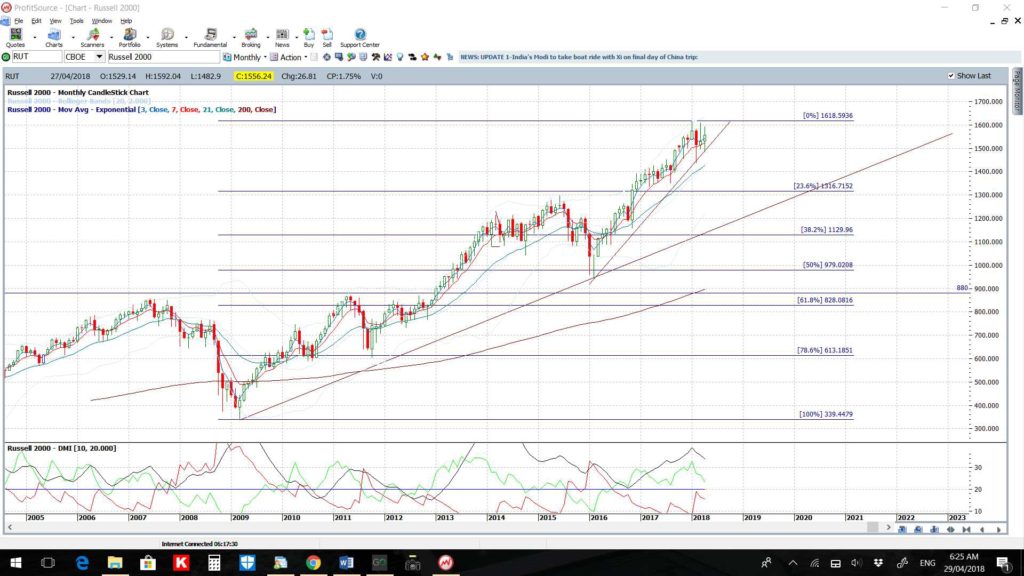
Russell-2000 monthly: long-term and short term trend lines remain intact here as well.
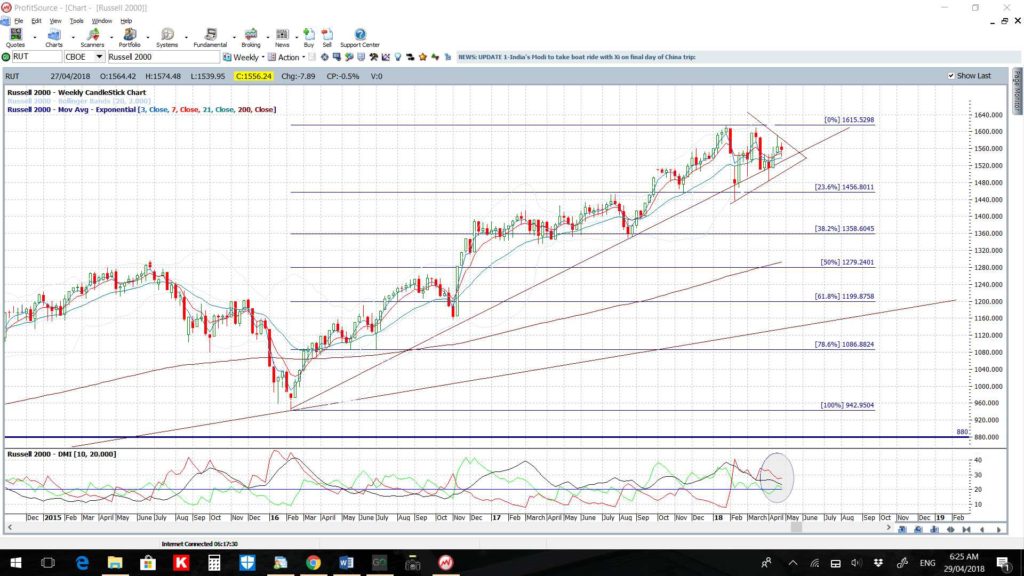
Russell-2000 weekly: there have been a few ‘indecision’ style candle scattered over recent weeks but like with the other indices, whilst this spells caution it doesn’t spell correction. Just yet that is. ADX momentum is declining here too so watch for any new uptick.
US Interest Rates vs S&P500:
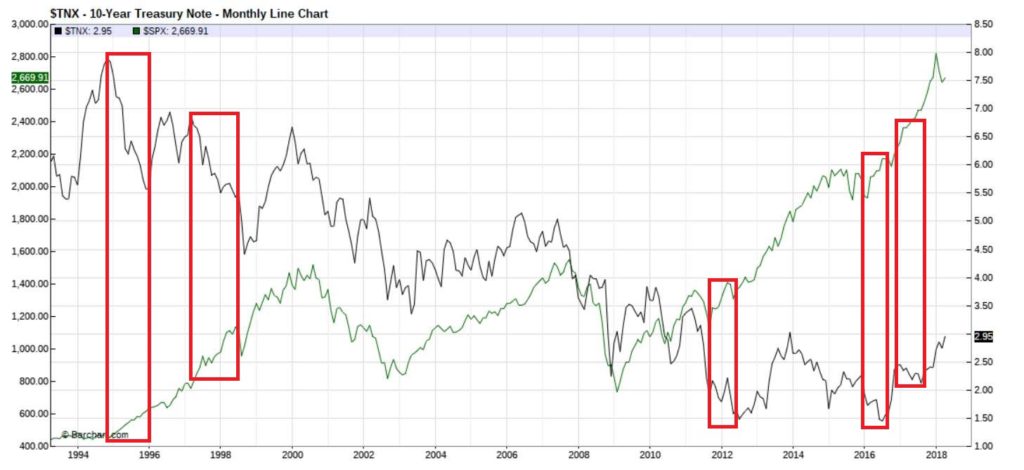
Much of the recent stock market uncertainty has come from fear of rising US interest rates but the following chart reveals that there are only a few periods over recent years where the path of US rates have diverged from stocks. So, the take-away form this is that rising rates is not necessarily disastrous for stocks.
Inverse stock charts:
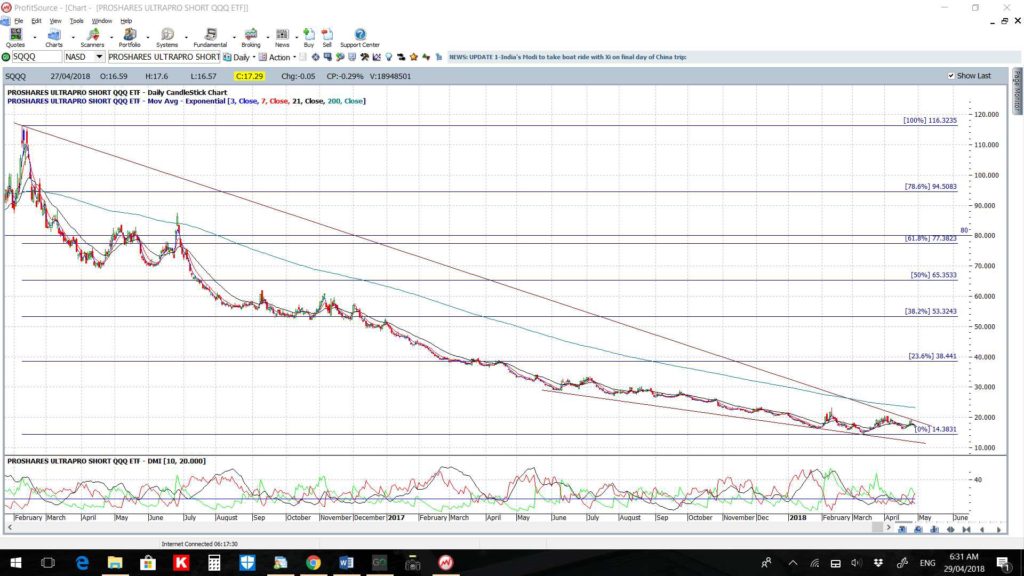
Charts of the inverse of stock performance bear consideration though as they, too, don’t travel in straight lines forever. The chart below is of the inverse, or SHORT, of the NASDAQ-100 ETF, the QQQ. This does have a bit of a bullish-reversal ‘descending wedge’ look to it so I’ll be keeping an open mind here:
SQQQ daily: a bit hard putting trend lines in here due to the curve nature of the movement but price does appear to be slowing and might be trying to base. If so, I’ll be watching for any clues that a reversal is trying to get going. Note how the 61.8% fib is up near previous S/R of 80 and so that would be the longer term target if price action did attempt a recovery:
Summary: The major US stock indices are showing signs of consolidation above support trend lines but, whilst this suggests that caution is required, it does not suggest a major market correction is currently underway. Trends do not travel in straight lines forever and so at some point a healthy pullback is to be expected as part of the normal ebb and flow of markets but there is no confirmation that this process has started. As well, rising US interest rates is no guarantee that stock will sell off either.
Watch the weekly and monthly charts of the US majors for any break and hold below support trend lines that is confirmed by increased selling momentum and increased trading volume to assess when a market pullback might be developing.


