Global stocks have been hammered over recent trading sessions but, in my humble opinion, this is only helping to affect the necessary testing of some key trend lines before any sustainable bullish continuation can possibly evolve. This post reveals charts of some key US stock indices and one stock ETF and the particular levels I would like to see tested, but then to hold, before any possible bullish continuation.
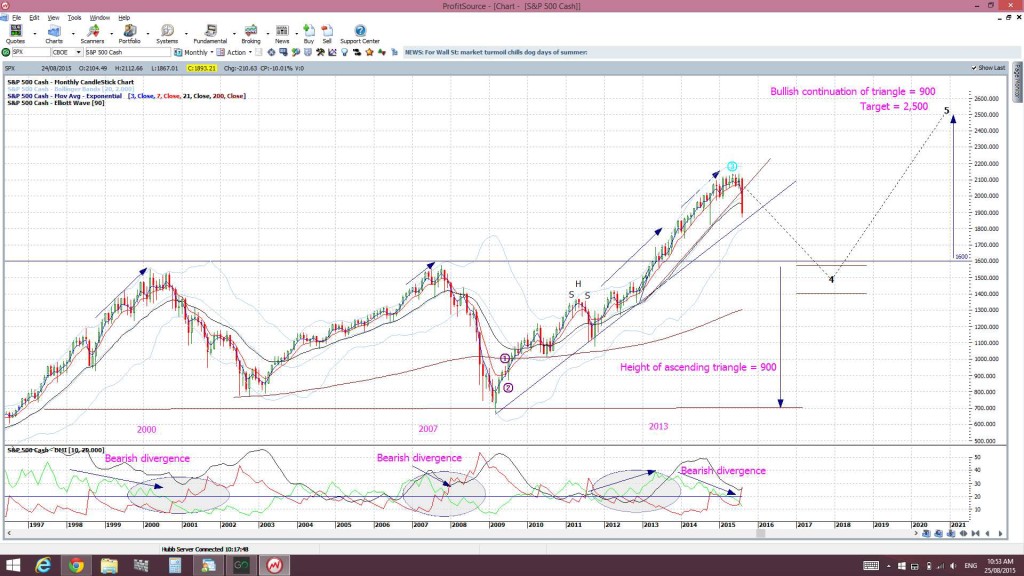
S&P500 monthly:The bullish break up through 1,600 was a major achievement but this level has only been tested once; shortly after the initial breakout. As painful as it might be, I believe we need to see a test and hold of this 1,600 level before any sustainable period of bullish continuation can evolve:
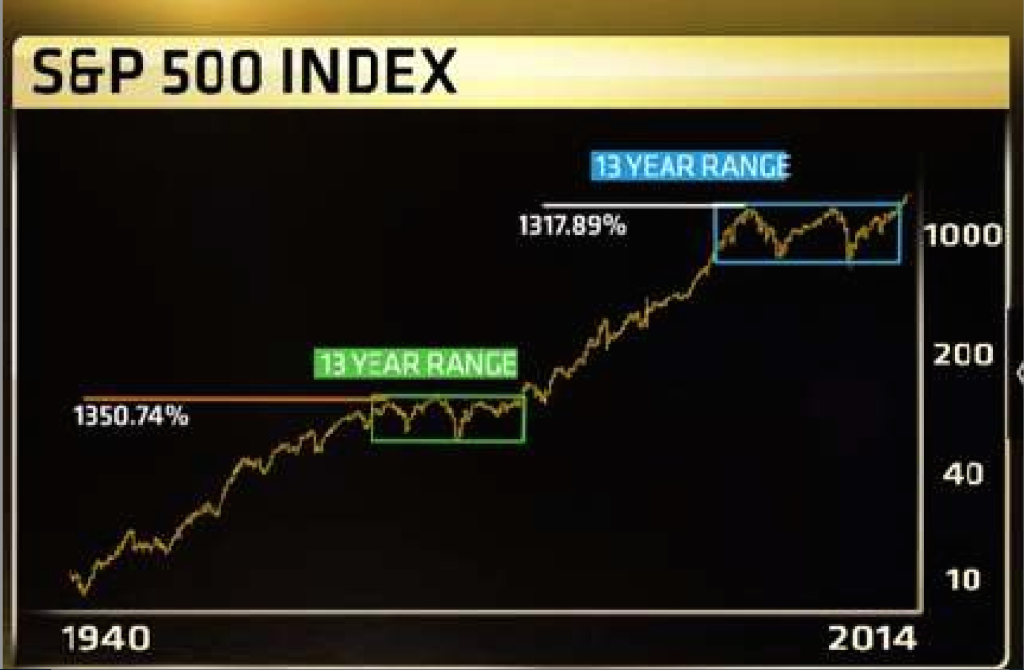
S&P500 70 year chart: the top of the 13 year range on the RHS of the chart equates to this 1,600 level. Note how the previous 13 year trading range also tested the breakout region prior to continuation. We ‘need’ the same test of 1,600:
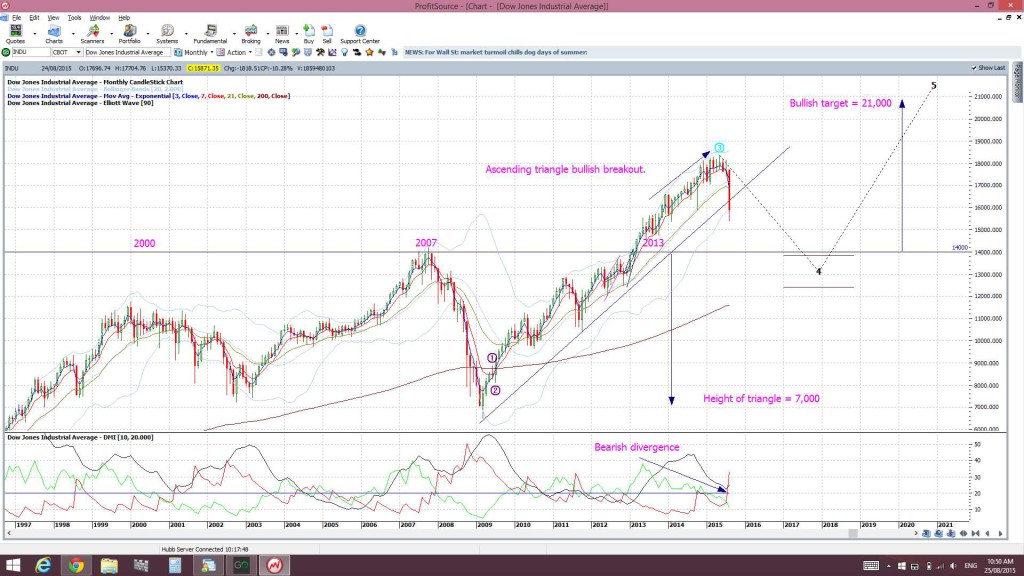
DJIA monthly: as with the S&P500, I believe we need to see a test and hold of 14,000 before any sustainable bullish continuation can possibly occur:
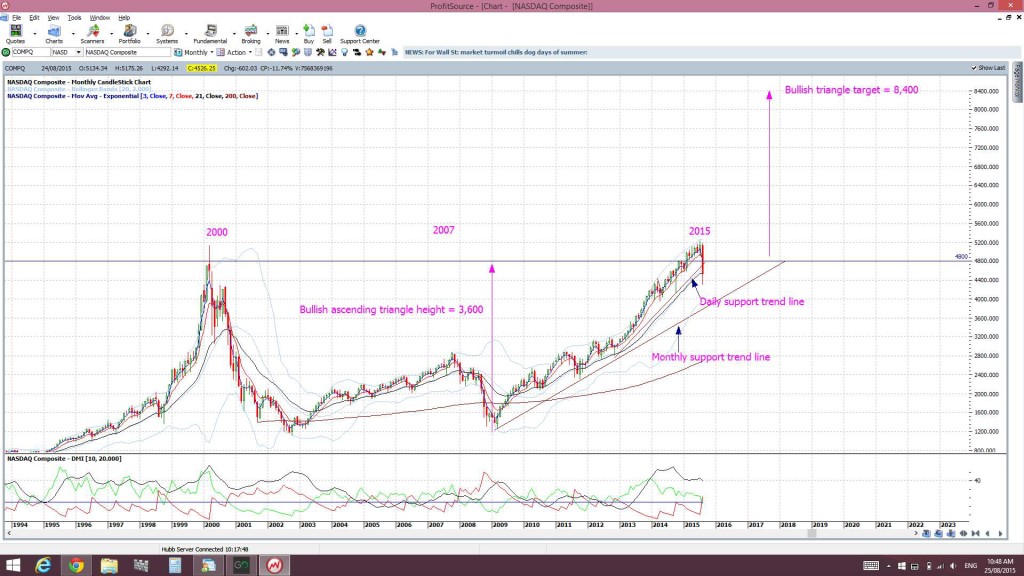
NASDAQ monthly: we’ve had the test of the 4,800 level here. Now we need to see if it can hold:
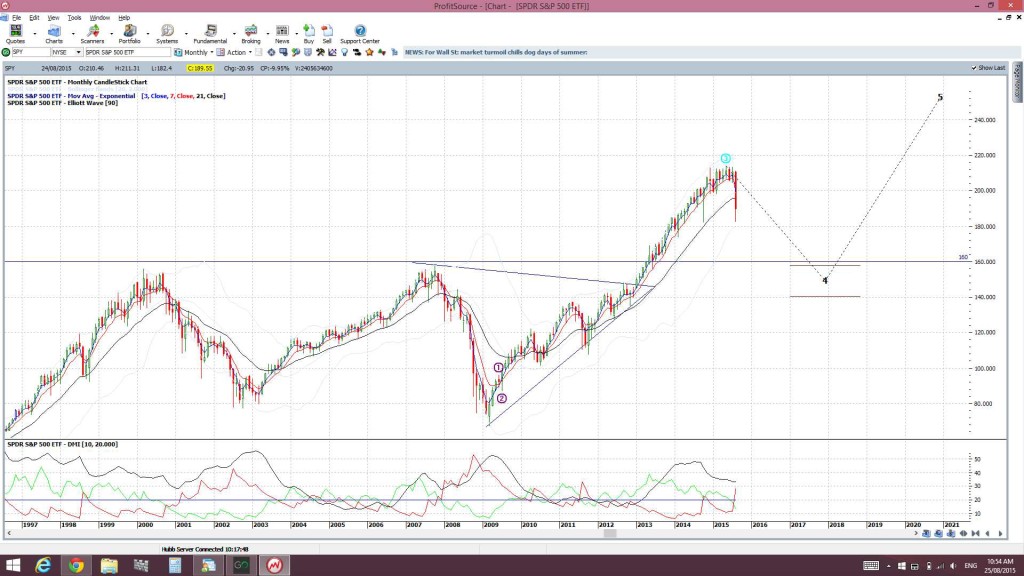
SPY monthly: S&P500 ETF: I believe a test of $160 needs to occur here to allow for any sustainable bullish continuation:
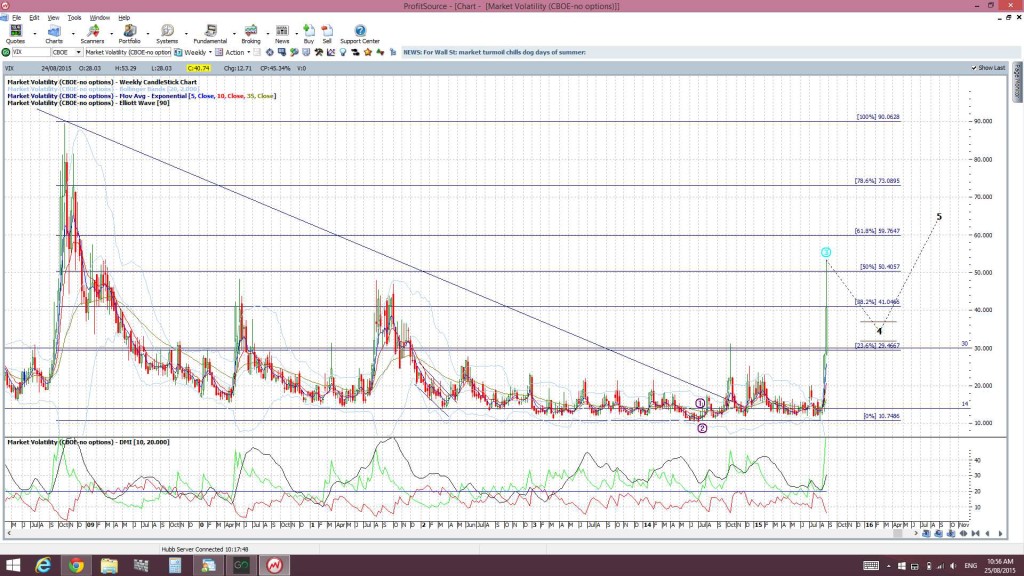
VIX weekly: we need to see whether the 61.8% Fib level will hold price action here:
Summary: Global stock indices are pulling back in this recent trading rout. Key resistance levels on US stock indices have now turned into support and these support level need to be tested, and then to hold, to allow for any possible sustainable bullish continuation. Obviously, failure of these major resistance turned support levels will spell a very different future for these stock indices.


