US Stocks have been experiencing some wild moves of late so I thought I’d take a look at the charts to put these moves into greater perspective. Whilst the point moves on the indices sound rather large and extreme the charts paint a slightly different picture.
The DJIA, S&P500 and NASDAQ have held above two-year support trend lines and, in fact, only the NASDAQ and Russell 2000 have broken recent support trend line at this stage. The monthly charts on each index show monthly support trend lines as intact and it is worth keeping in mind, in the larger scheme of these charts, that a pullback to the monthly 61.8% fib levels here would not be out of order here as part of overall continuation higher moves.
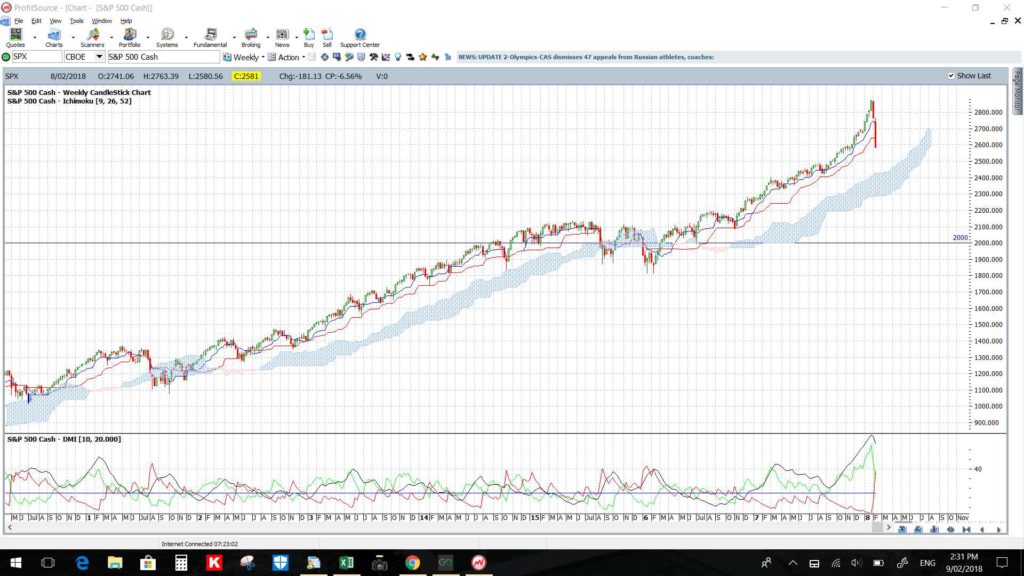
S&P500: The two year and long-term support trend lines and the weekly Cloud are still intact for now:
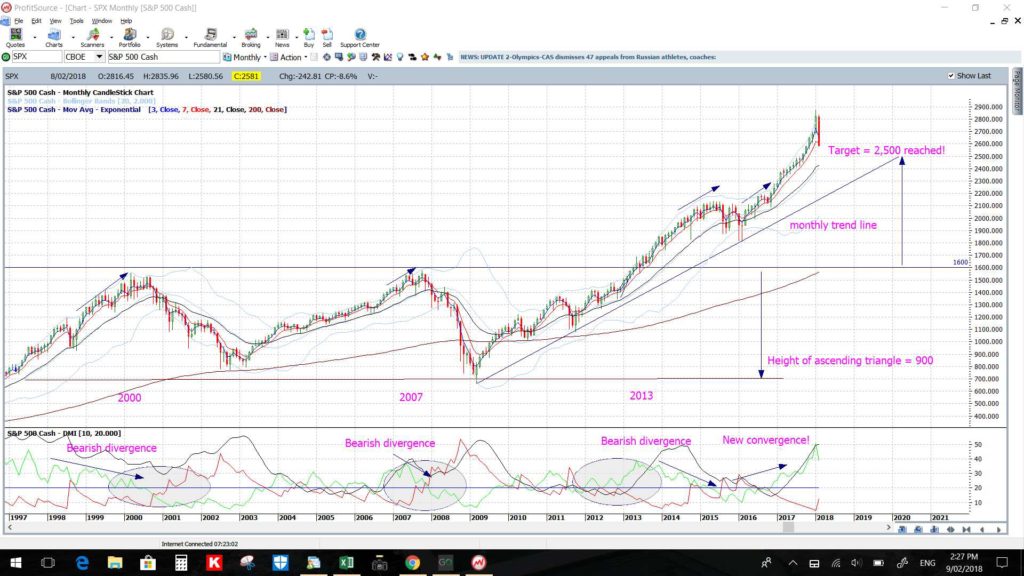
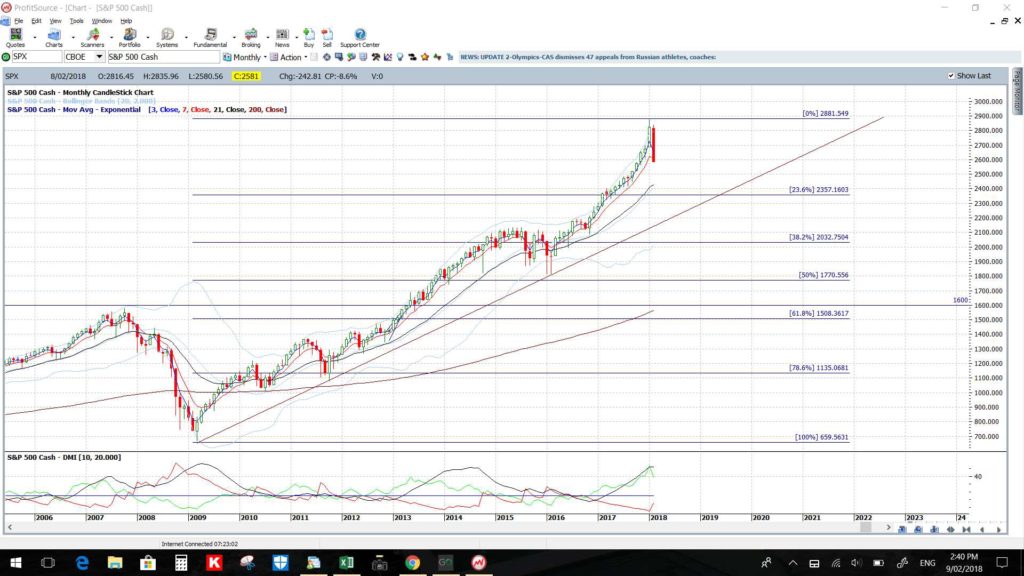
S&P500 monthly: Price is still well above the monthly support trend line and a pullback to this level would bring the index down to near 2,300. The 61.8% fib of the 2009 swing high move is down near the previous ascending triangle breakout level of 1,600.
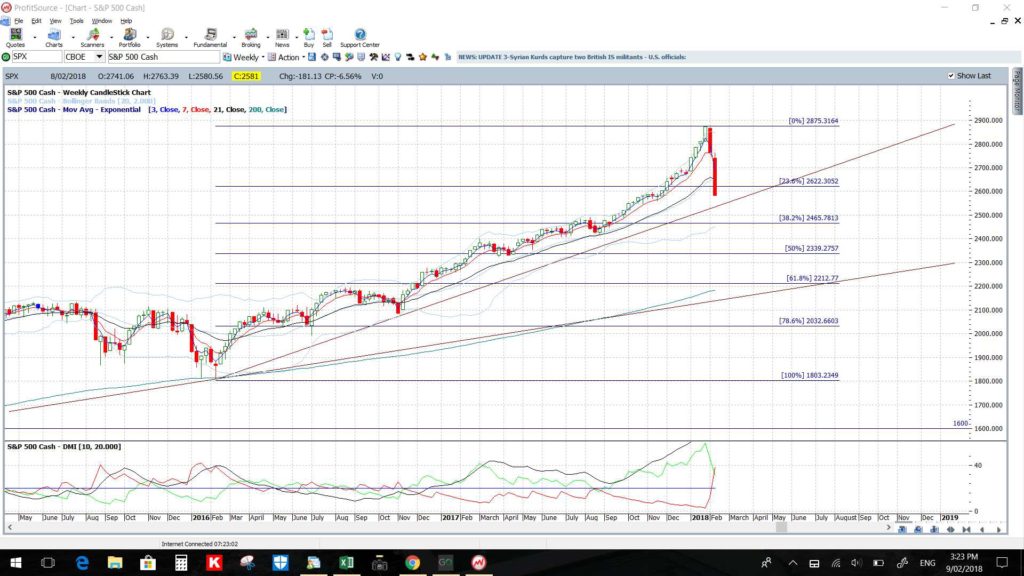
S&P500 weekly: Price is still above the two-year support trend line and the weekly Cloud with the bottom of this Cloud being down near 2,300. The 61.8% fib of the two-year swing high move is down near 2,200 and the monthly support trend line.
S&P500 daily: a 12-month support trend line has just been broken but a two-year trend line is still intact. The 61.8% fib of the two year swing high move is back down near 2,200.
S&P500 Summary: watch the two-year support trend line for any new make or break move. If price breaks to the downside then watch the weekly Ichimoku Cloud and weekly 61.8% fib level near 2,200.
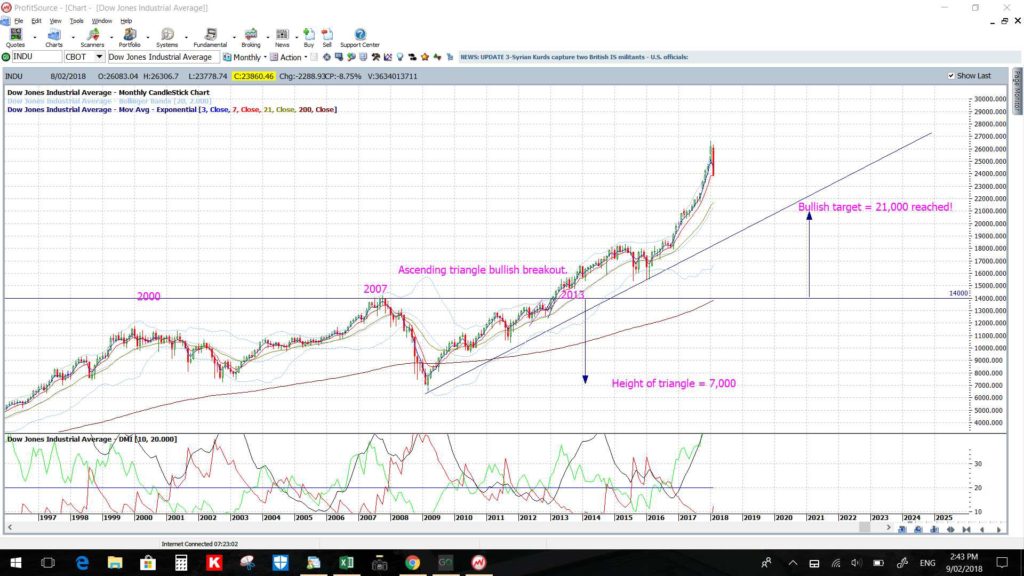
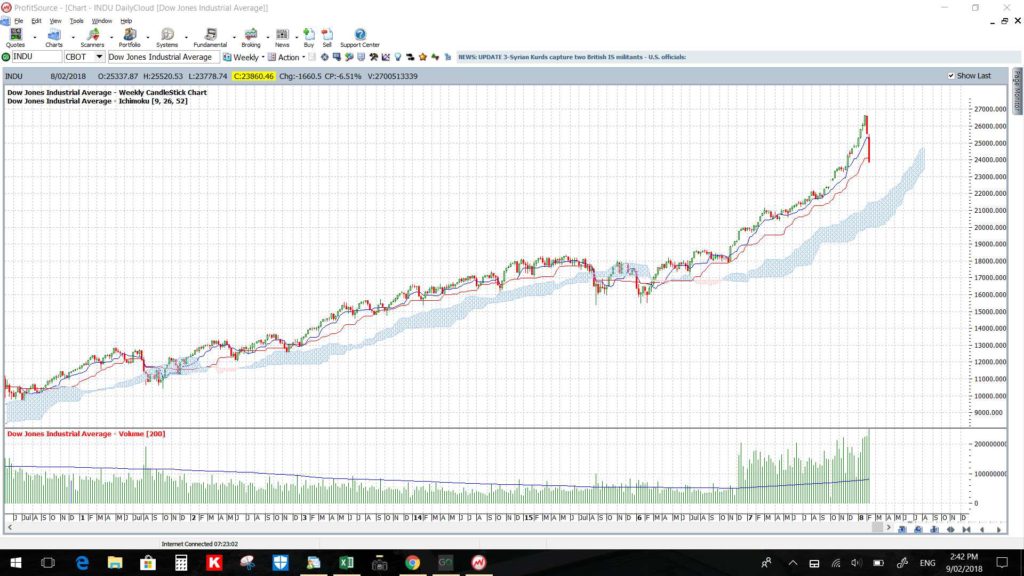
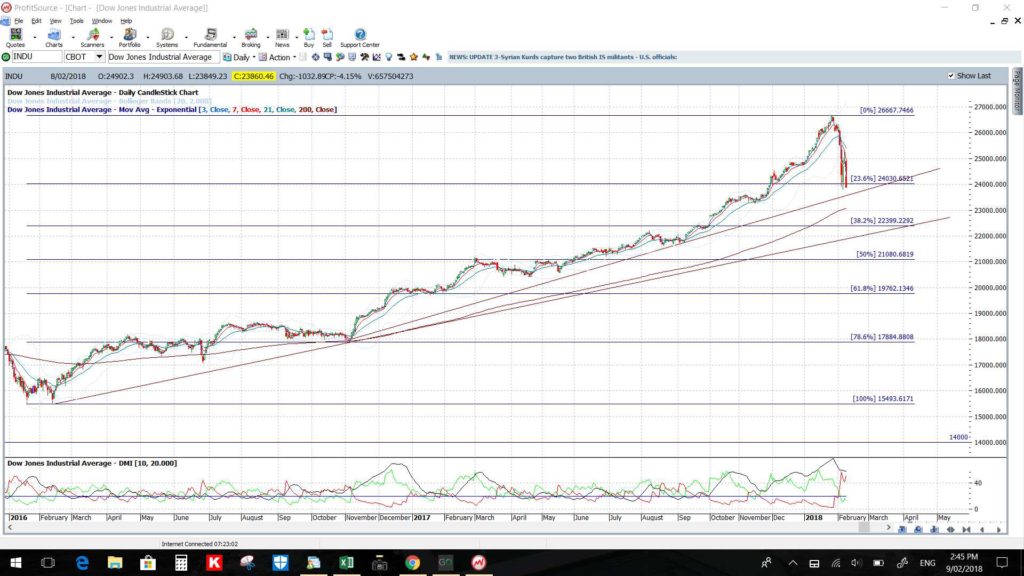
DJIA: The 12-month, two-year and long-term support trend lines are intact here for now as is the weekly Cloud.
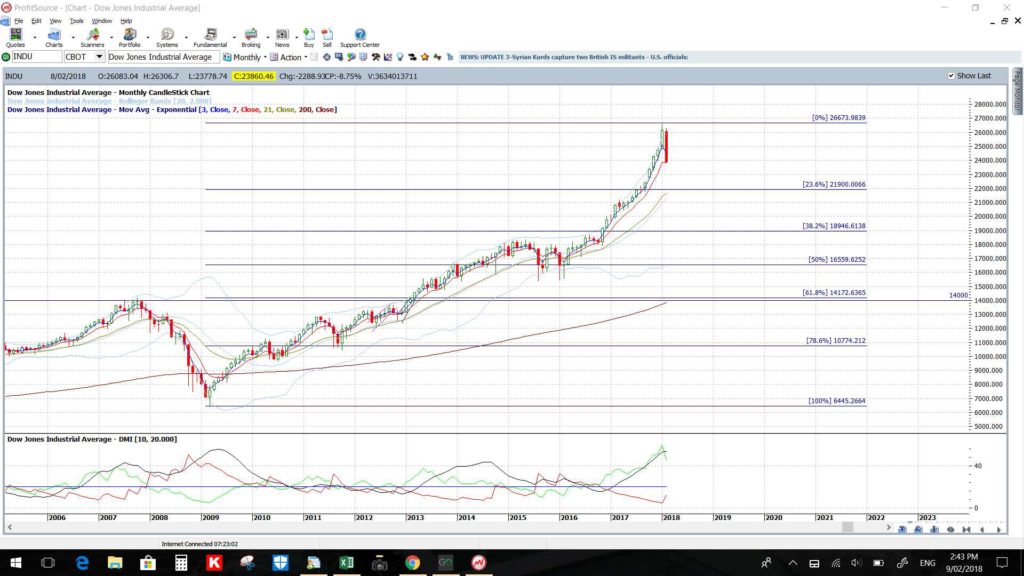
DJIA monthly: The 61.8% fib of the 2009 swing high move is down near the previous ascending triangle breakout level of 14,000.
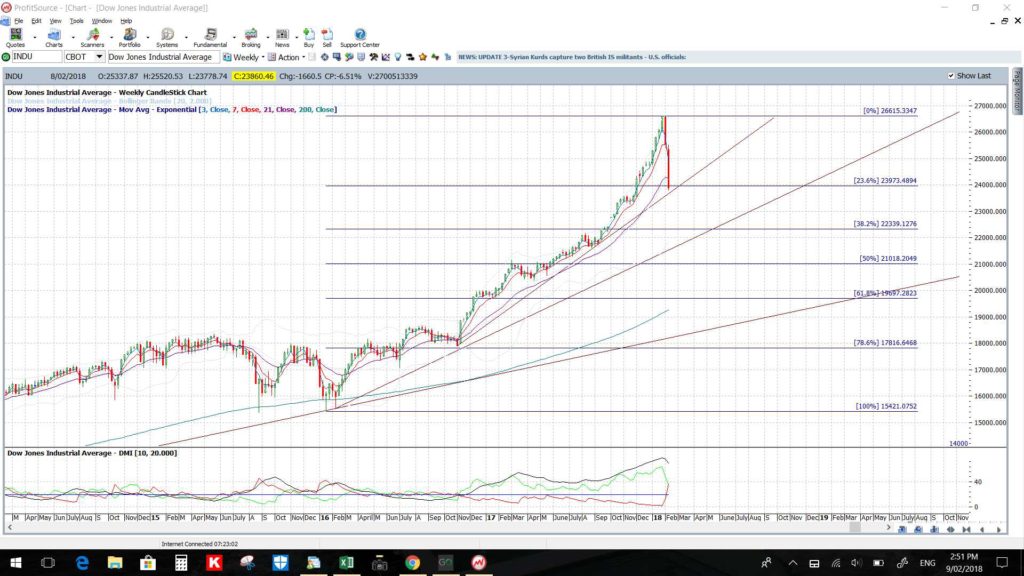
DJIA weekly: Neither of the 12-month support trend line or two-year trend lines has been broken. The 61.8% fib of the two-year swing high move is back down near 20,000. Note how the 50% fib near 21,000 is a bit or previous S/R though as well.
DJIA daily: The 12-month support trend line and two-year trend lines are still intact for now:
DJIA Summary: watch the 12-month support trend line for any new make or break move. If price breaks to the downside then watch the two-year support trend line followed by the weekly Ichimoku Cloud and weekly 50% fib near 21,000 and then the 61.8% fib level near 20,000.
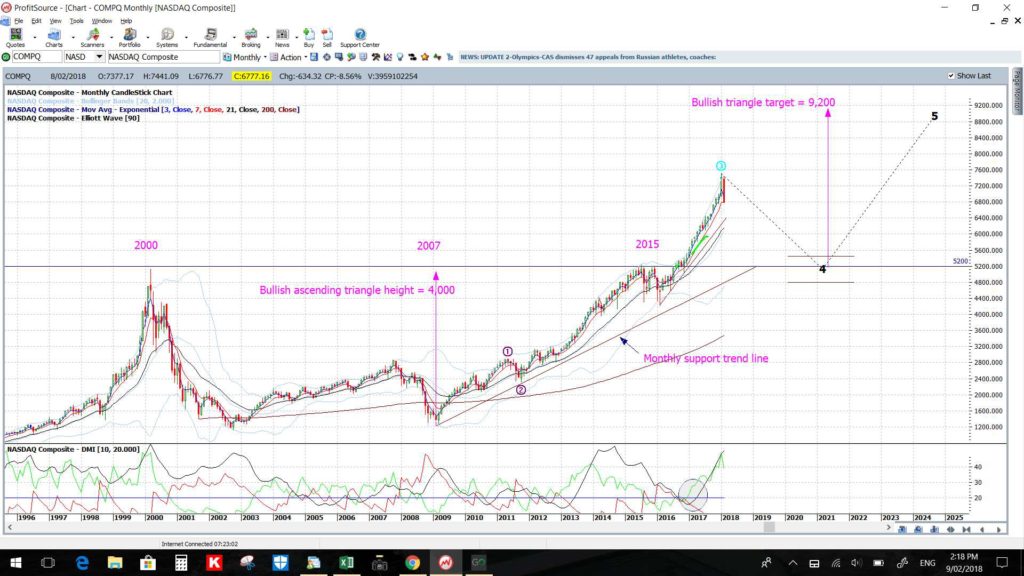
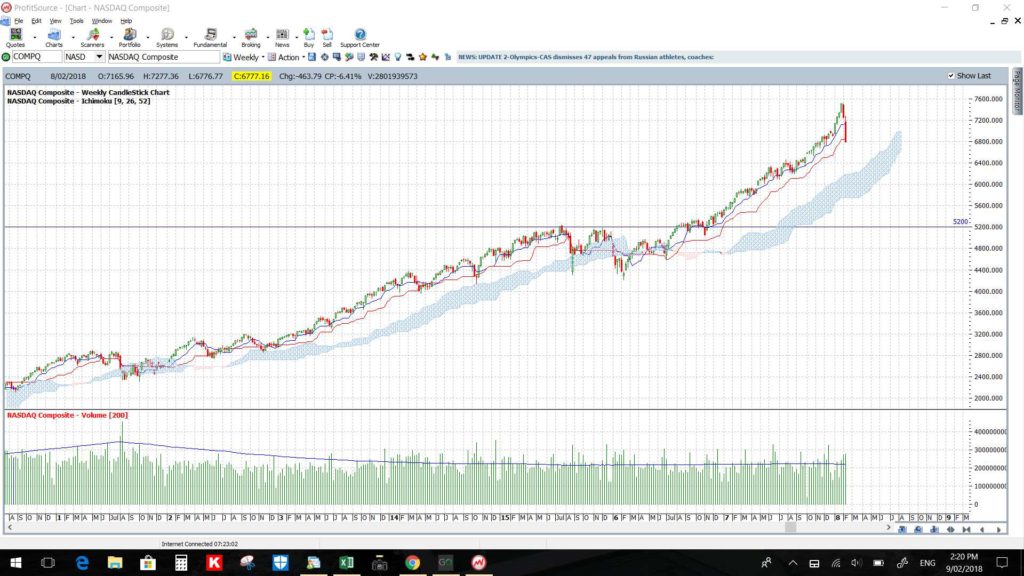
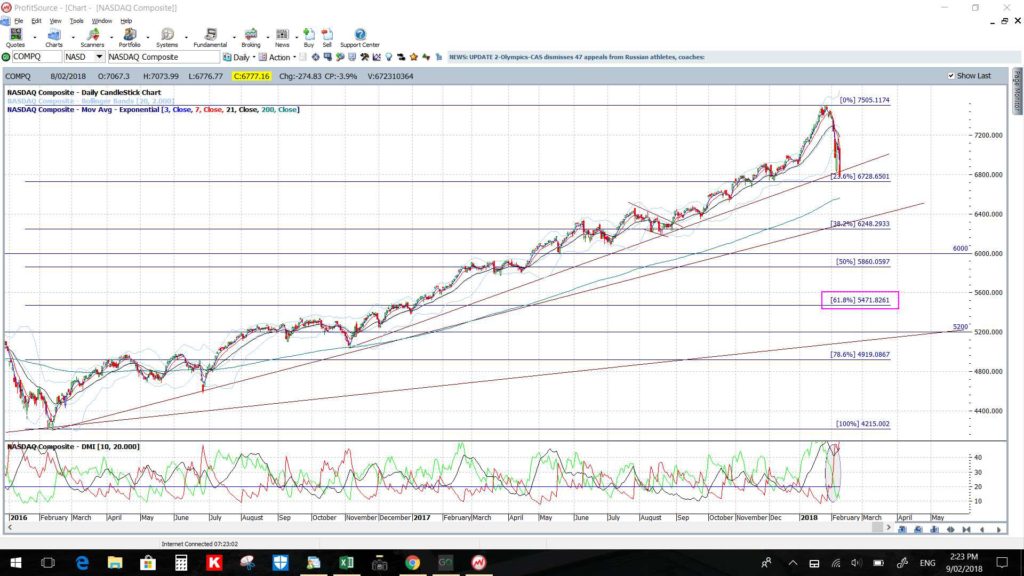
NASDAQ: The 12-month trend line has just been broken but the two-year and long-term support trend lines are intact for now as is the weekly Cloud.
NASDAQ monthly: This ascending triangle breakout might experience a bit of a pullback. I note the default Elliott Wave on my software has the pullback near my 5,200 earlier breakout level:
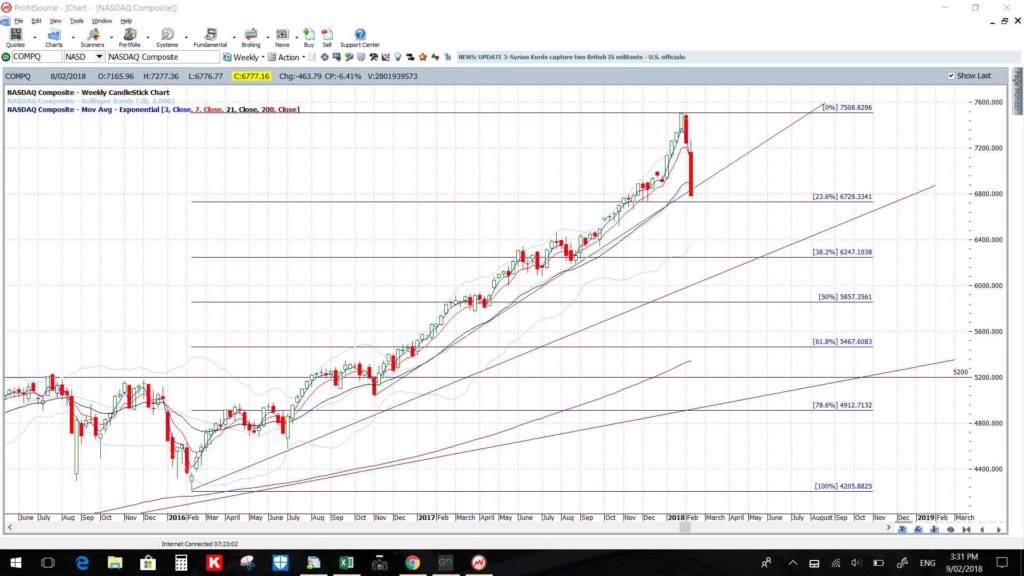
NASDAQ weekly: The 12-month trend line has just been broken but the two-year and long-term support trend lines are intact for now. The 61.8% fib of the two-year swing high move is back down near 5,500. Price is still above the weekly Cloud and the bottom of this Cloud is down near 5,700.
NASDAQ daily: a 12-month support trend line has just been broken but a two-year trend line is still intact. The 61.8% fib of the two year swing high move is back down near 5,500.
NASDAQ Summary: watch the two-year support trend line for any new make or break move. If price breaks to the downside then watch the weekly Ichimoku Cloud and weekly 61.8% fib level near 5,500.
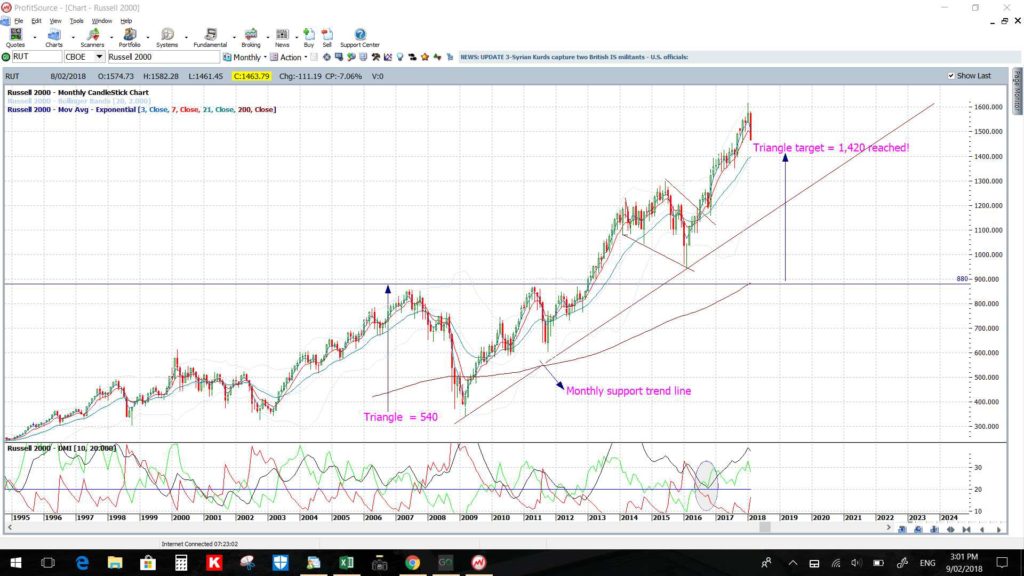
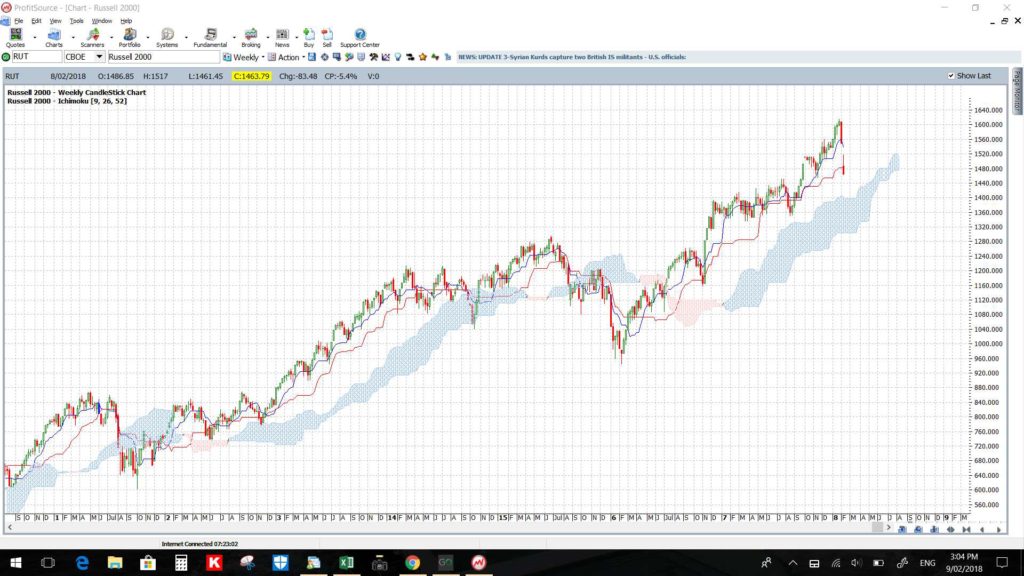
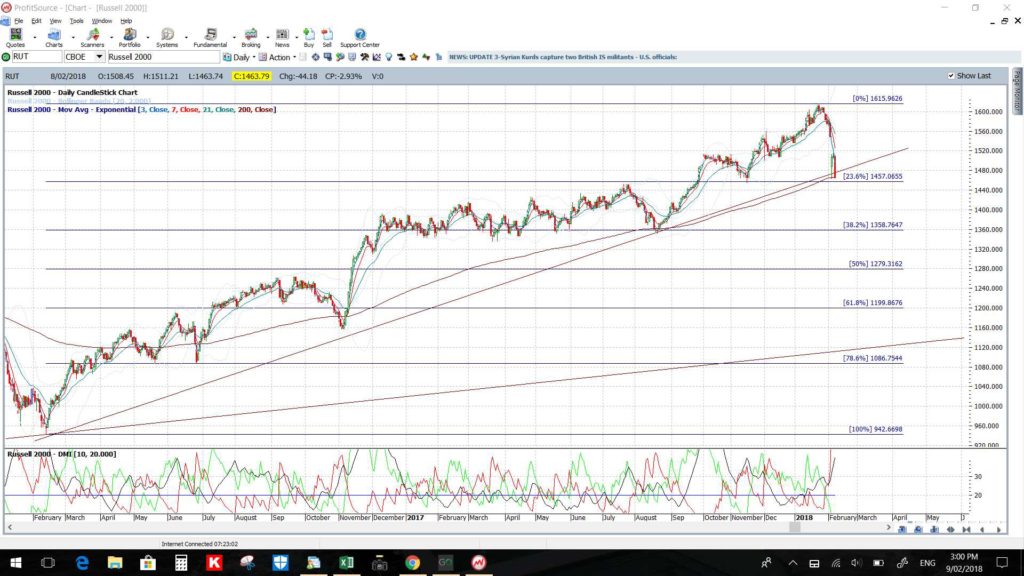
Russell 2000: The two-year support trend lines has just been broken here but the weekly Cloud is still intact.
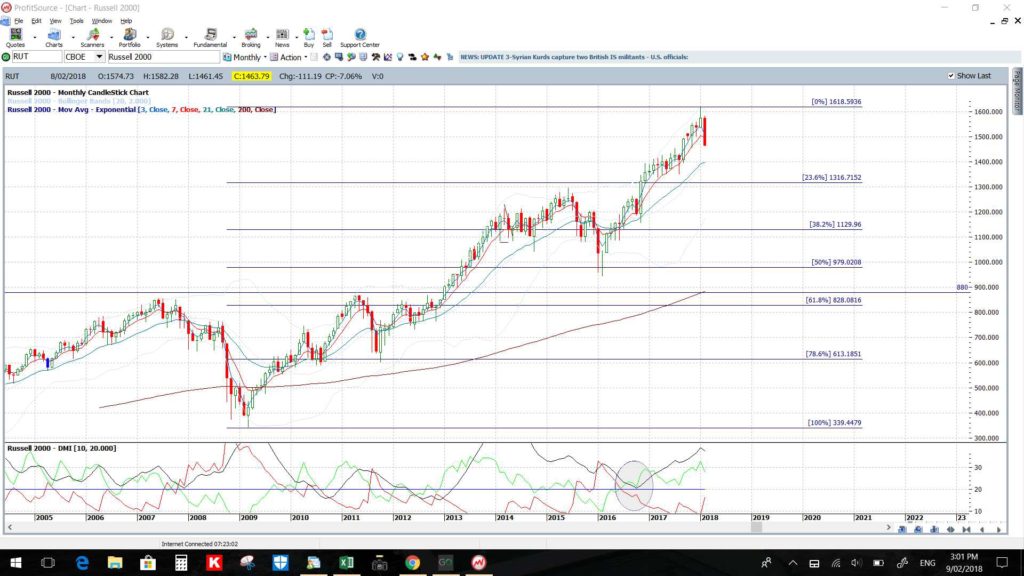
Russell 2000 monthly: The 61.8% fib of the 2009 swing high move is down near the previous ascending triangle breakout level of 880.
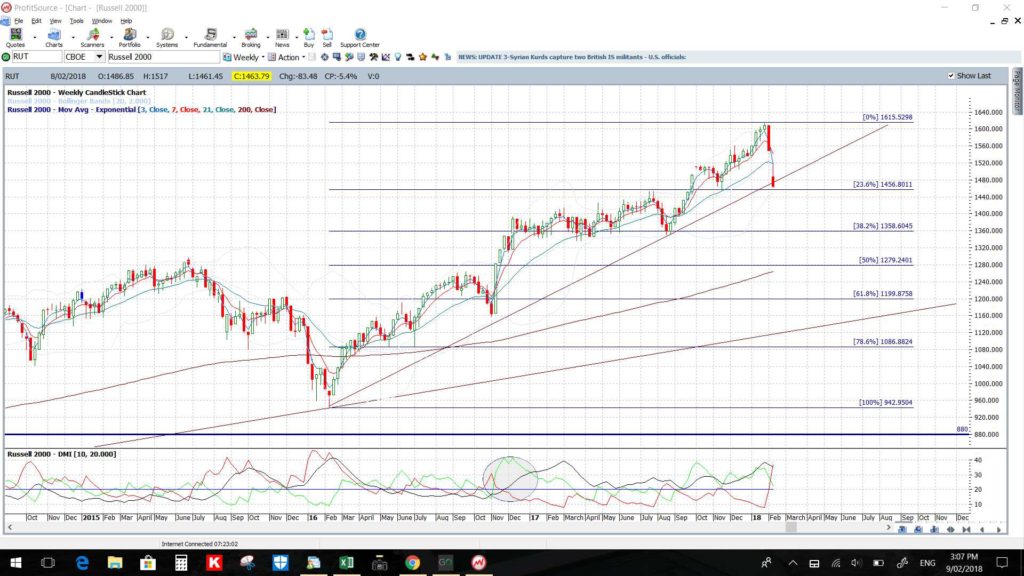
Russell 2000 weekly: the two-year trend line has been broken but price remains above the Cloud. The bottom of this weekly Cloud is down near 1,300.The 61.8% fib of the two year swing high move is back down near 1,200 but note how the 50% fib is near a previous high and S/R level near 1,280:
Russell 2000 daily: a two-year trend line has just been broken. The 61.8% fib of the two year swing high move is back down near 1,200.
Russell 2000 Summary: watch the previous high and weekly 50% fib near 1,280, then the weekly Ichimoku Cloud followed by the weekly 61.8% fib level near 1,200.


