Some traders have been discussing the merits of three popular US stocks over the w/e: AFL (Aflac), MCD (McDonalds) and YUM (Yum Brands Inc).
I have reviewed the charts of these three and my order of preference, based on just the technical merits, is AFL > MCD > YUM :
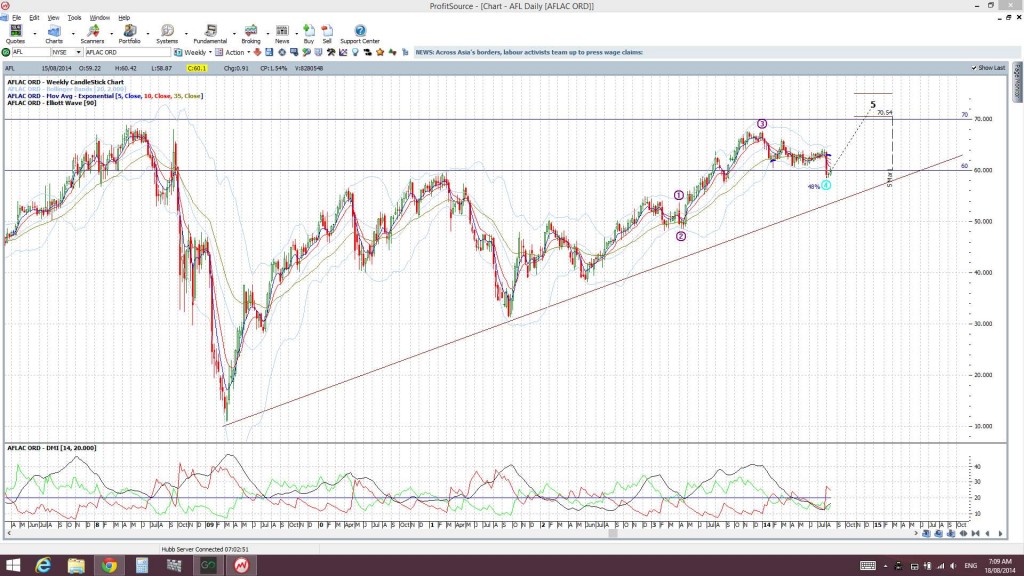
AFL:
- looks to be trading within a bullish ascending triangle on the weekly time frame.
- the $60 is a key S/R level.
- Price tested this support last week but managed to close out the week ABOVE this key $60 level.
- there is a weekly support trend line here as well that has been in play since 2009 and that is about $5 below the $60 S/R level. Thus, another bit of a buffer.
- My Elliott Wave, FWIW…suggests continuation and I would tend to support such a view based on recent price action.
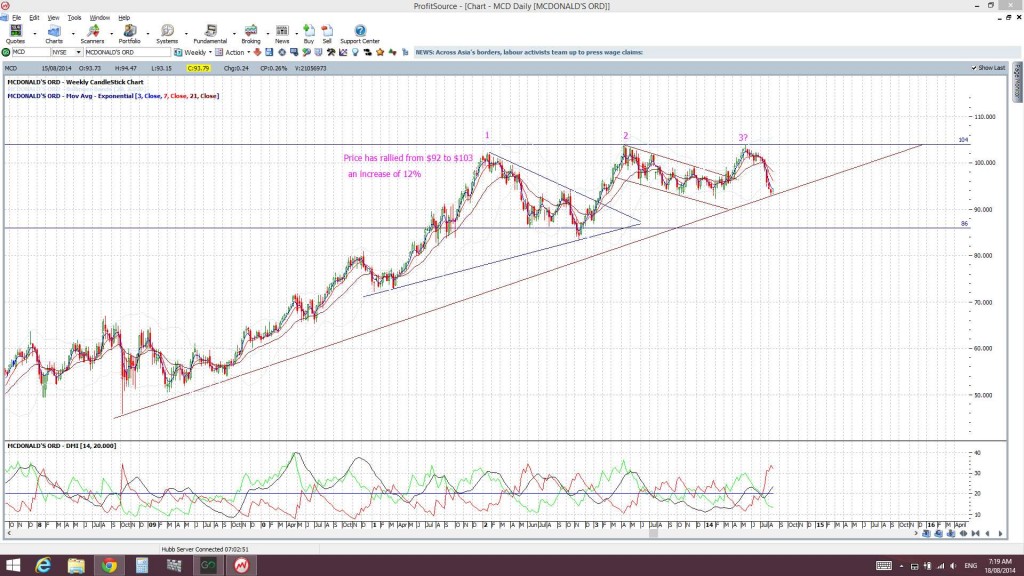
MCD:
- some would be thinking bearish thoughts here as MCD looks to have printed a bearish -reversal ‘Triple Top’
- I’m not so sure!
- I’m also seeing a bullish ascending triangle pattern here albeit with strong resistance at the $104 level.
- The weekly support trend line here has been in play since late 2008 BUT MCD is currently trading right down at this support.
- there is reasonable horizontal support at the $86 level.
- A break of the daily support trend line would suggest a trip to test this $86 level.
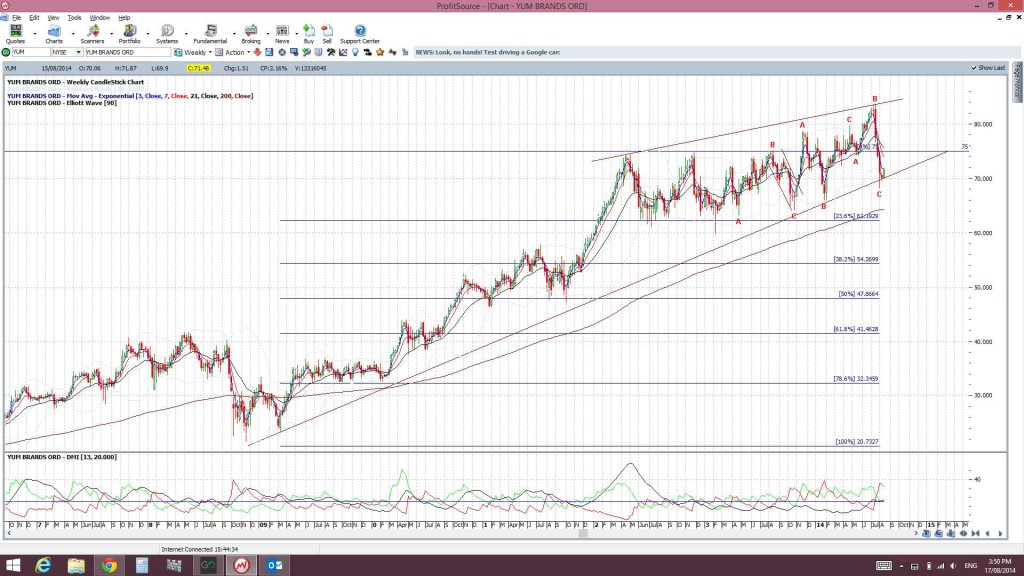
YUM:
- is trading and holding above a weekly support trend line that has been in play since 2009.
-
YUM is trading right on top of the weekly support trend line though.
-
Also, it does have the look of a bearish ascending wedge on the weekly chart (this comes after a failed ascending triangle breakout).
- the recent bounce of weekly support could be of the ‘dead cat’ style. This week’s action might help to clarify this possibility.
- $75 is/ will be strong resistance.
Also, I noticed this article posted on Twitter and found it be of some interest. It is from Goldman and deals with their view about the possibility of a market crash.


