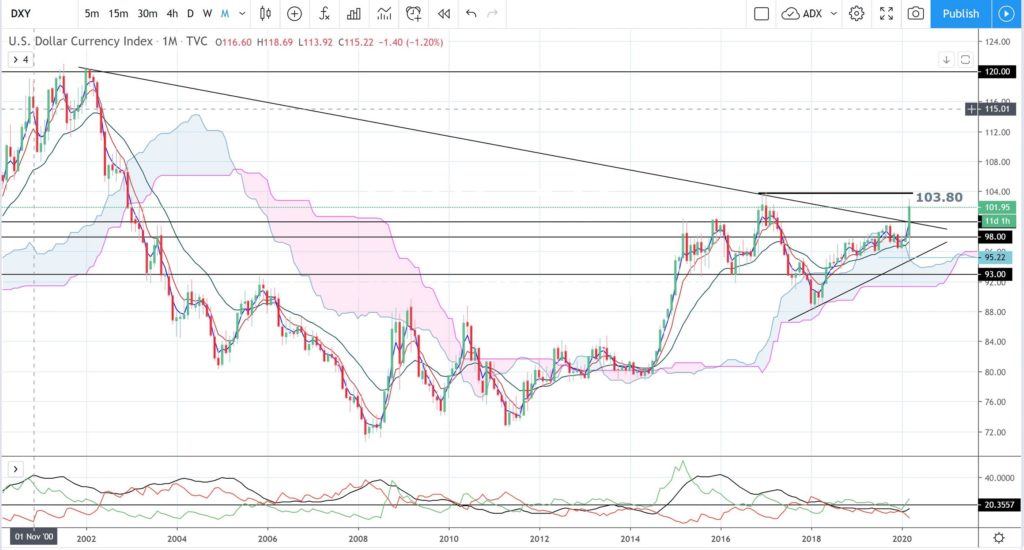
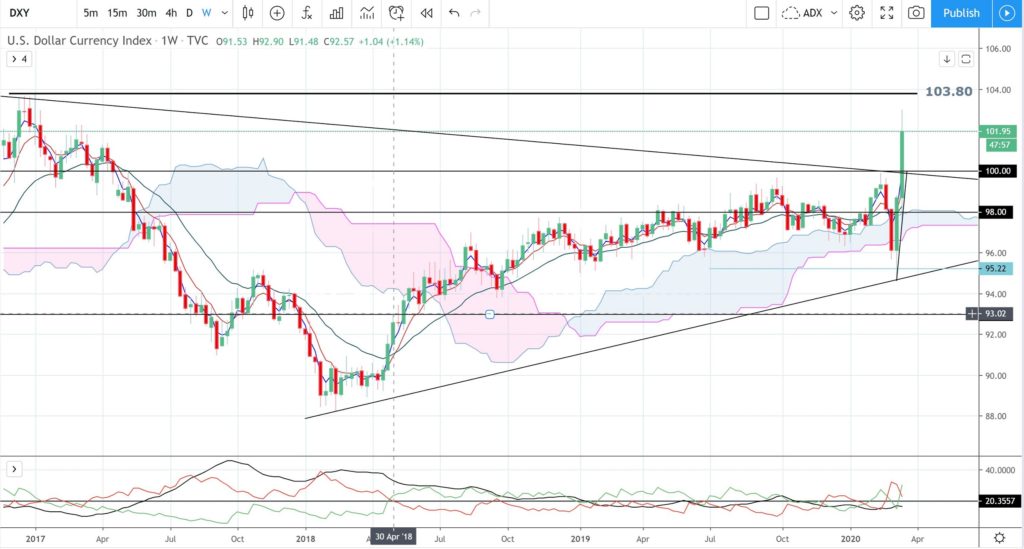
The US$ index has had a great week and printed a large bullish weekly candle but has butted up against major resistance at 103.80. This will be the region to watch for any new make or break activity.
DXY
DXY monthly: note how the current monthly candle is up near 2017 High levels. Any monthly close above 103.80 would bring the previous High, circa 120, back into the longer-term focus:
DXY weekly: price action pulled back from the 103.80 region:
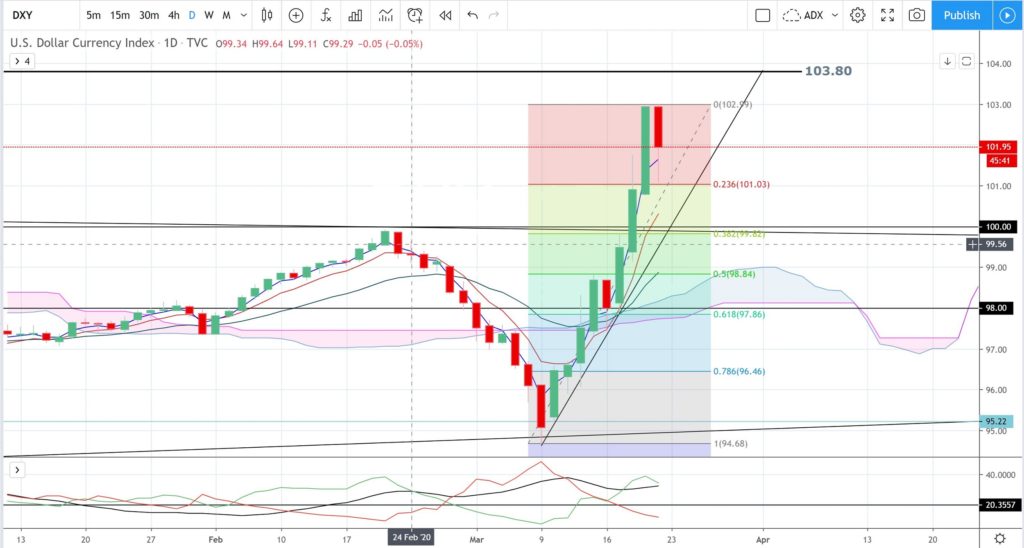
DXY daily: watch for any retracement. Levels to watch include the support TL and, if that breaks and price weakens further, watch the 100 and 98 levels noting the latter is near the daily 61.8% fib:
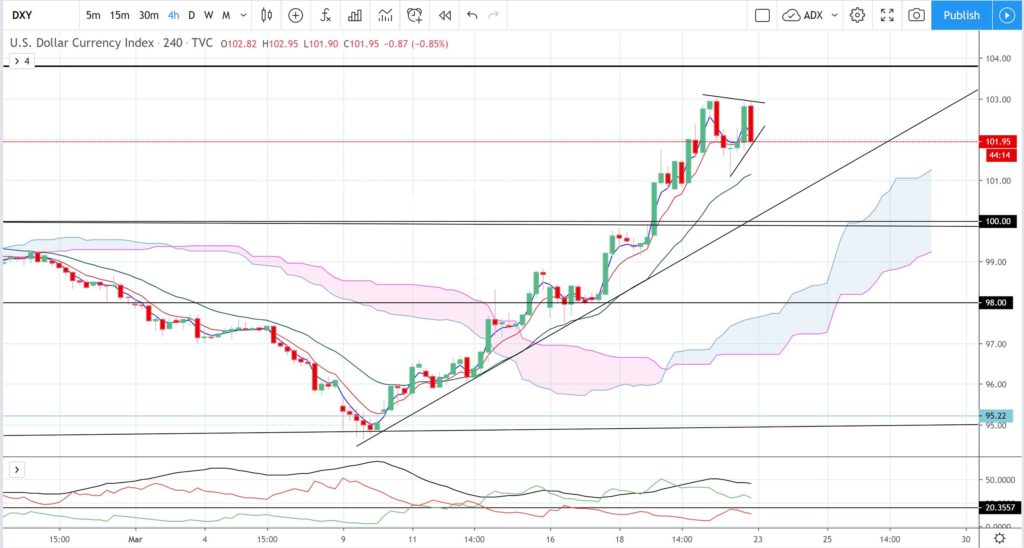
DXY 4hr: watch for any Bull Flag style formation under this 103.80 region:
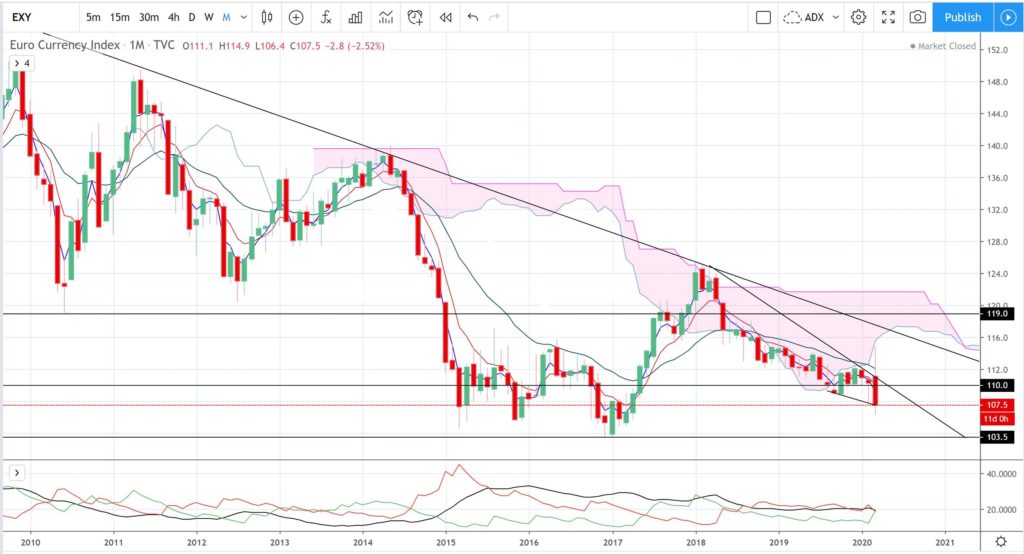
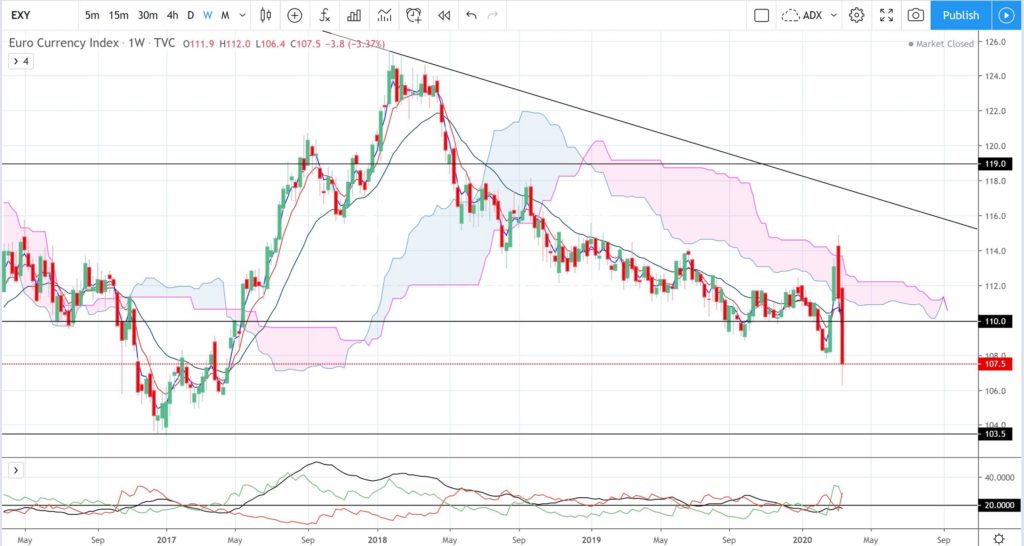
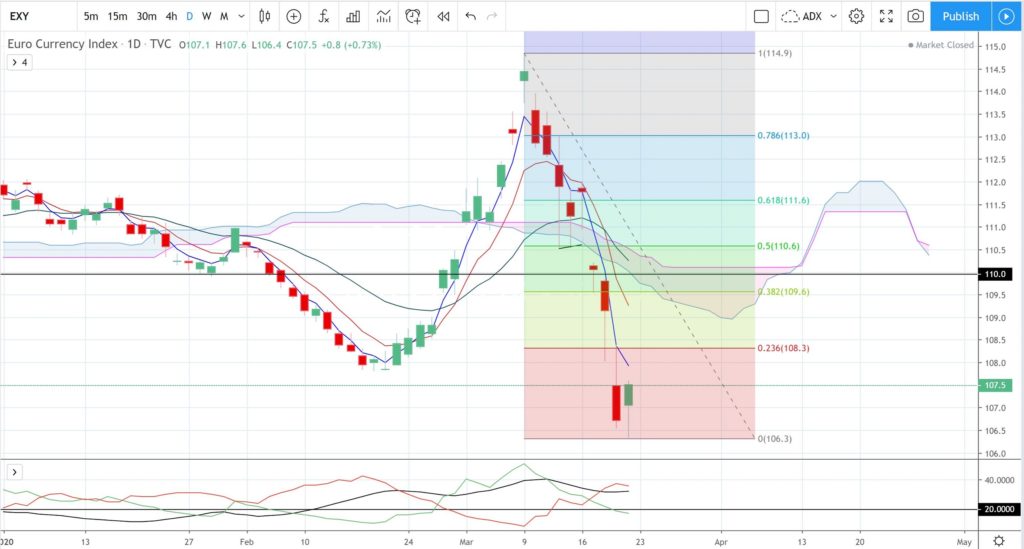
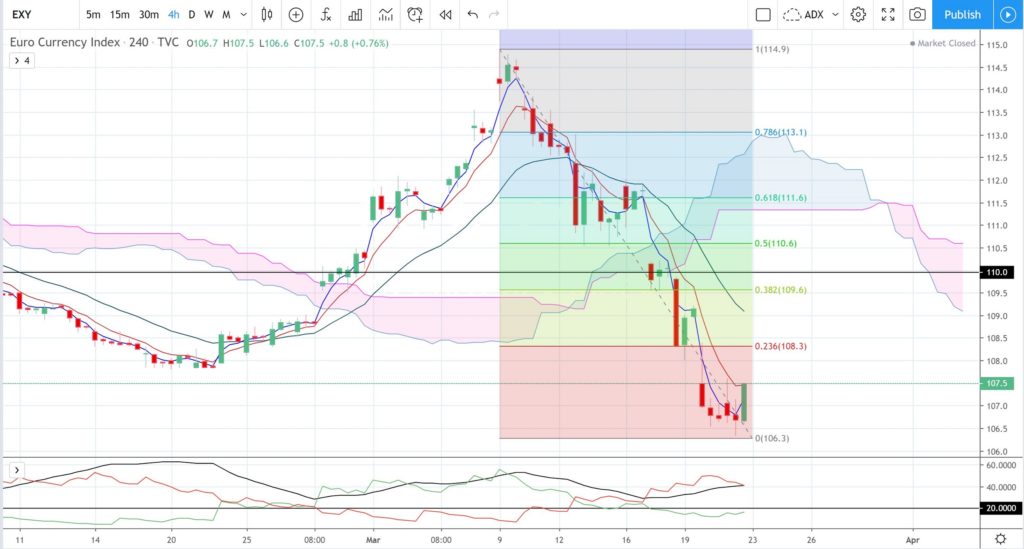
EURX
EURX monthly: the current monthly candle is large and bearish:
EURX weekly: watch for any push to the recent Low, circa 103.50:
EURX daily: any relief rally would bring the 110 S/R level into focus:
EURX 4hr: note how bullish the final 4hr candle was here:
FX Index Alignment: the FX Indices are aligned for risk-off:
- EURX: is below the 4hr Cloud and below the daily Cloud so aligned for SHORT EUR$ price action.
- USDX: is above the 4hr Cloud and above the daily Cloud so aligned for LONG US$ price action.
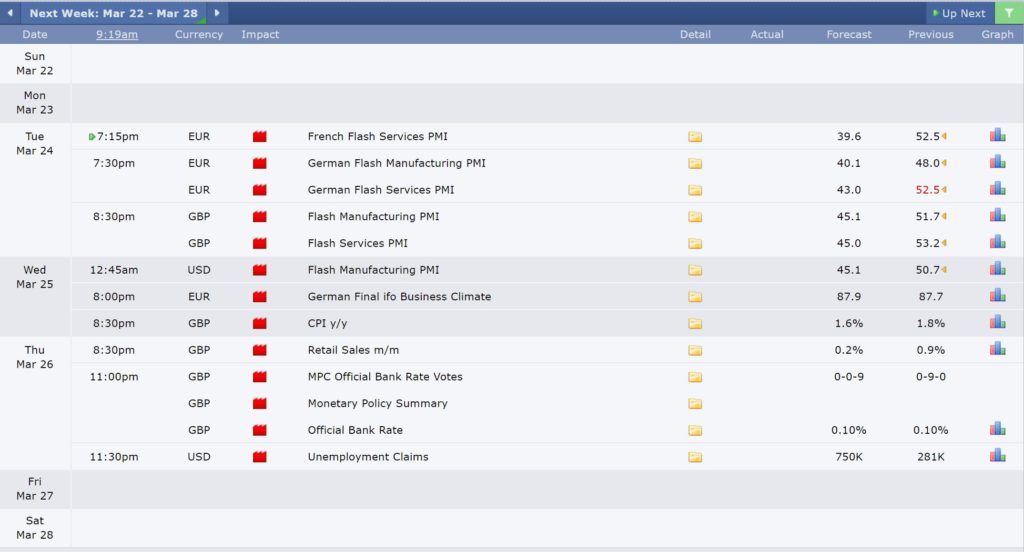
Calendar: Coronavirus remains the dominant market theme:


