


Friday 4th July
The three major US stock indices have made recent bullish breakouts and I am on the lookout for bullish continuation here. I have reviewed some stock indices and ETFs and then posted charts of some key US and Aussie stocks that I keep stalking and trading!
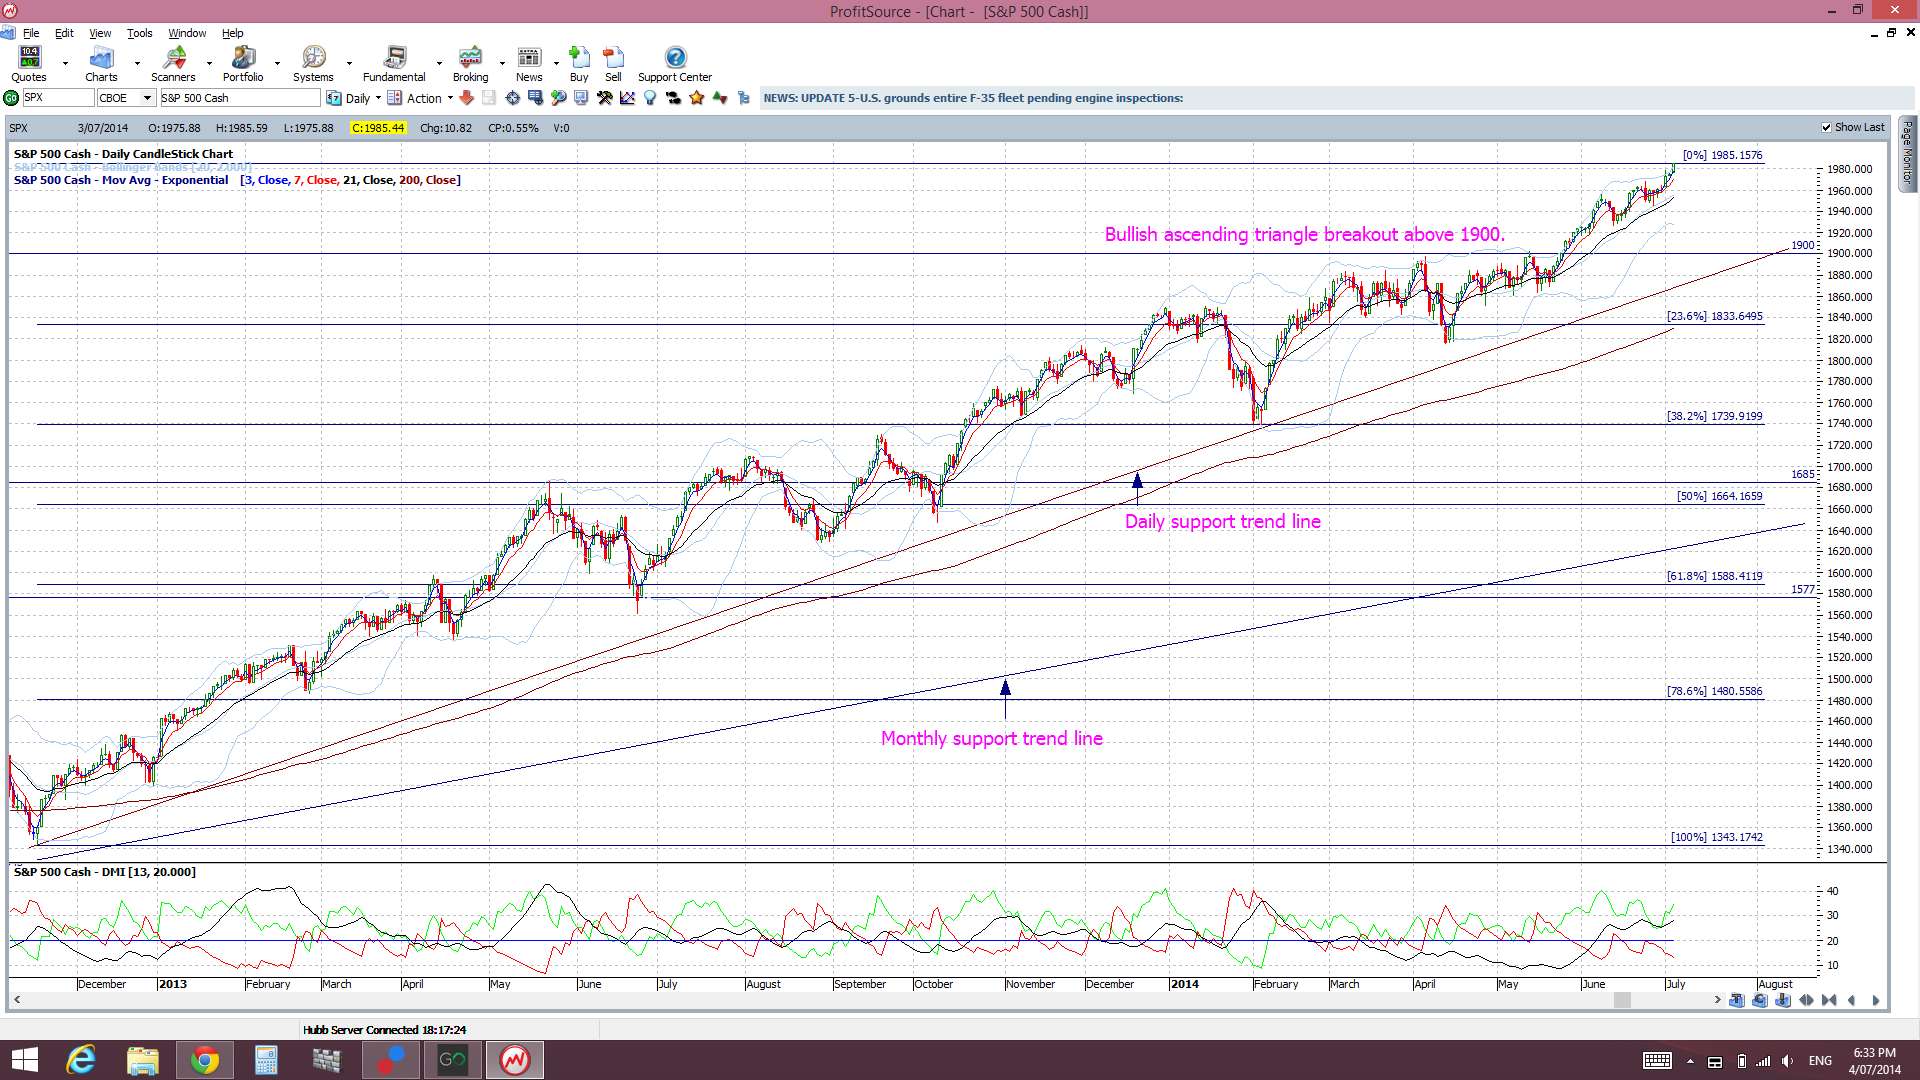
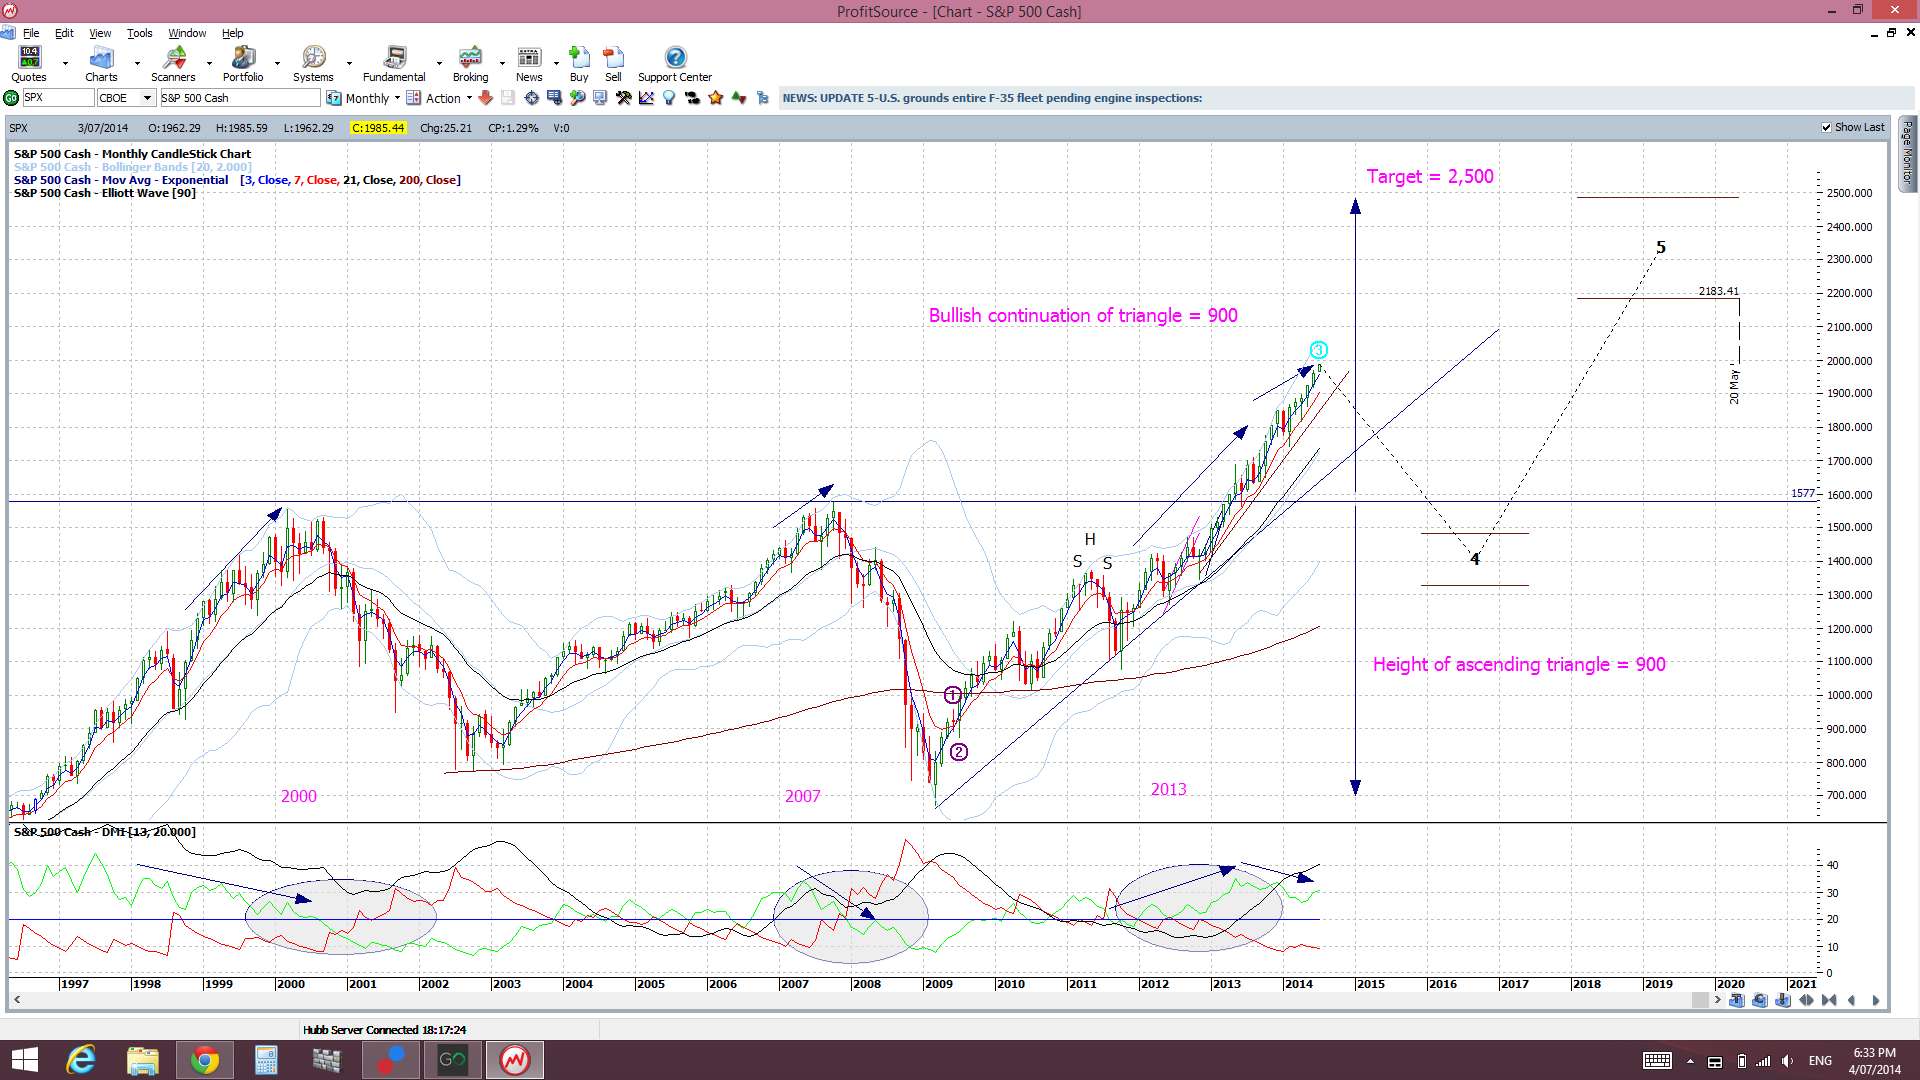
S&P500 index: this has made a bullish ascending triangle breakout on the monthly chart time frame and, more recently, on the daily chart time frame:
S&P500 daily: the recent triangle breakout came with the close and hold above the 1,900 level:
S&P500 monthly: the monthly chart ascending triangle breakout suggests a bullish continuation target of 2,500. This may not be a straight line pathway though and I’m on the lookout for any pullback to the 1,577 level en route:
Dow Jones Industrial Average: As for the S&P500, this has made a bullish ascending triangle breakout on the monthly chart time frame and, more recently, on the daily chart time frame as well:
DJIA daily: the recent triangle breakout came with the close and hold above the 16,700 level:

DJIA monthly: the monthly chart ascending triangle breakout suggests a bullish continuation target of 21,000. This, also, may not be a straight line pathway either and I’m on the lookout for any pullback to the 14,000 level en route:

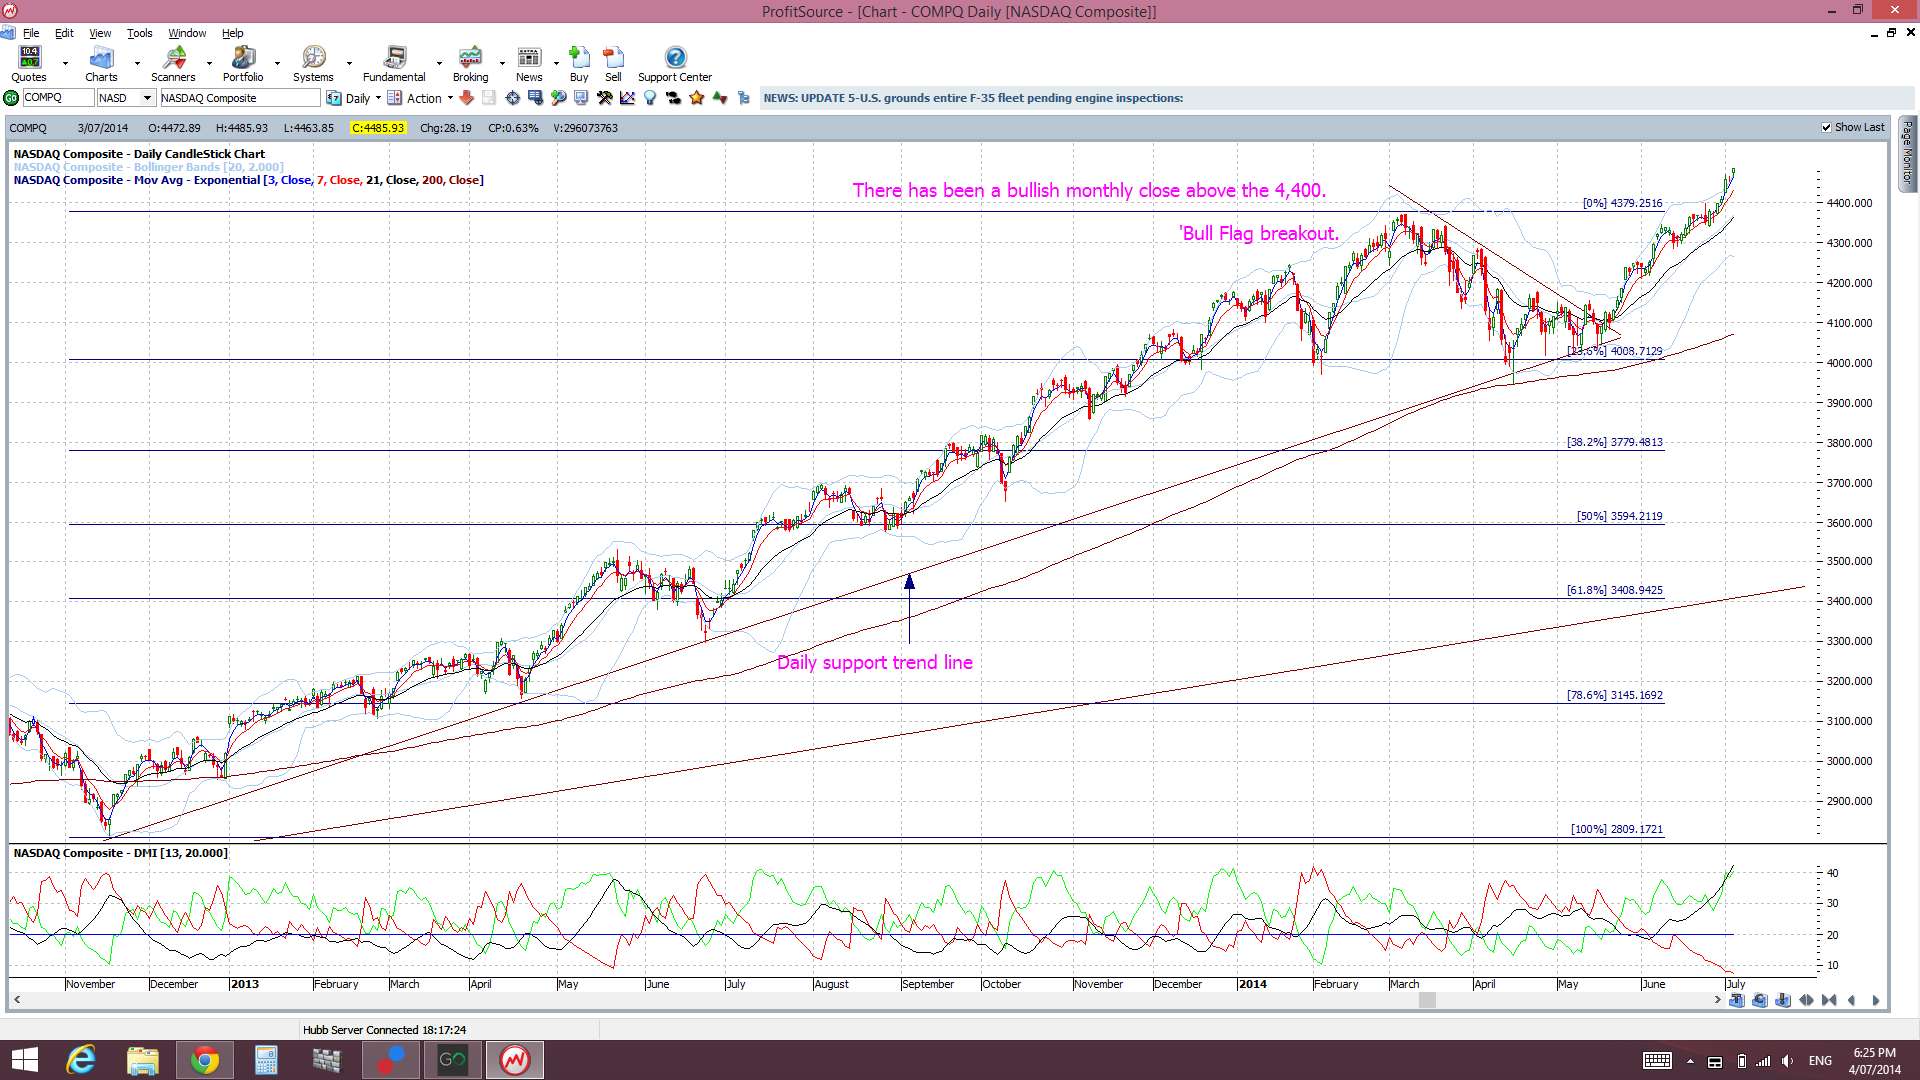
NASDAQ: this has continued on from a ‘Bull Flag’ breakout and how now broken through the possible 4,400 ‘Double Top’ level:
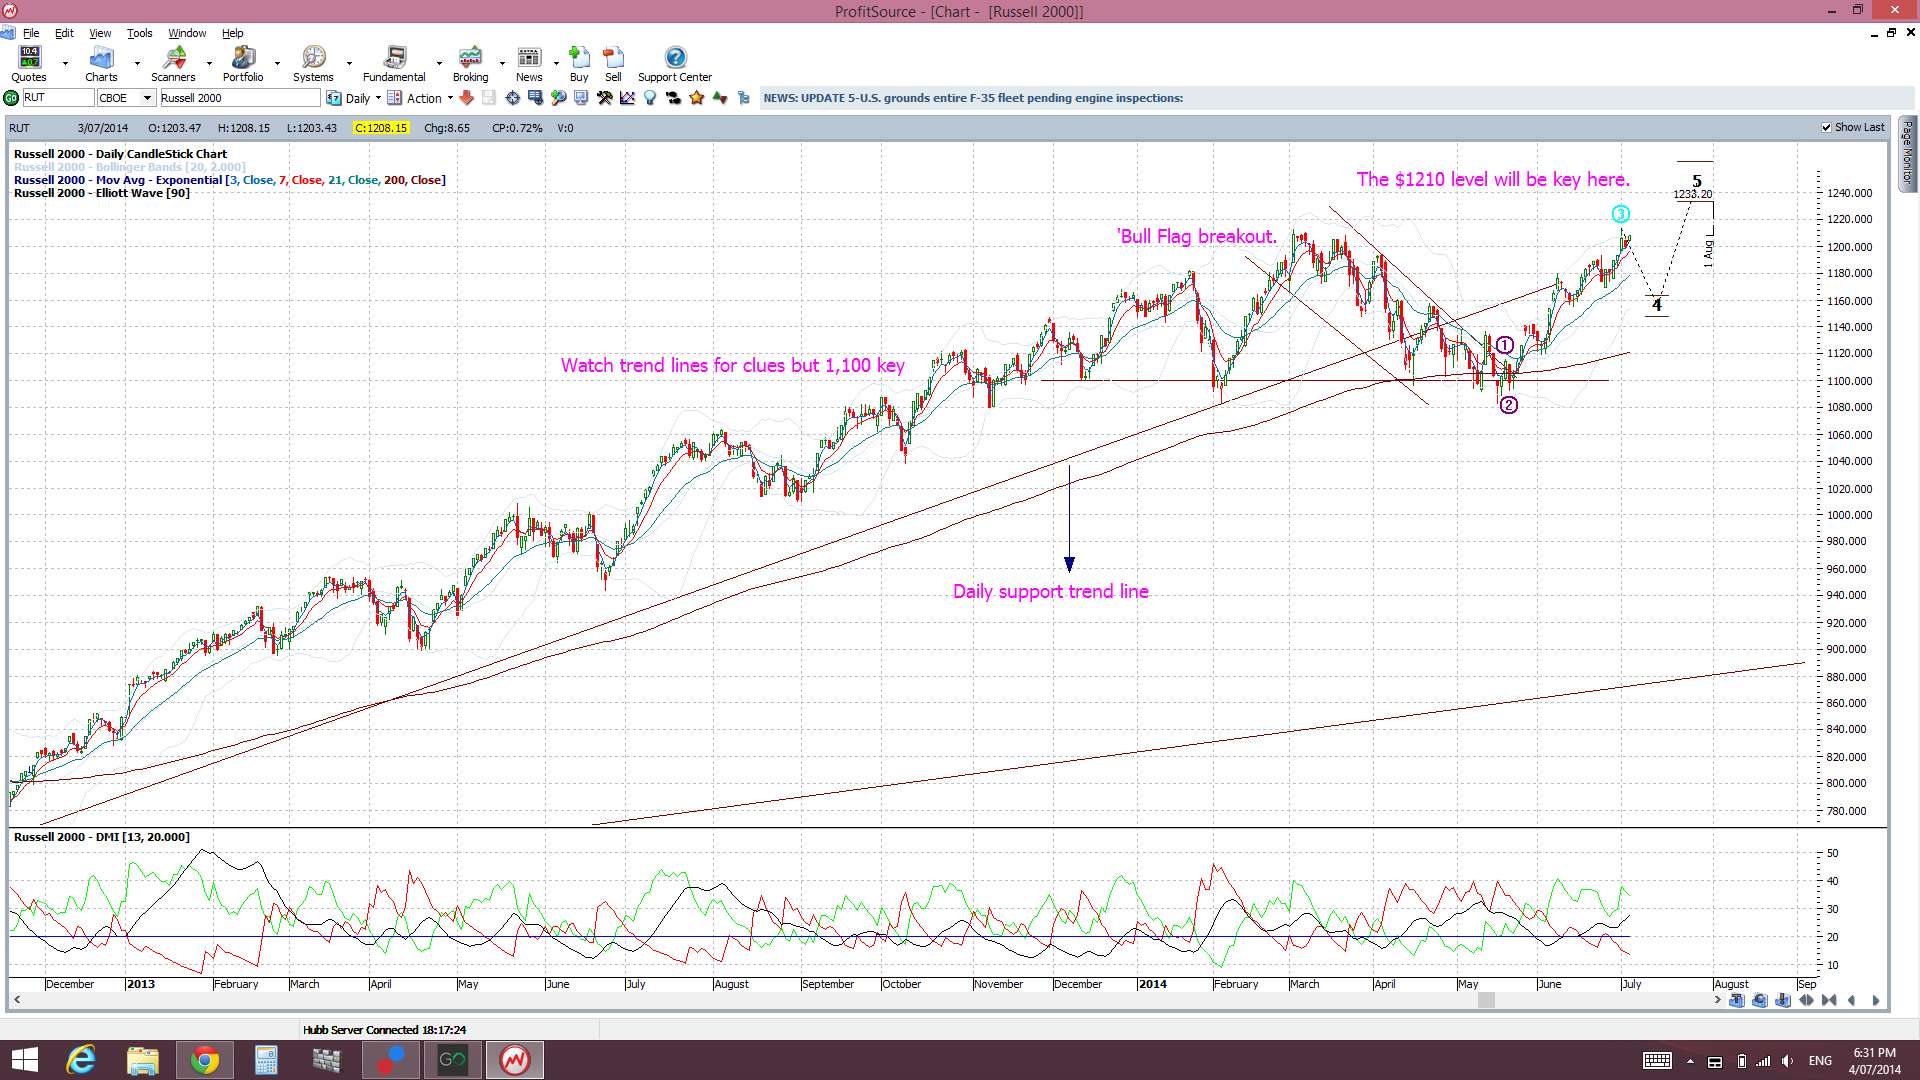
Russell 2000: this US ‘small cap’ index has made a ‘Bull Flag’ breakout but it needs to clear the $1,210 level now:
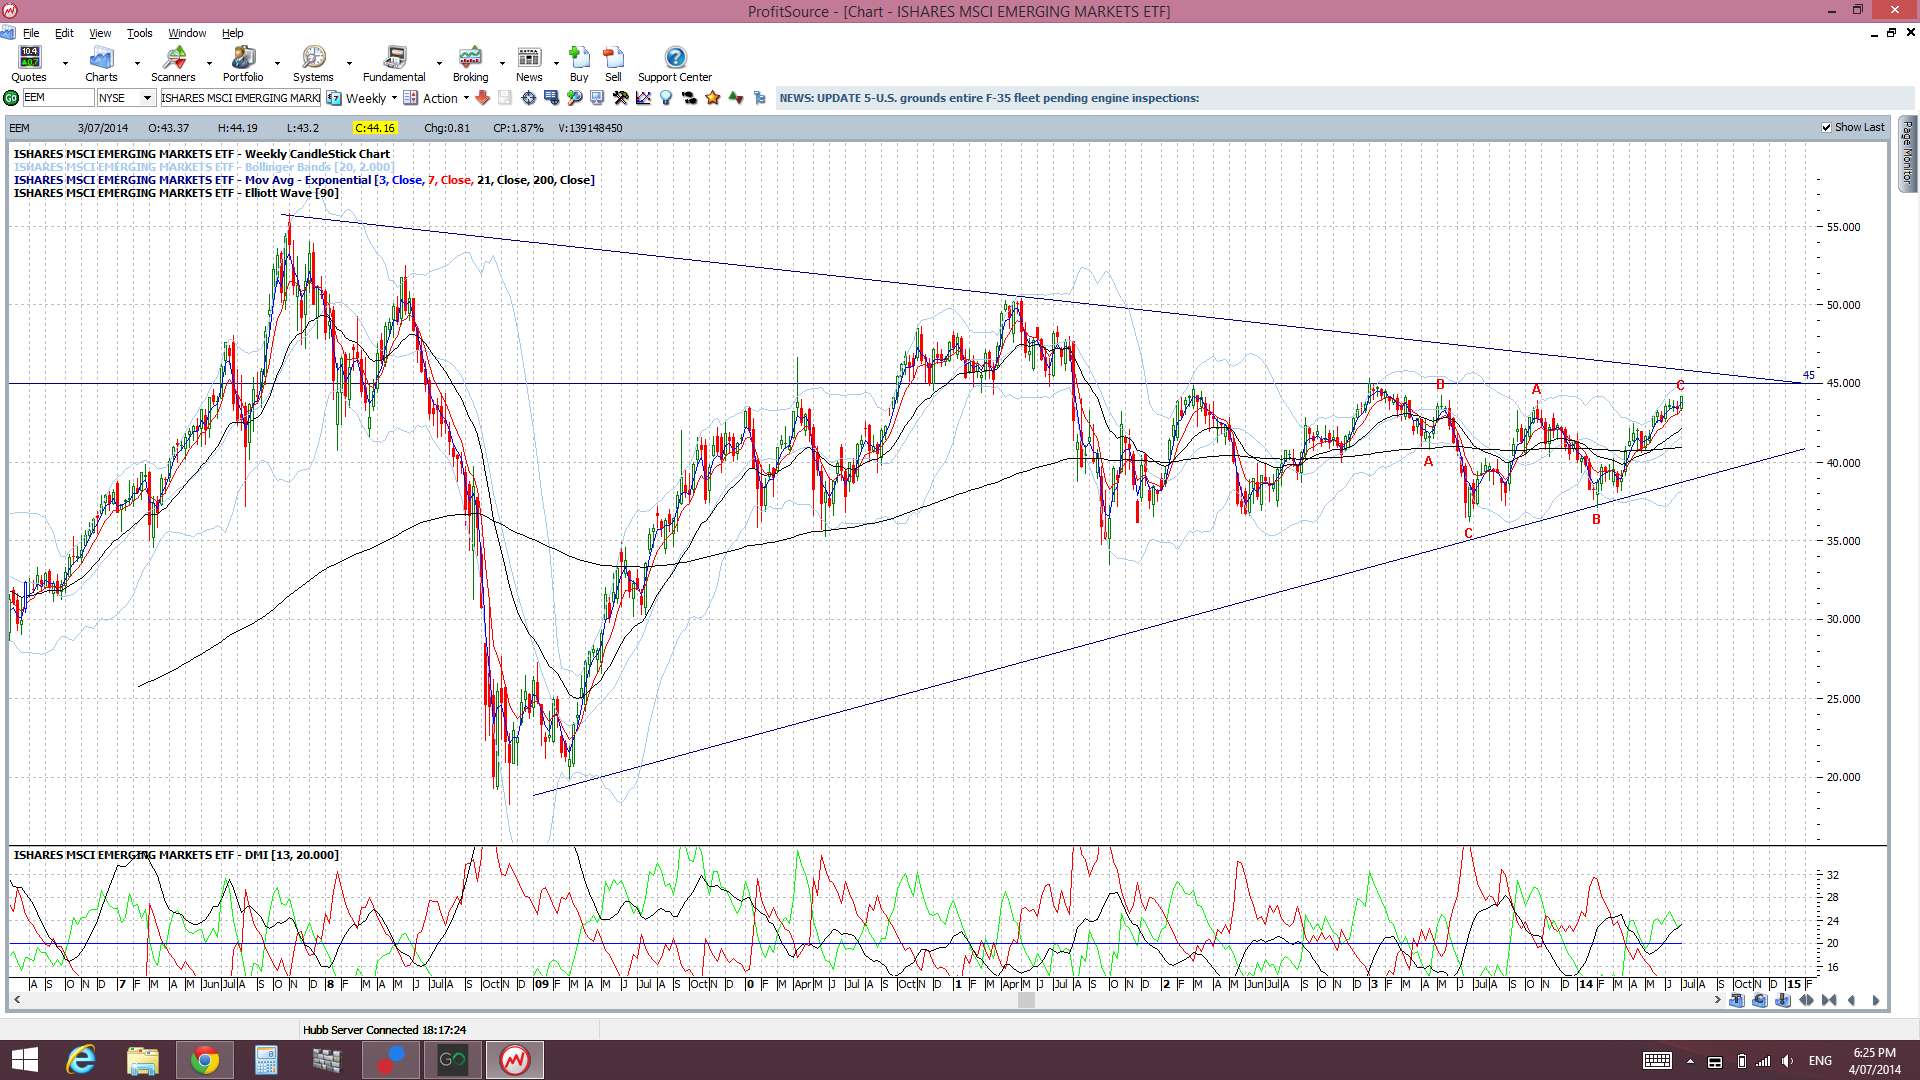
EEM: The emerging markets ETF is looking like it might take on the key $45 level:
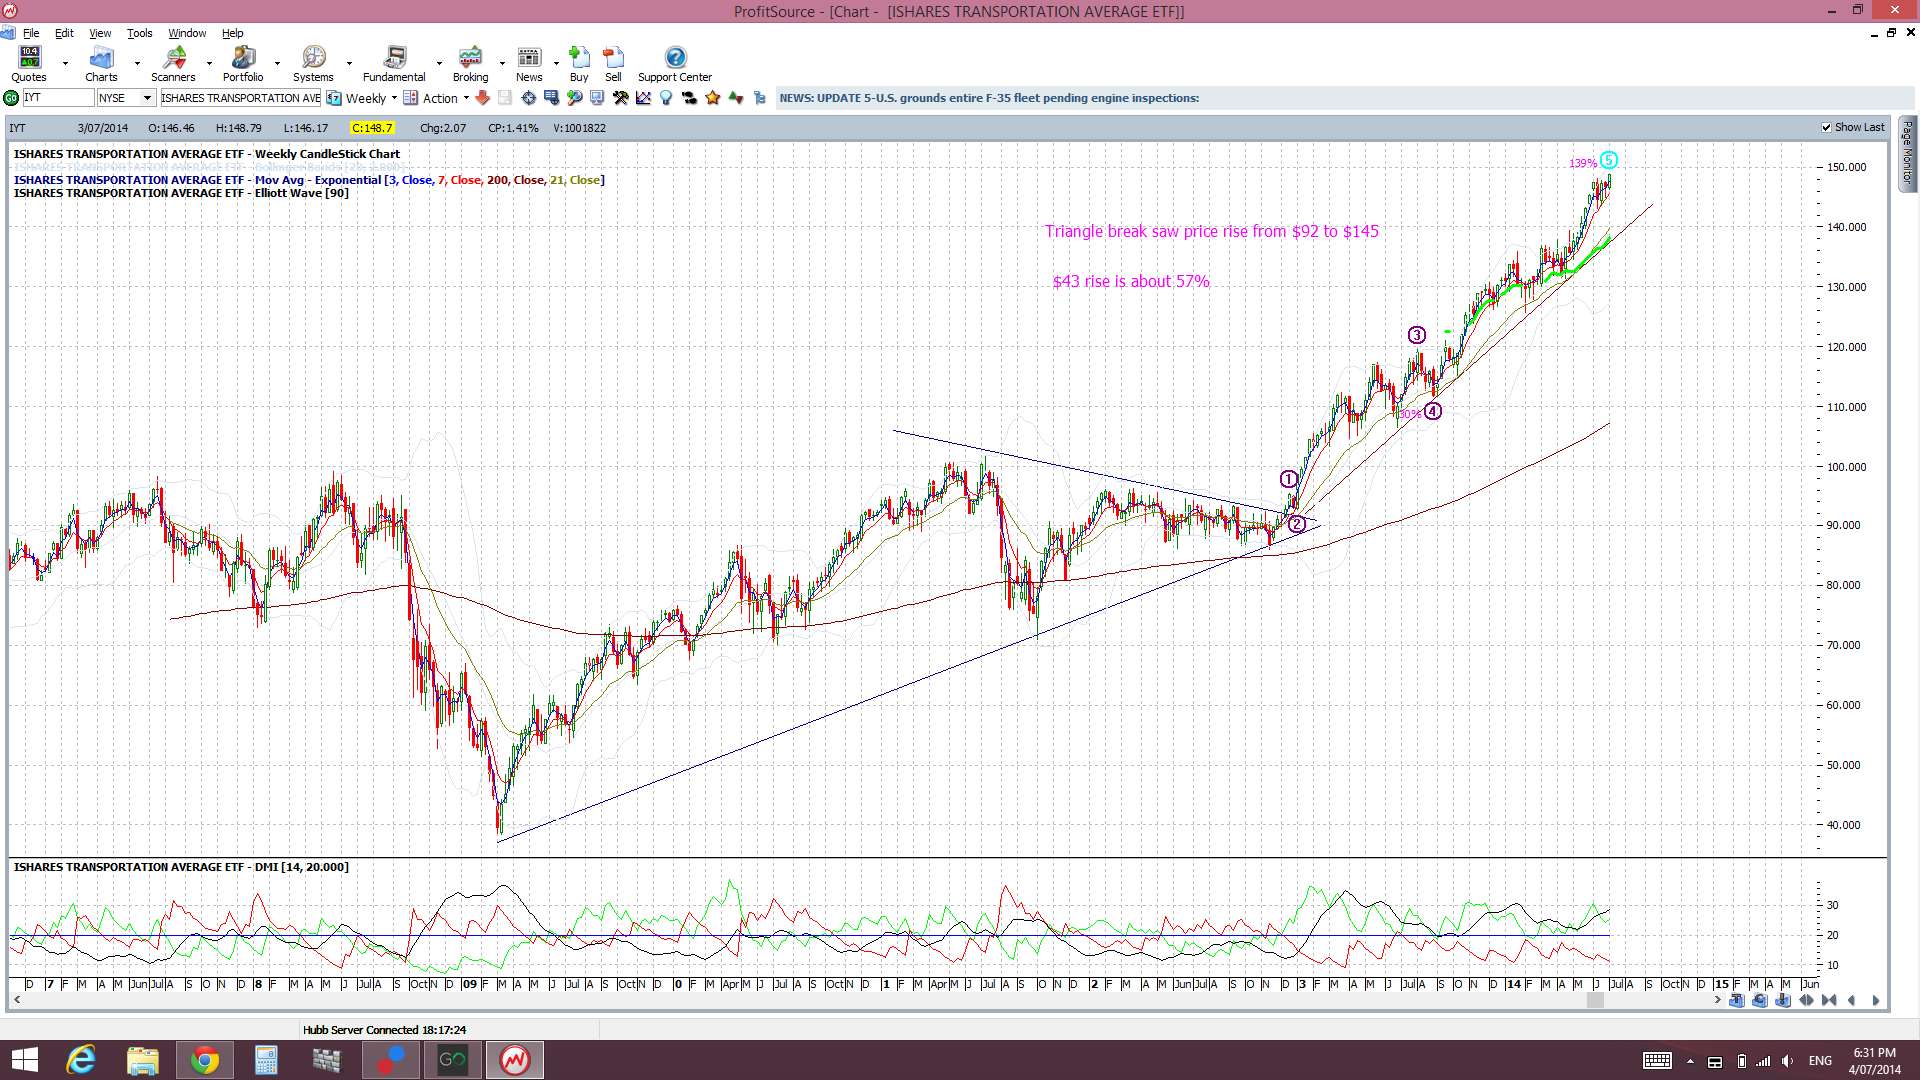
IYT: the transport ETF continues:
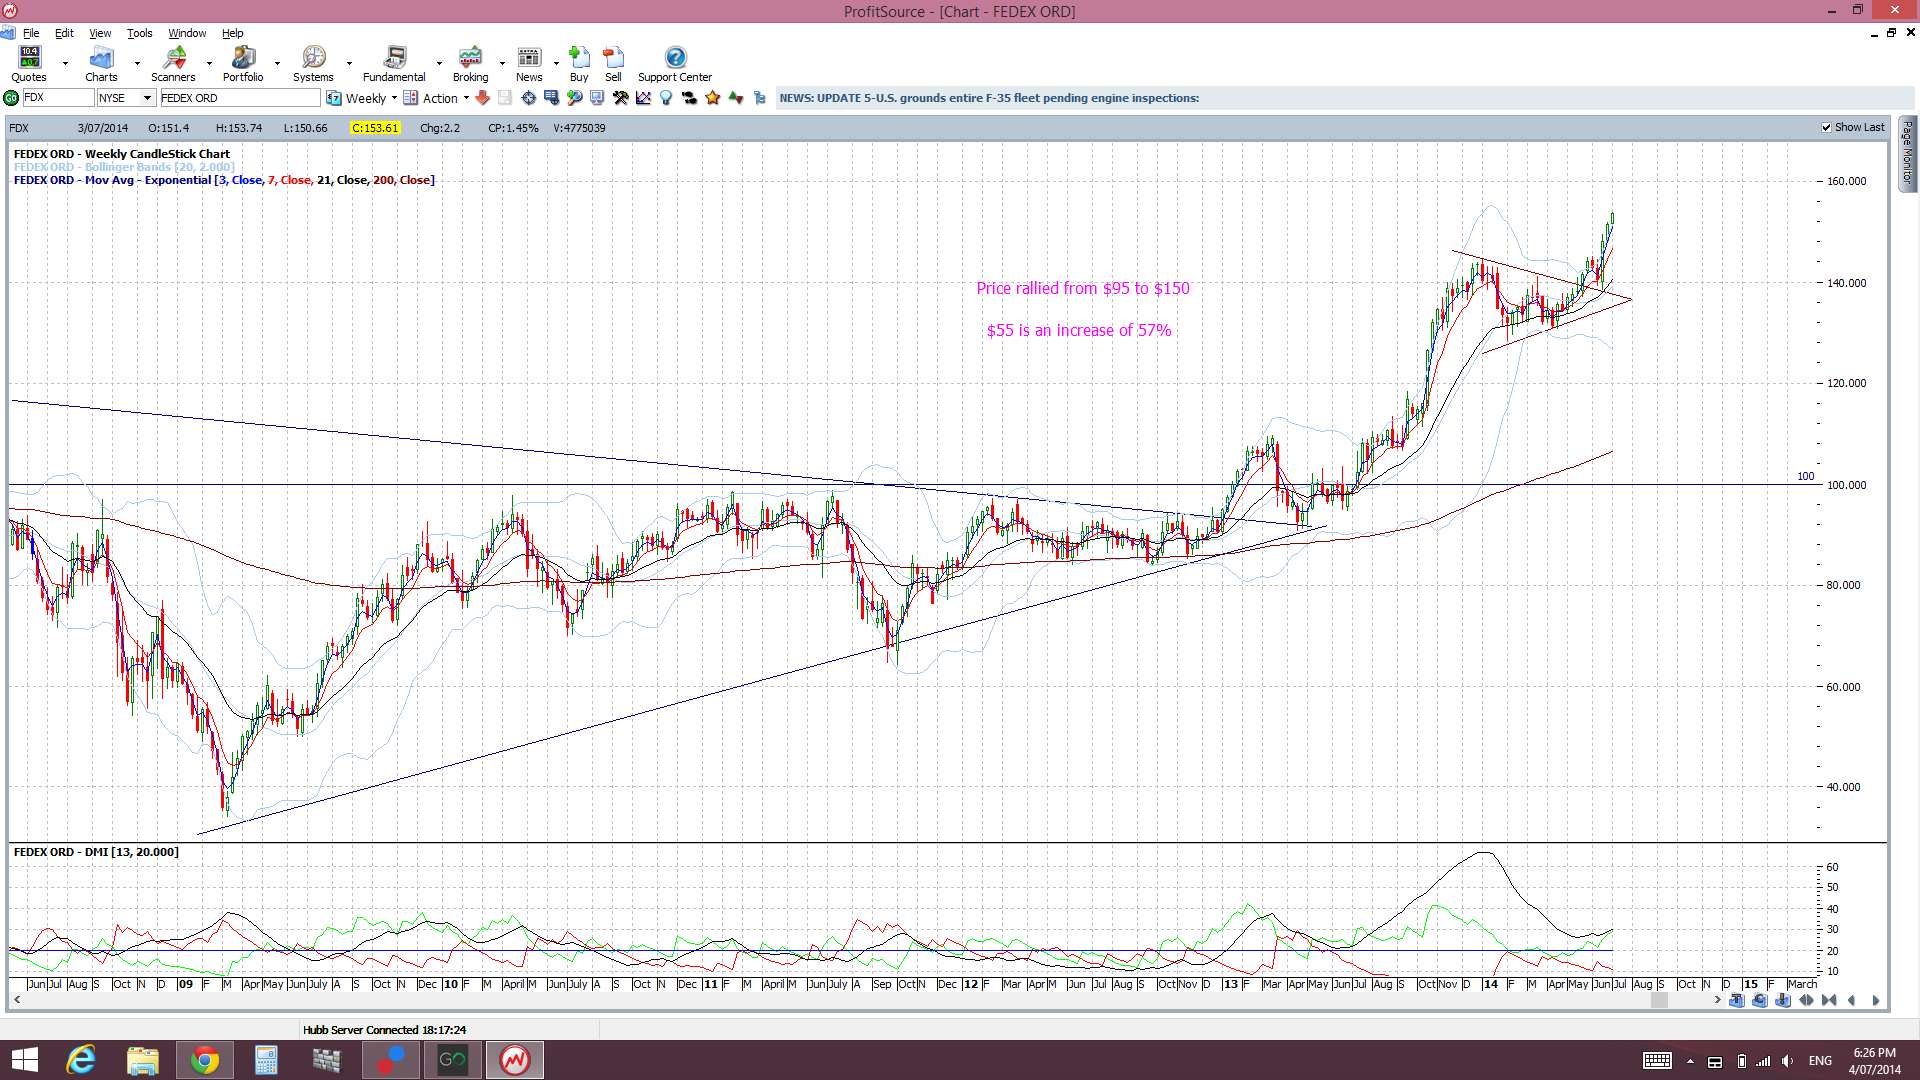
FDX: Fedex continues after a triangle breakout:
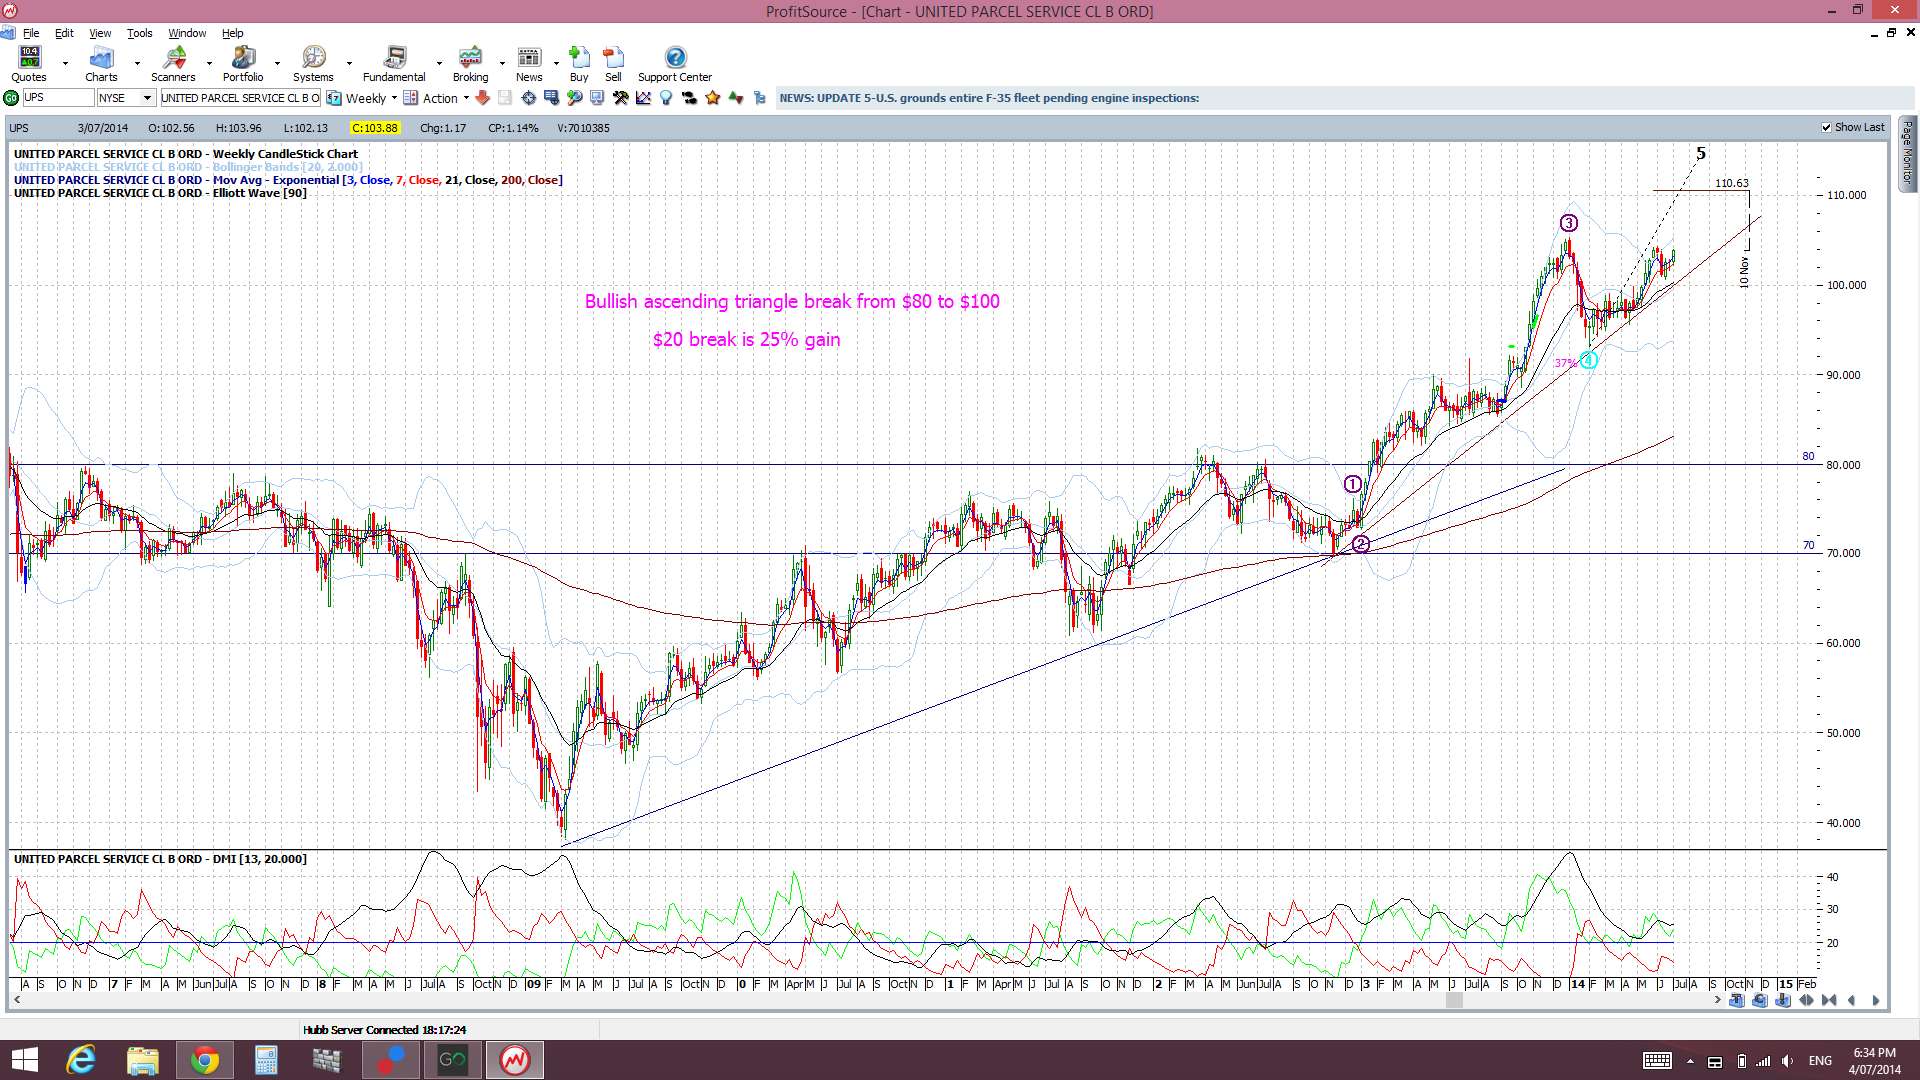
UPS: the parcel transport stock continues to hold above support too:
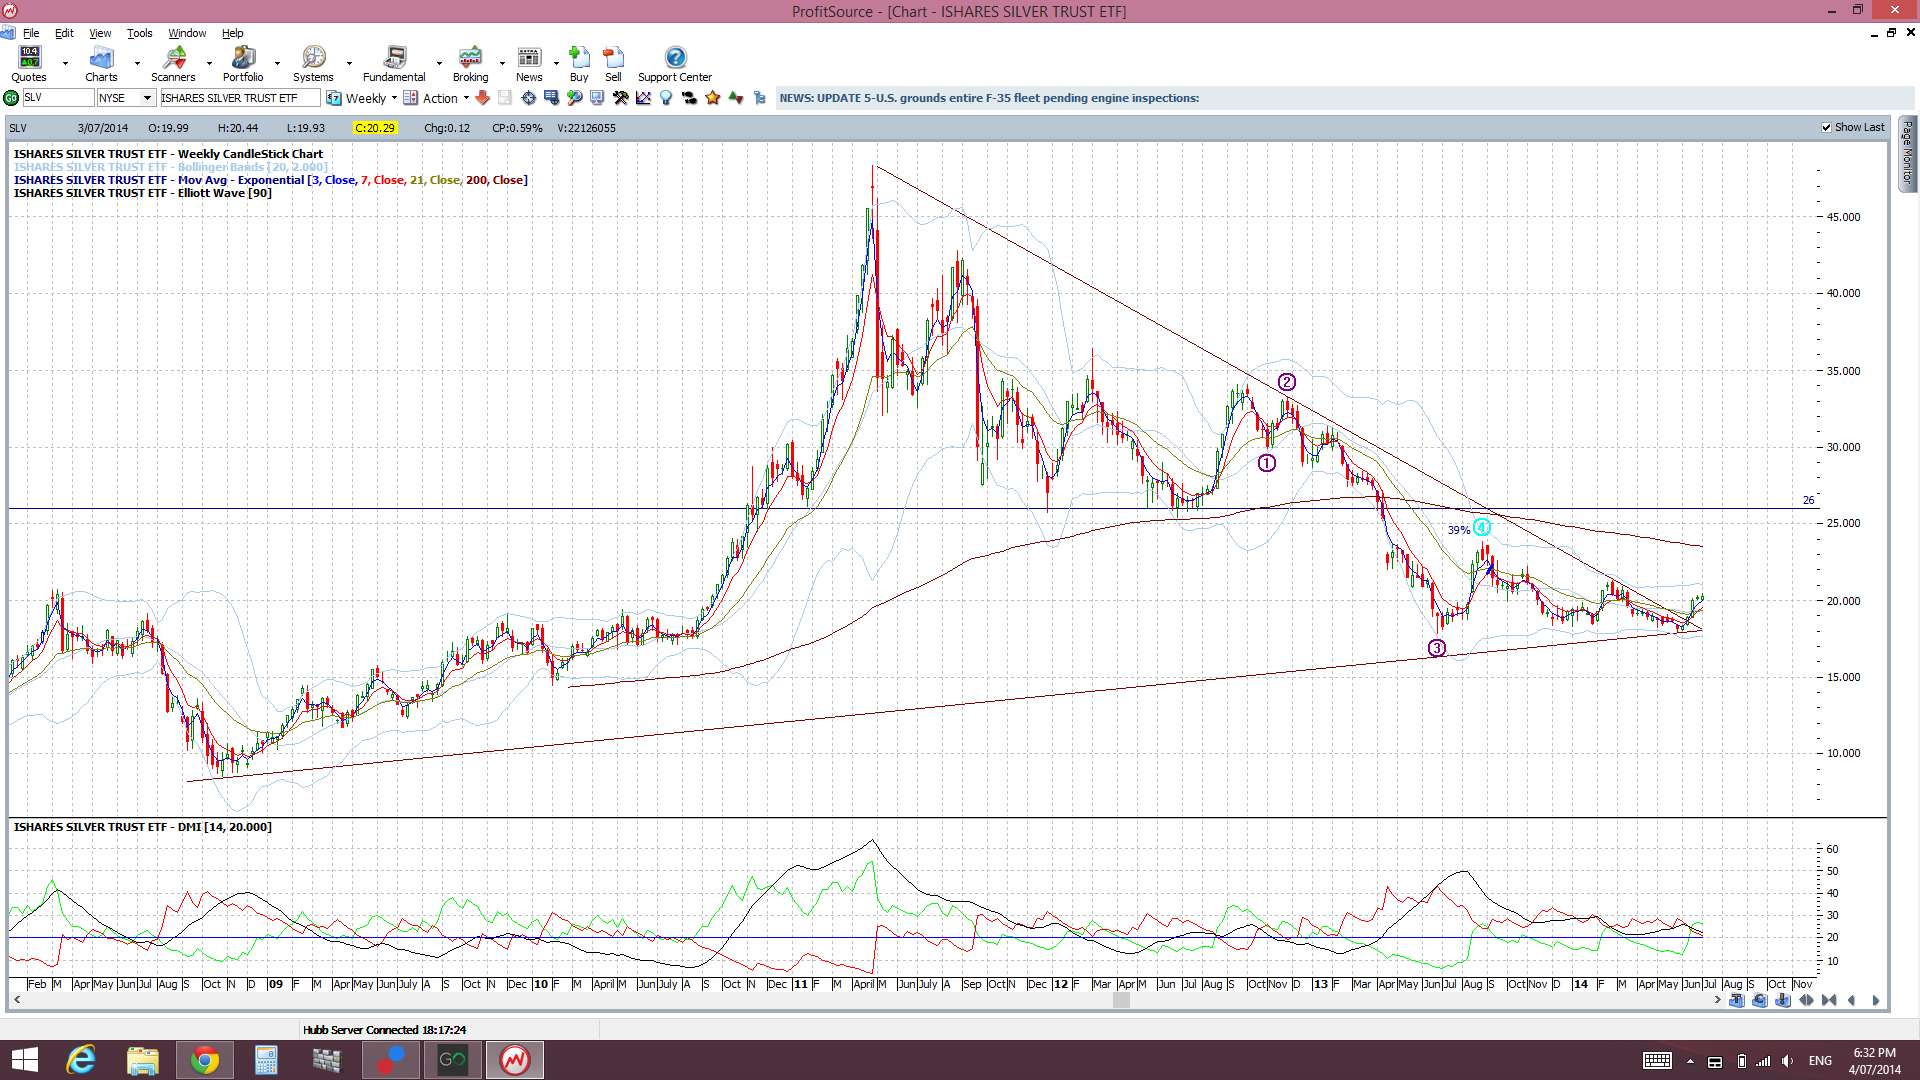
SLV: the silver ETF has made a bullish triangle breakout:
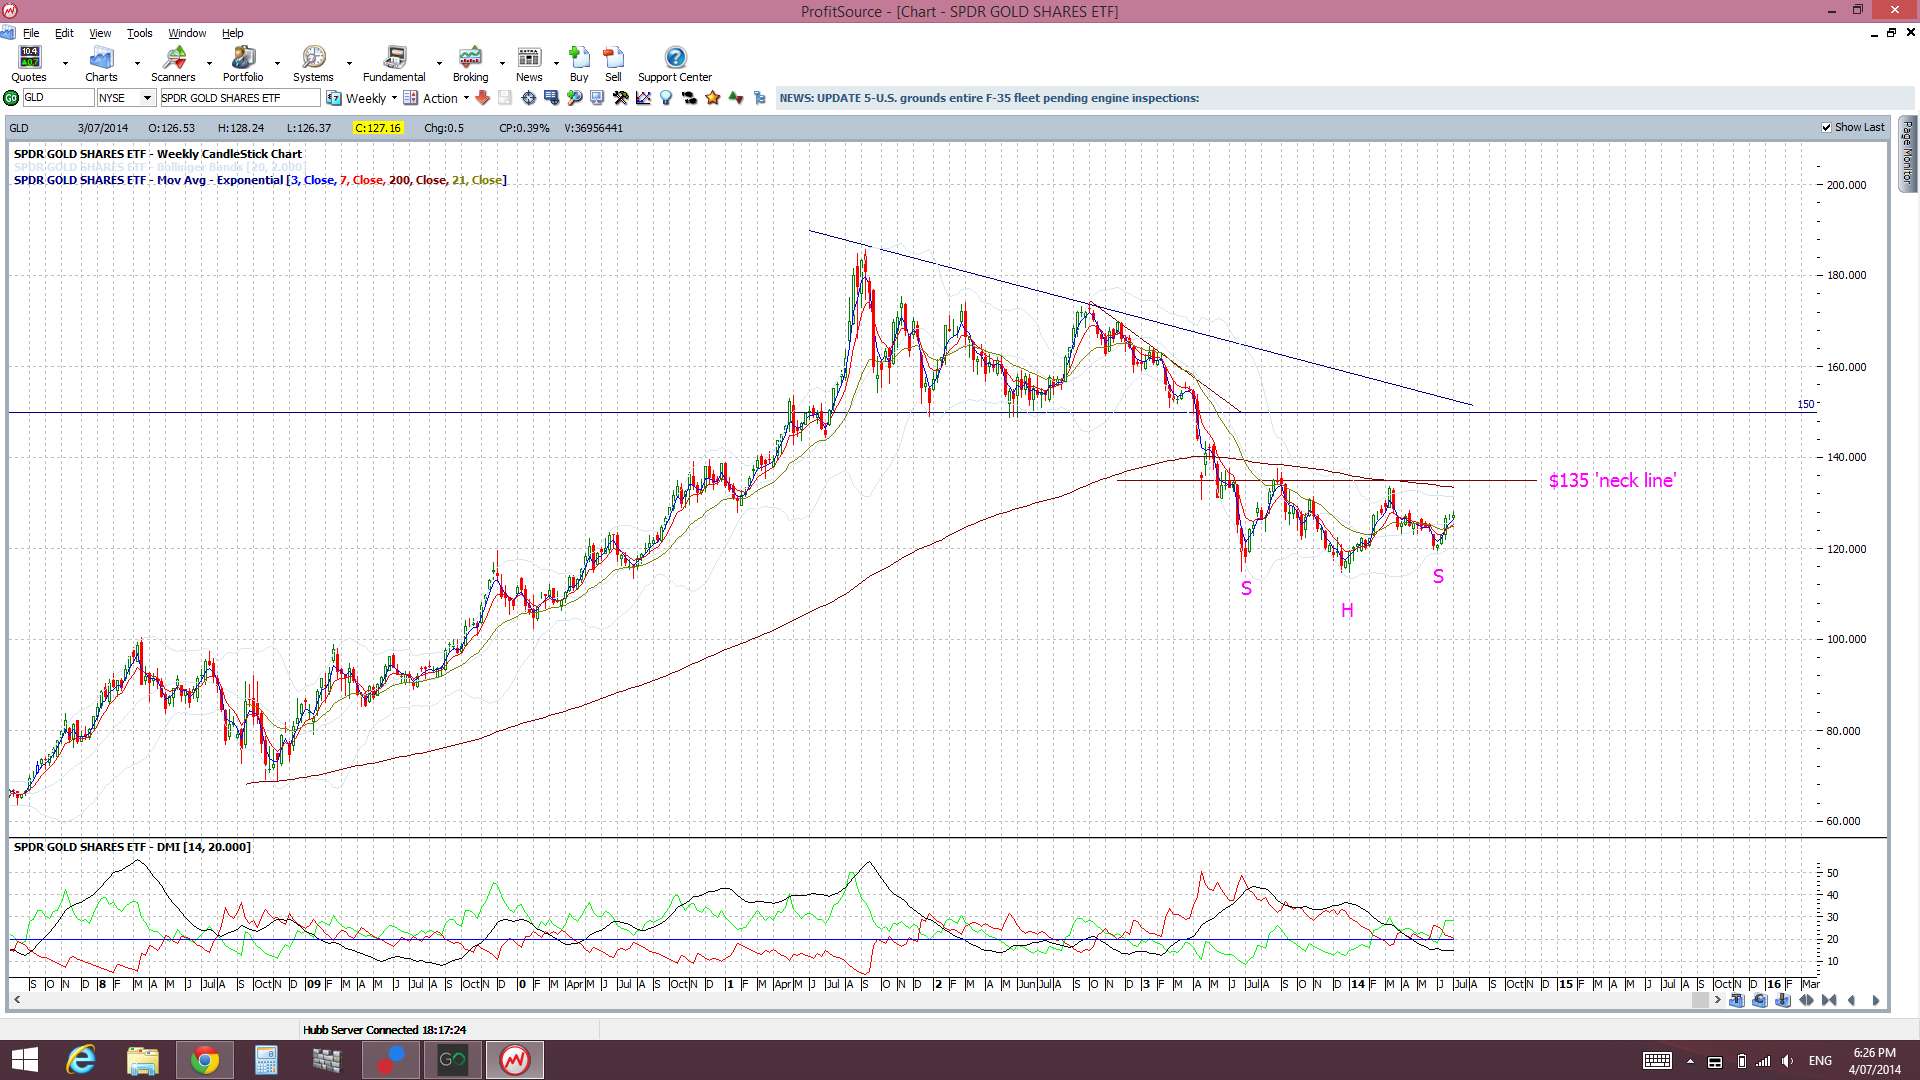
GLD: the Gold ETF looks to be carving out a bullish basing pattern with an ‘inverse H&S’ pattern:
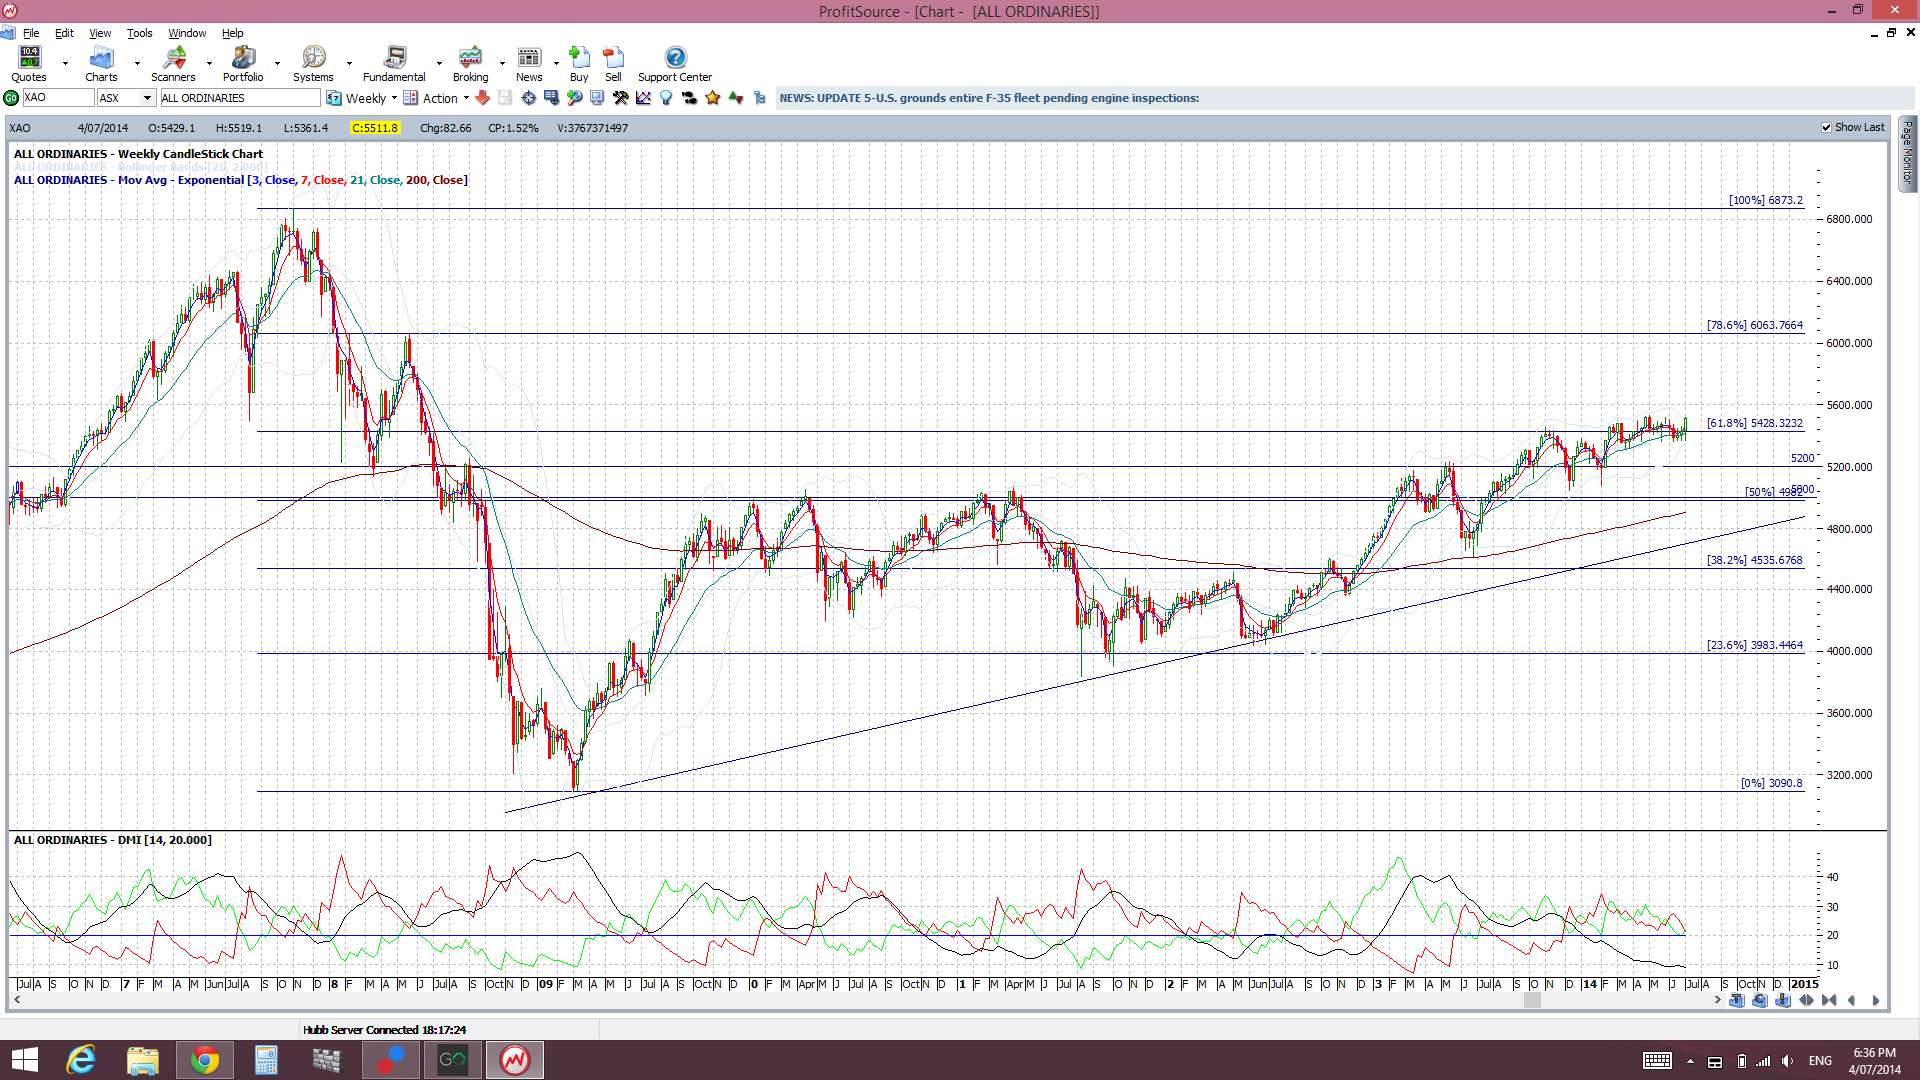
XAO: The Aussie All Ordinaries looks set to head to the 78.6% fib level at the 6,000 region:
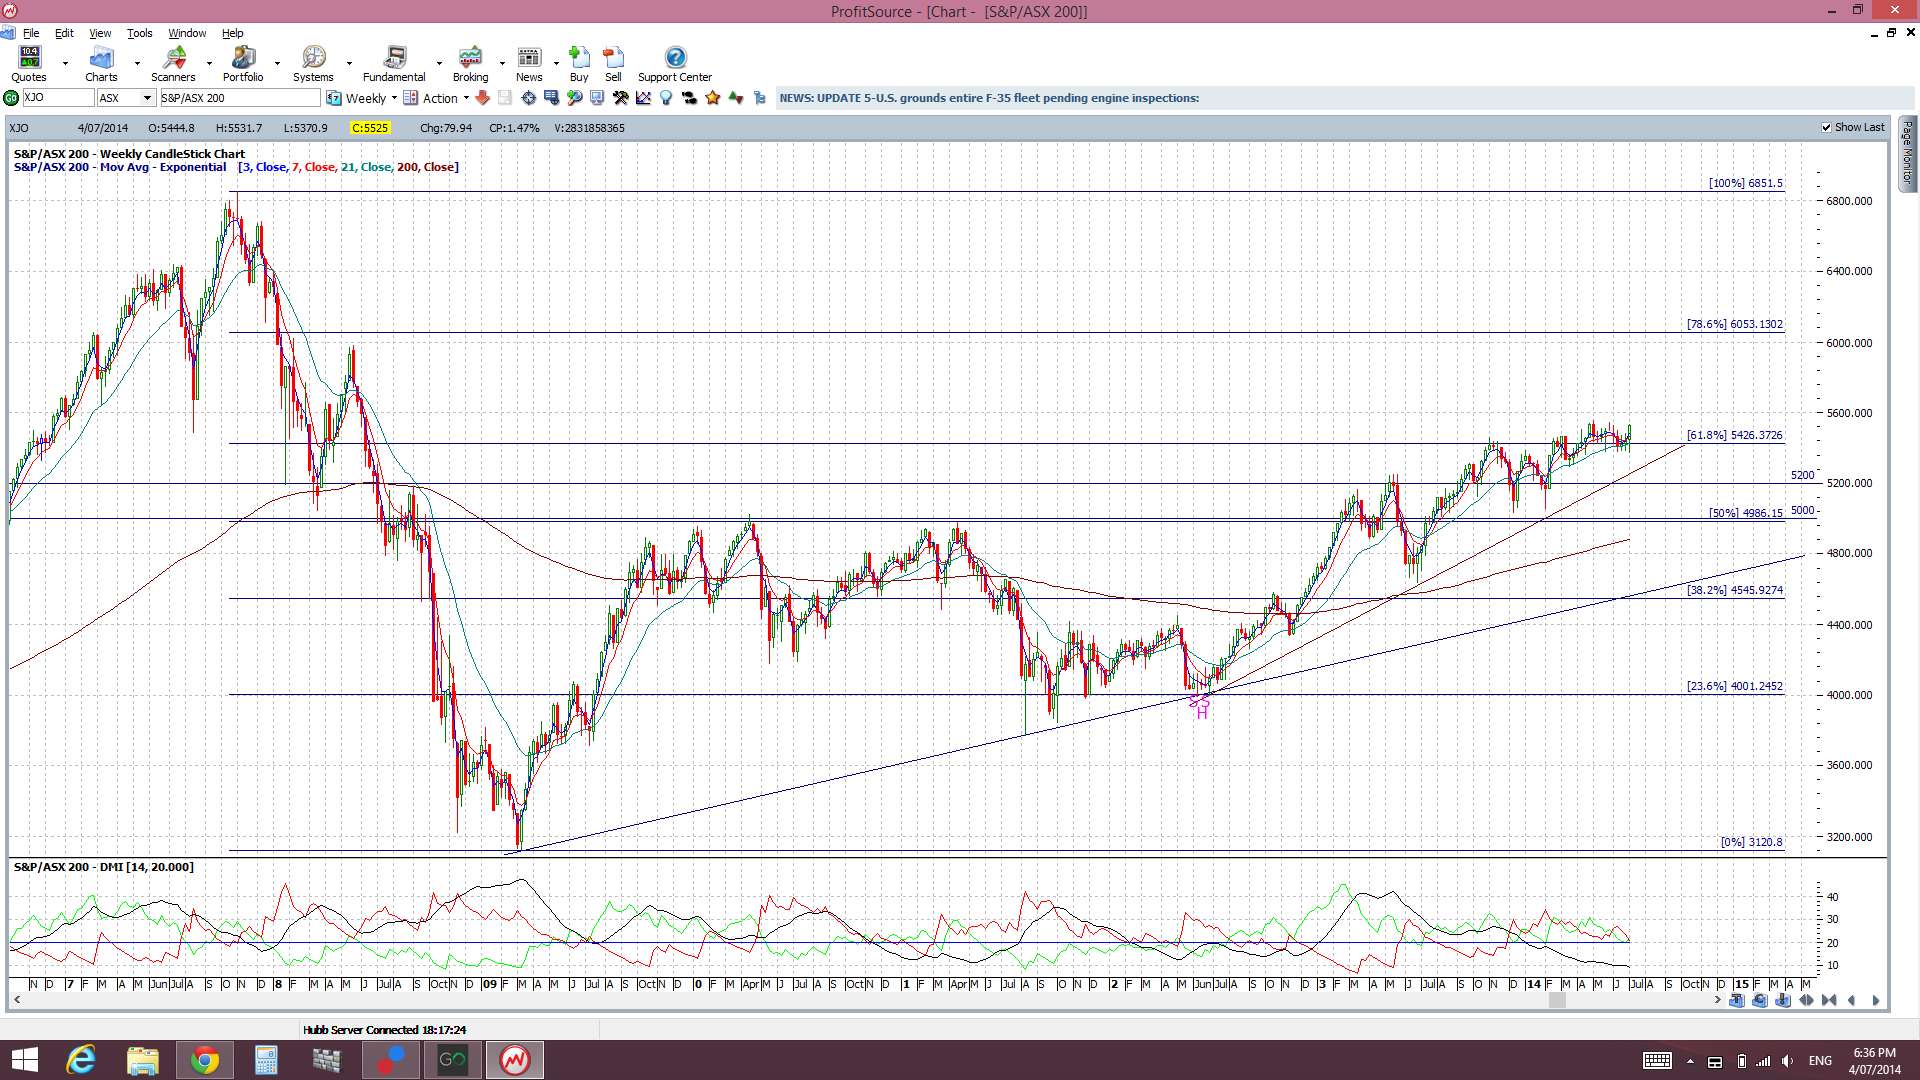
XJO: The Aussie ASX 200 also looks set to head to the 78.6% fib level at the 6,000 region:
XSO: The Aussie small caps index looking about to attempt a bullish triangle breakout:

Some US stocks in focus:
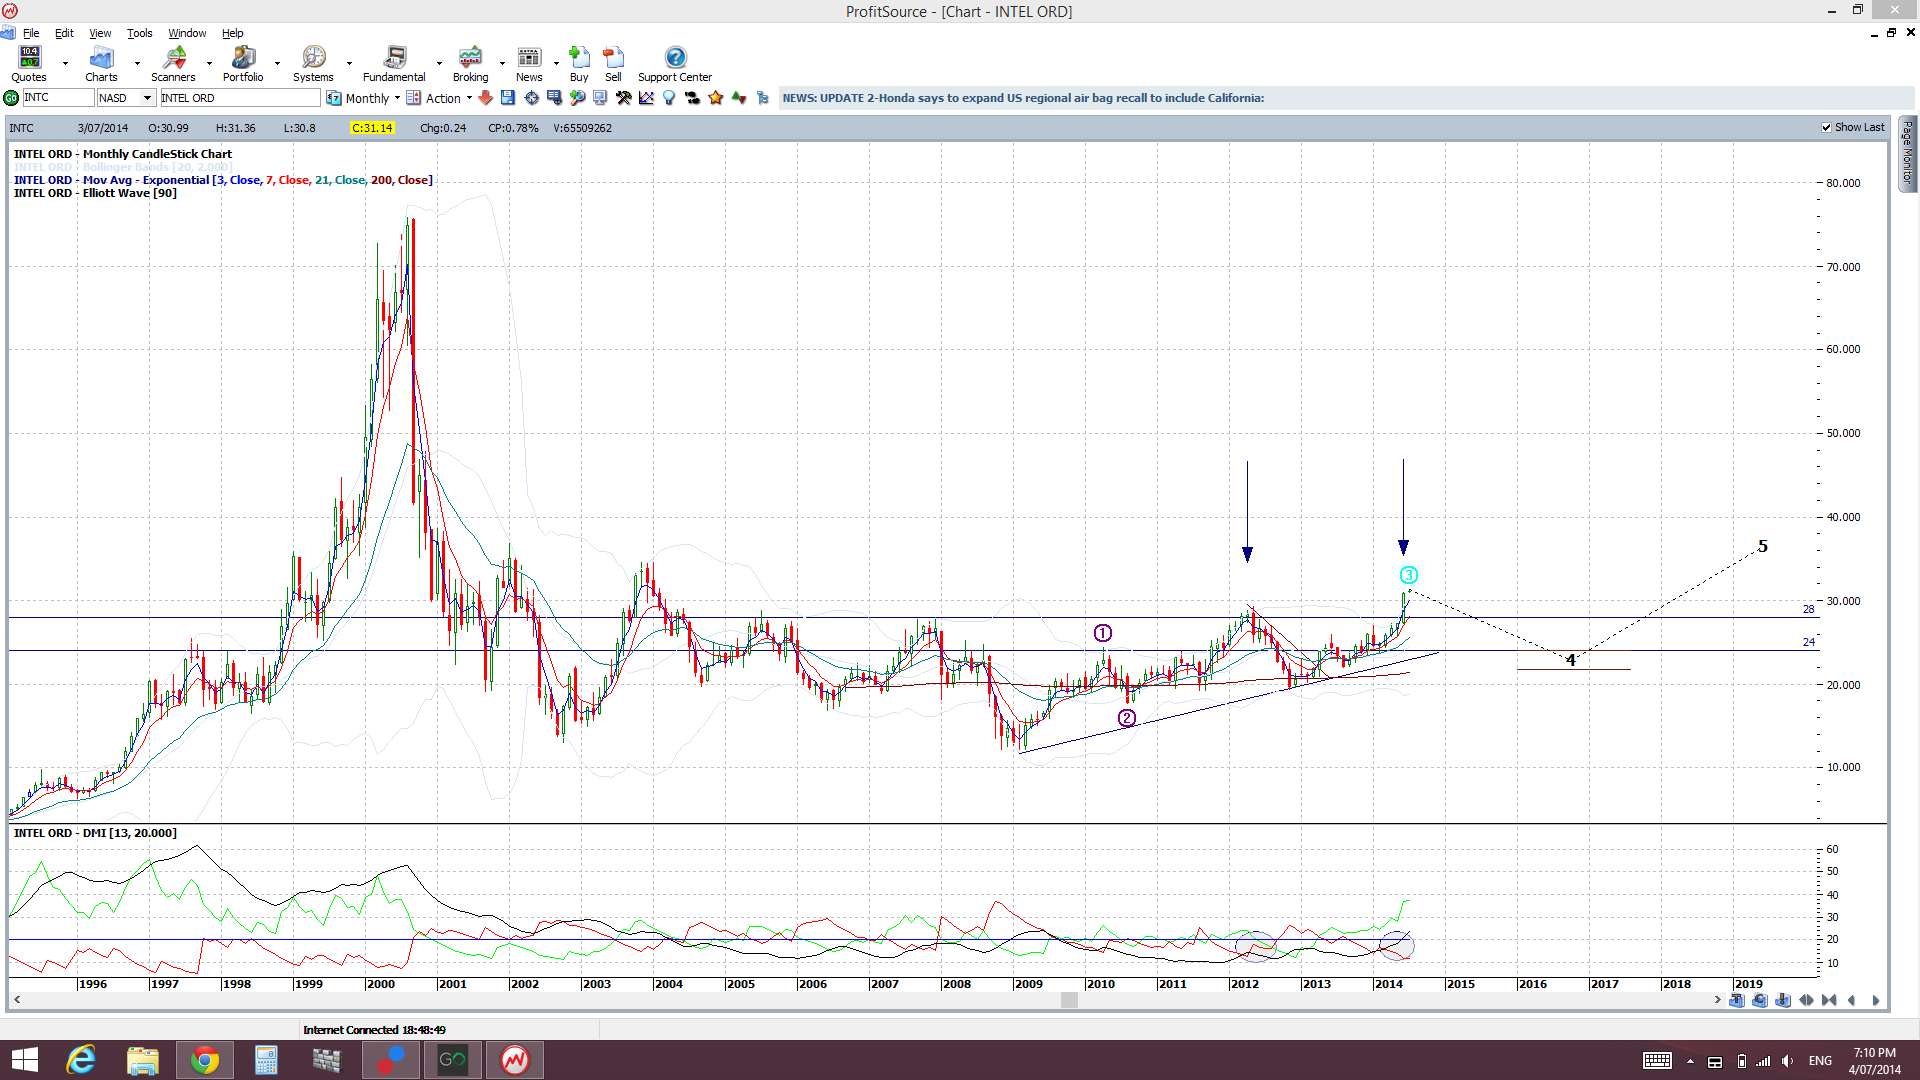
INTC: the monthly close above the $28 is bullish and the ADX shows there is more momentum behind this monthly candle close than for that back in 2012. I’m looking for continuation here BUT price could dip back to test the $28 level again before bullish continuation:

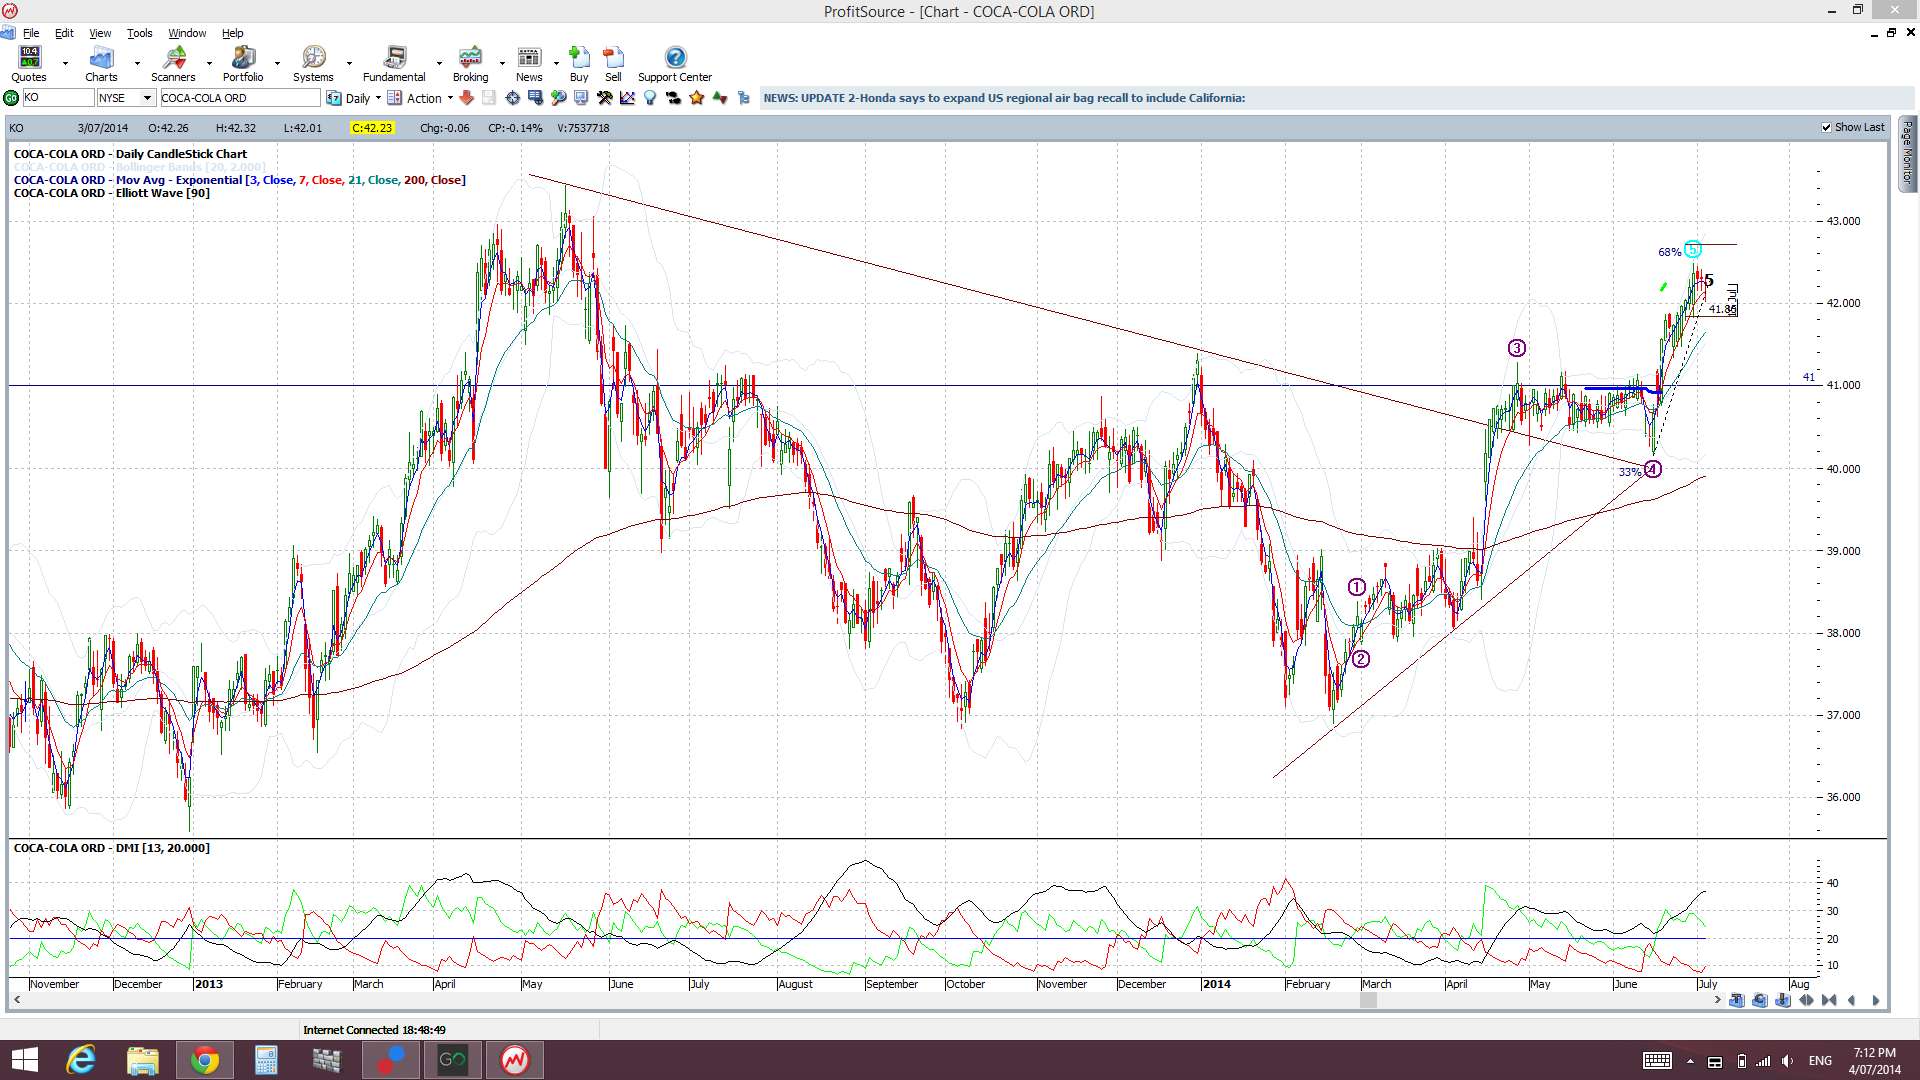
KO: the close and hold above the $41 is bullish:
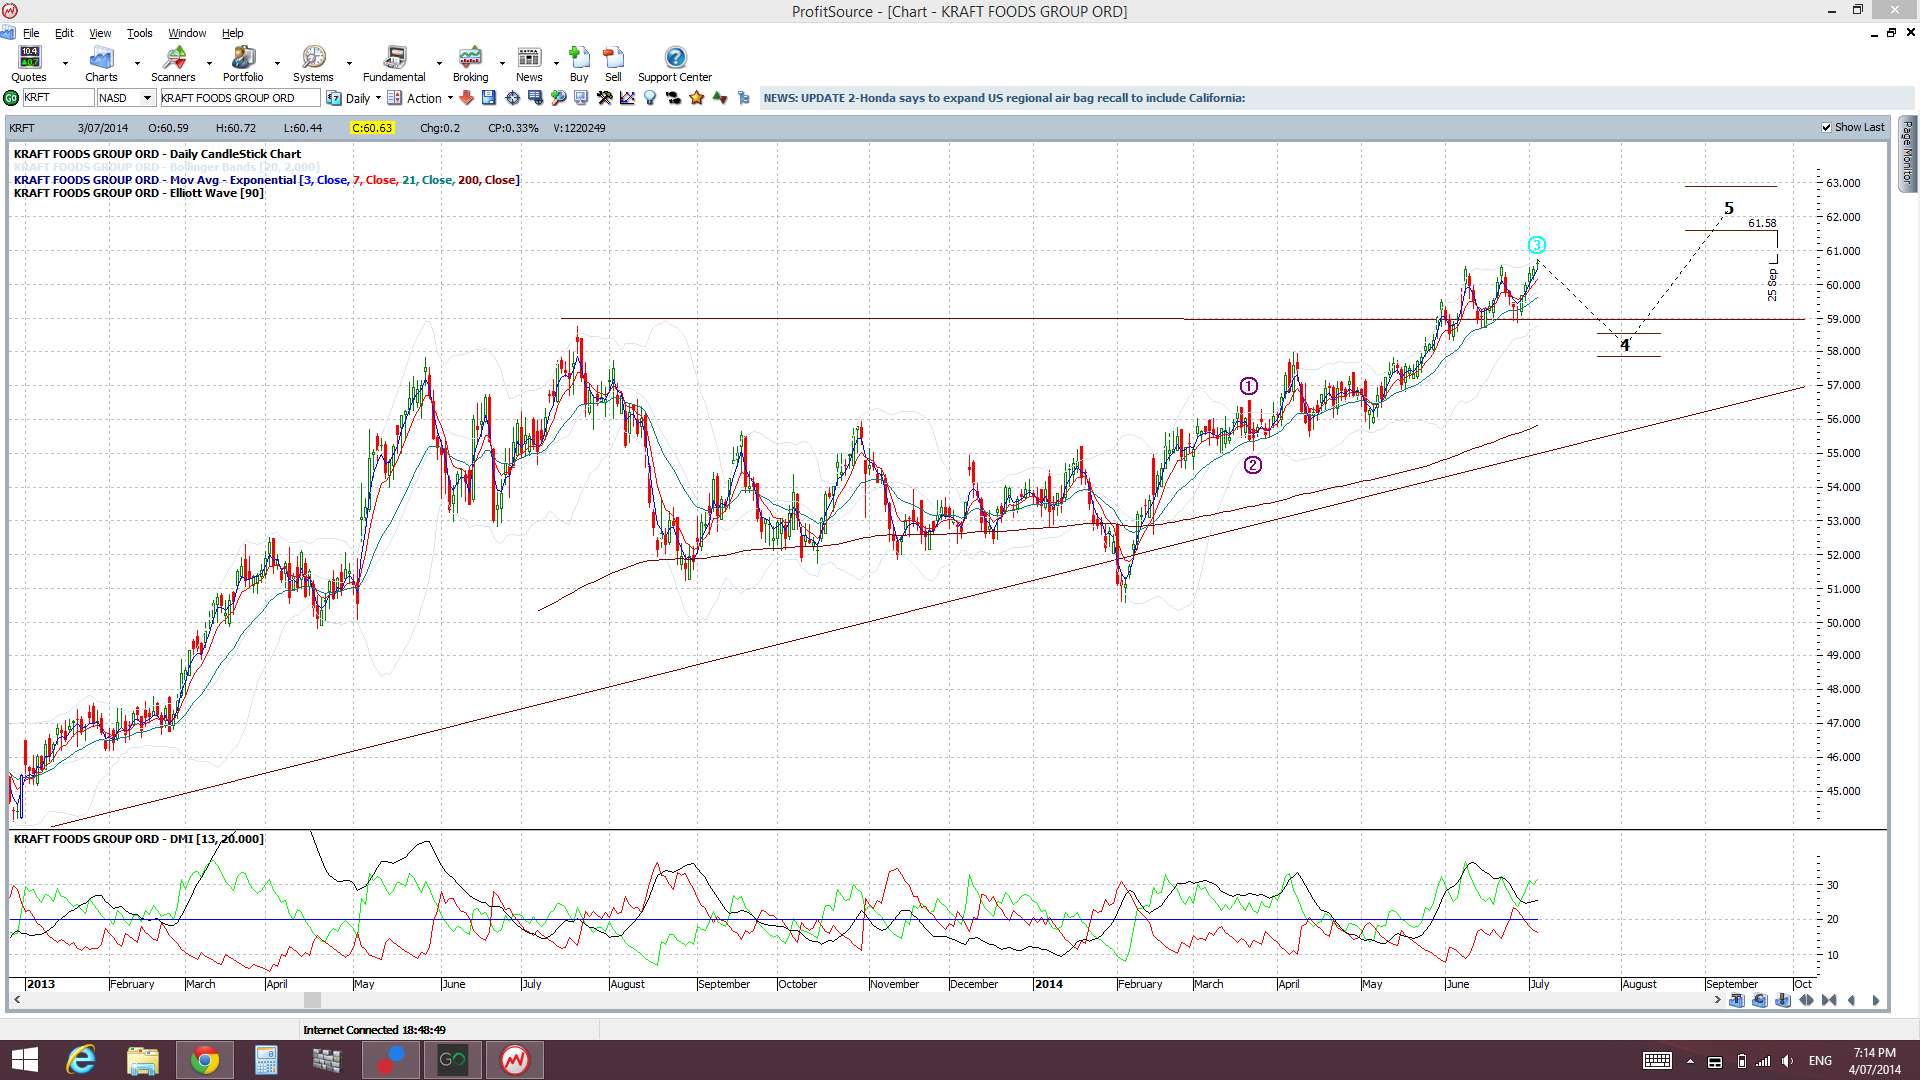
KRFT: has made a bullish ascending triangle break above the $59 level. Look for continuation here:
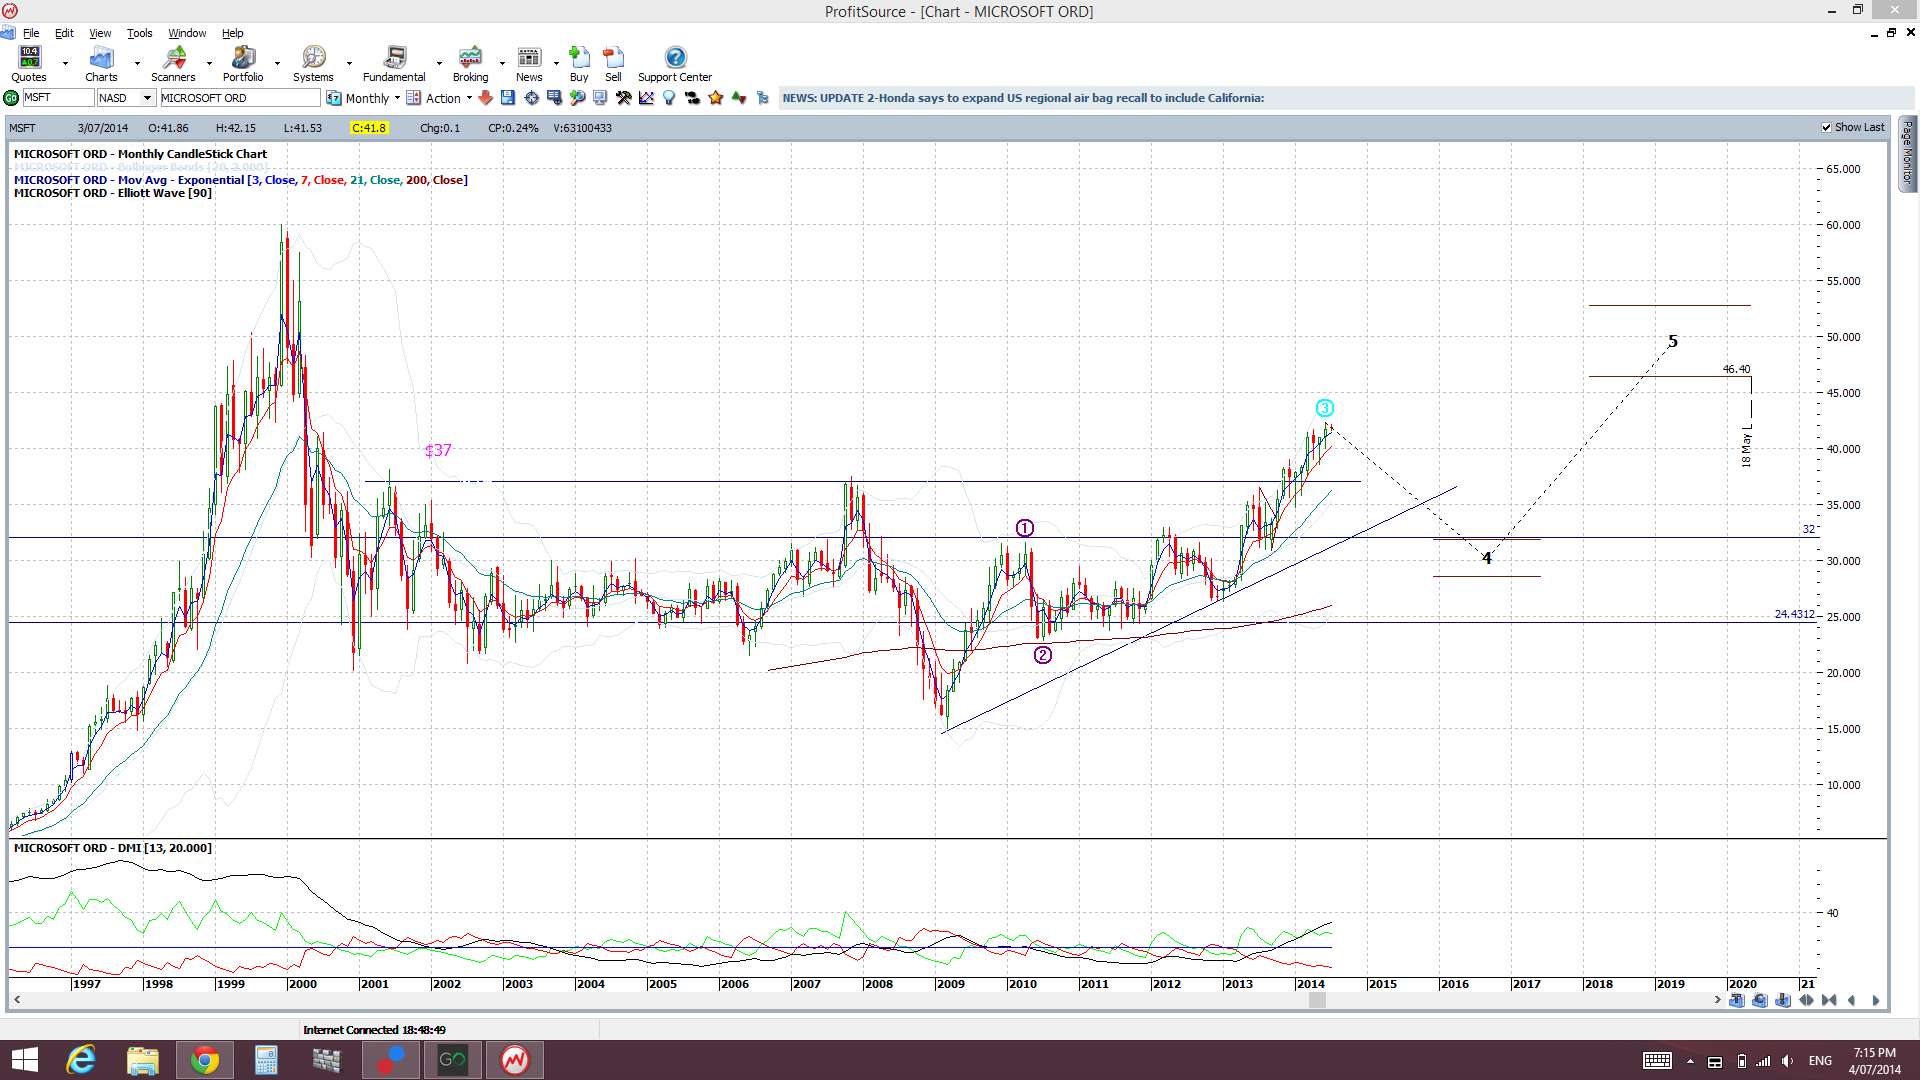
MSFT: the continued hold above the key $37 level suggests continuation here:
NUE: still watching for a bullish triangle breakout here:

PEP: I’m looking to see if $87 becomes new support here:

AA: I’m looking for this to continue to $18:

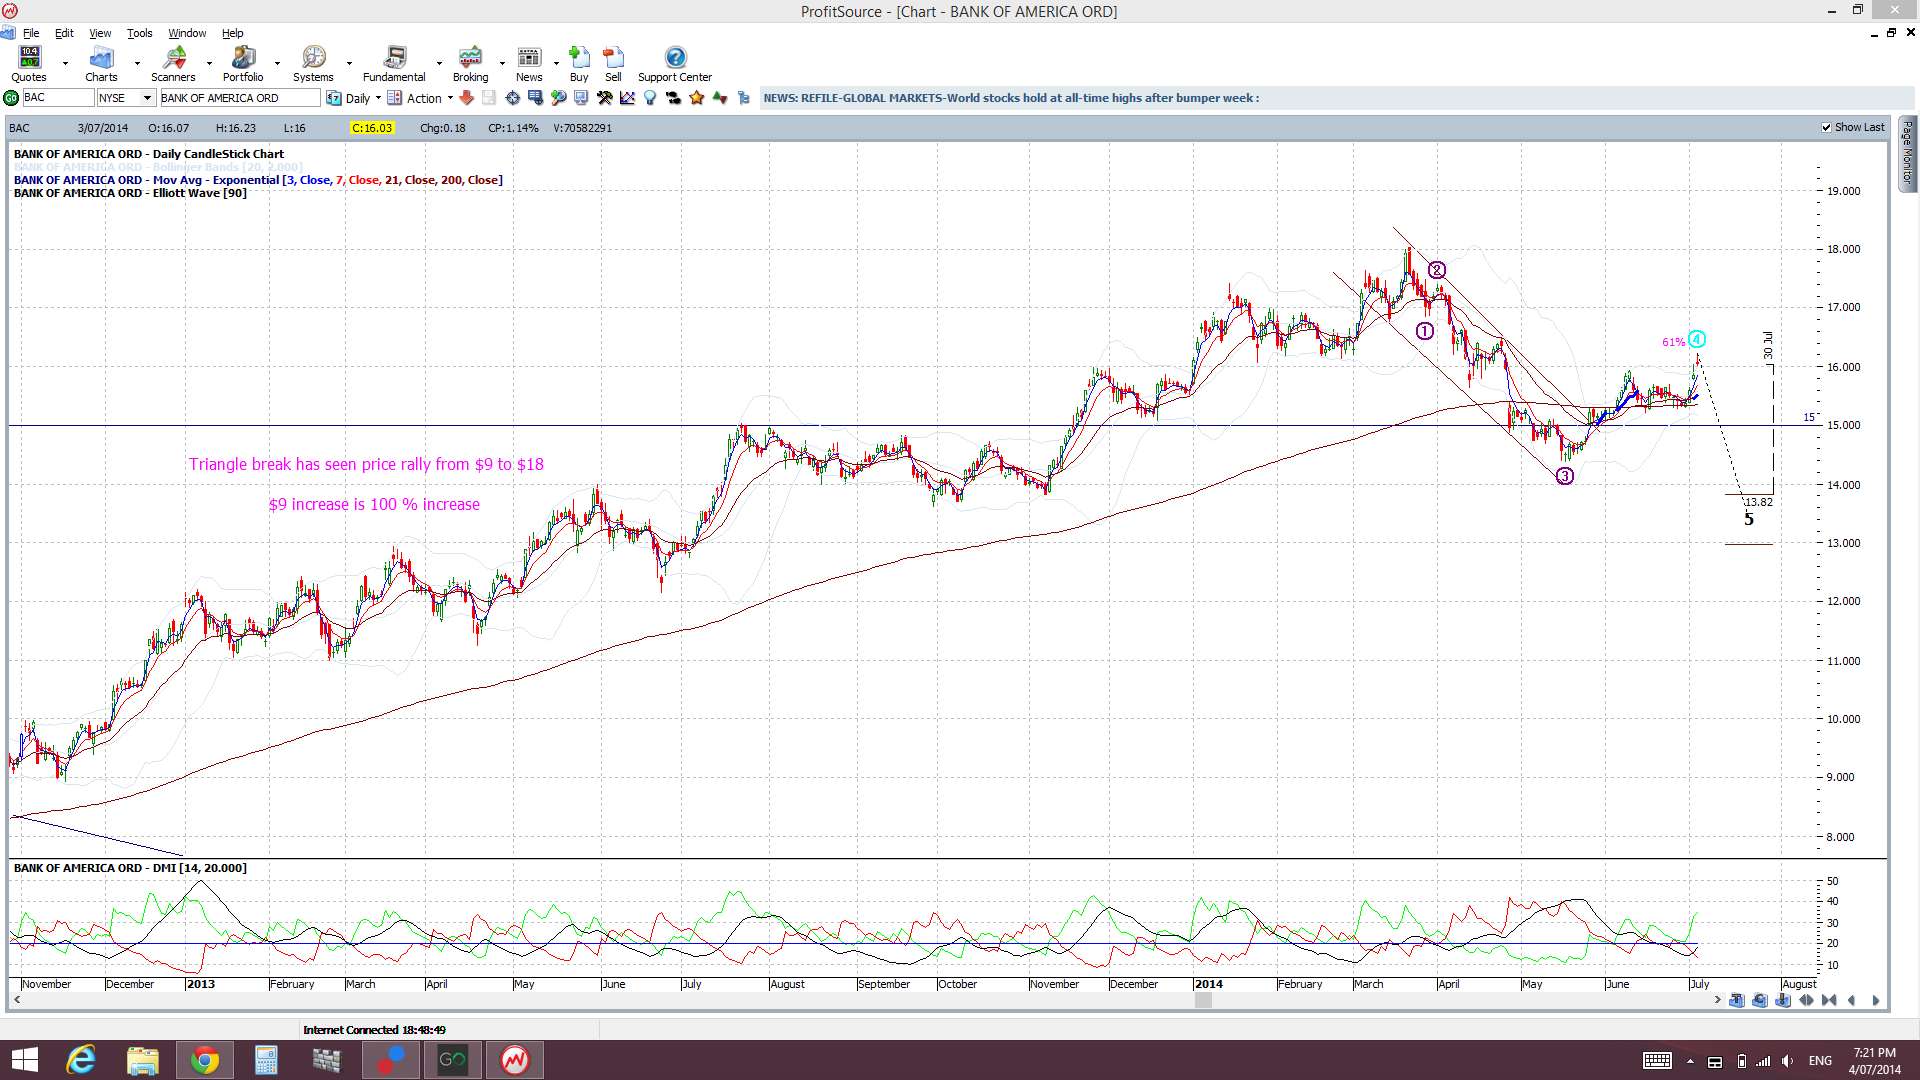
BAC: the continued hold above the $15 is encouraging here as I’m long this stock.
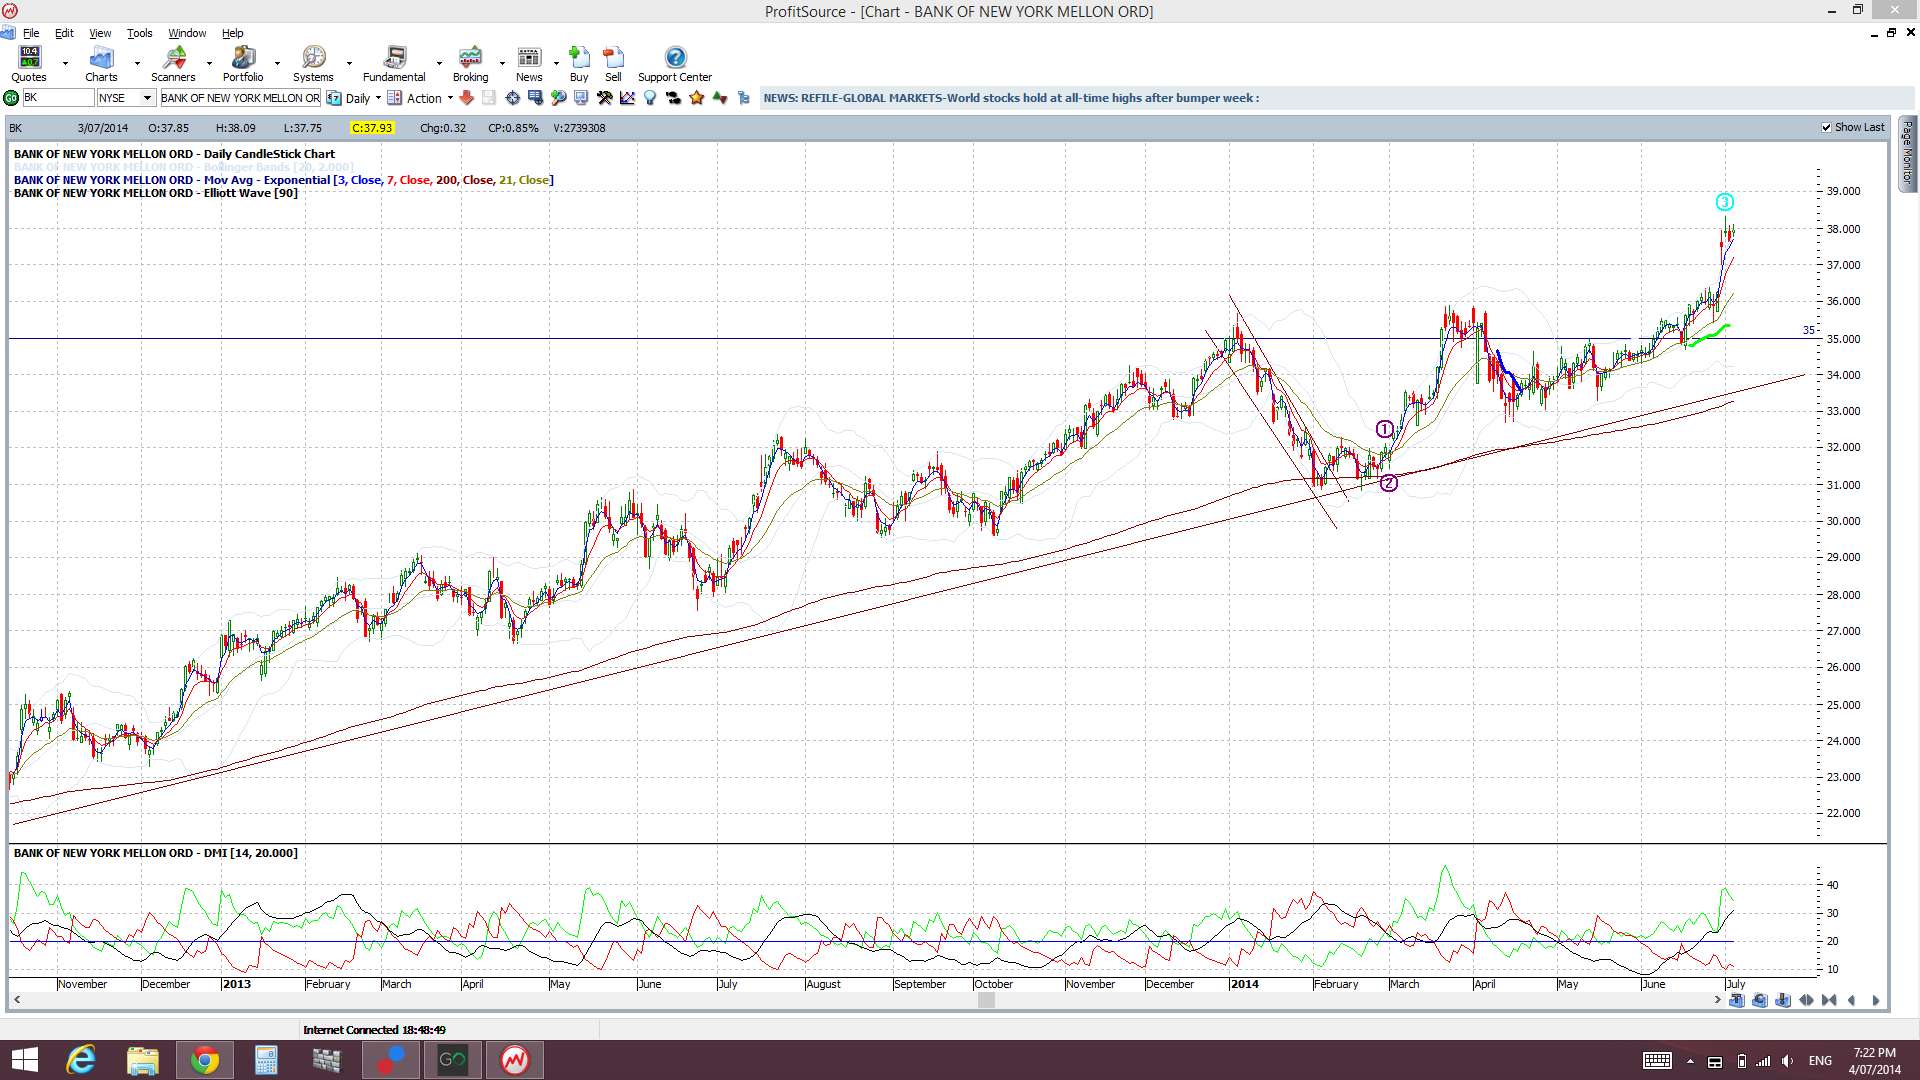
BK: this has made a bullish ascending triangle breakout too and looking for the $35 to become new support:
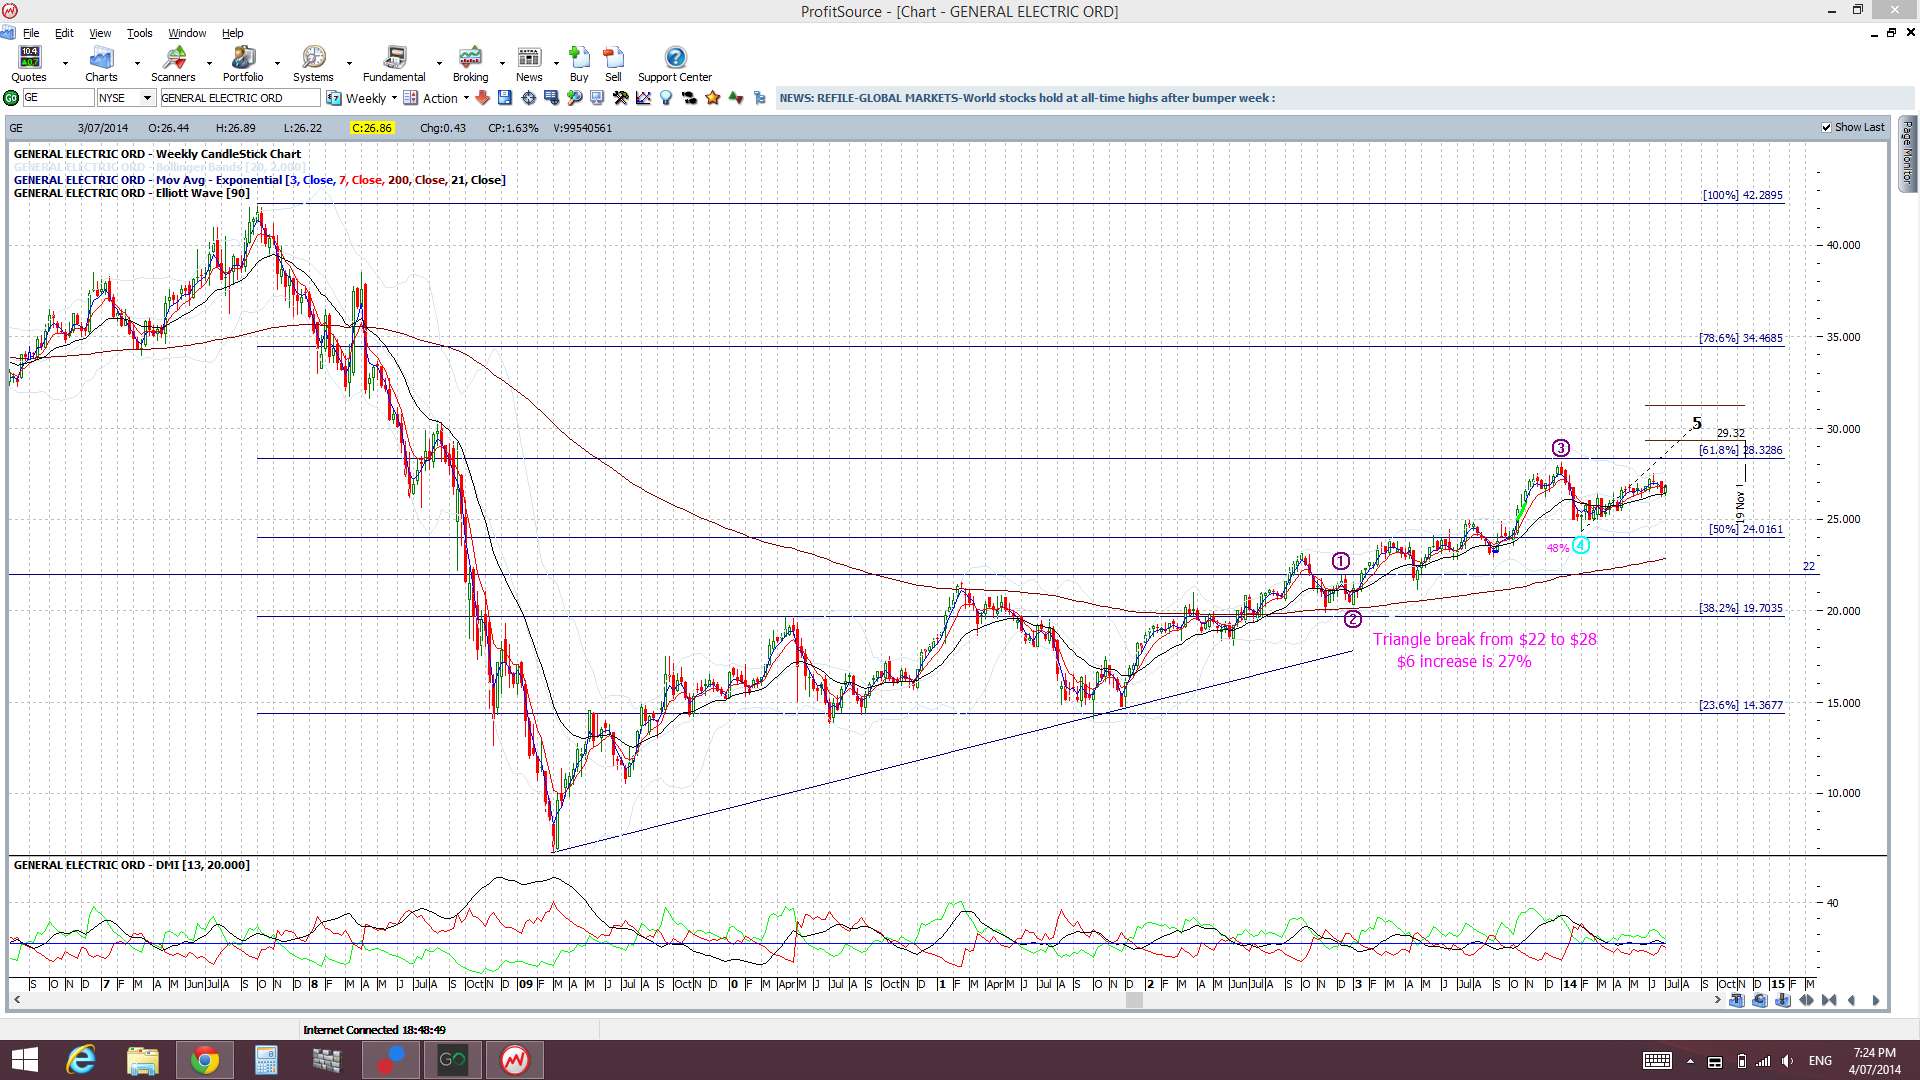
GE: looking for continuation here too:
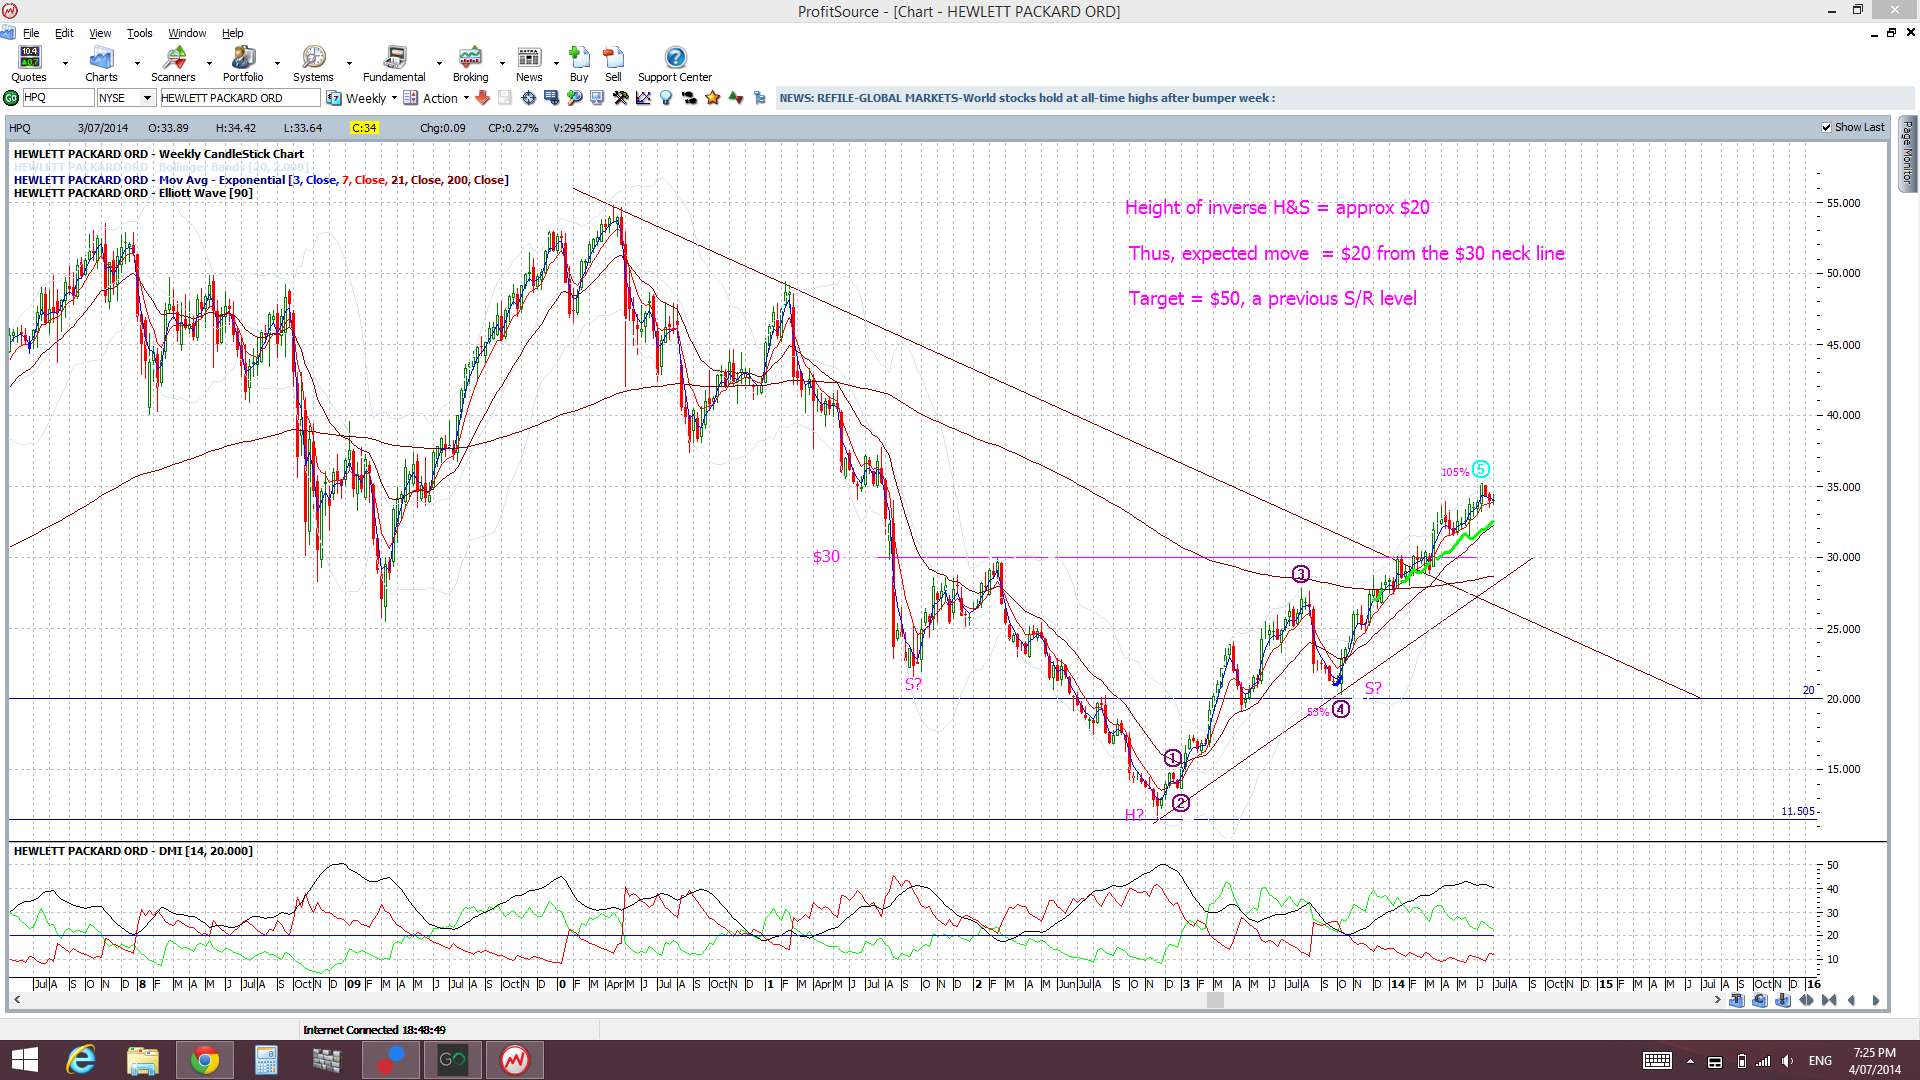
HPQ: looking for continuation here too:
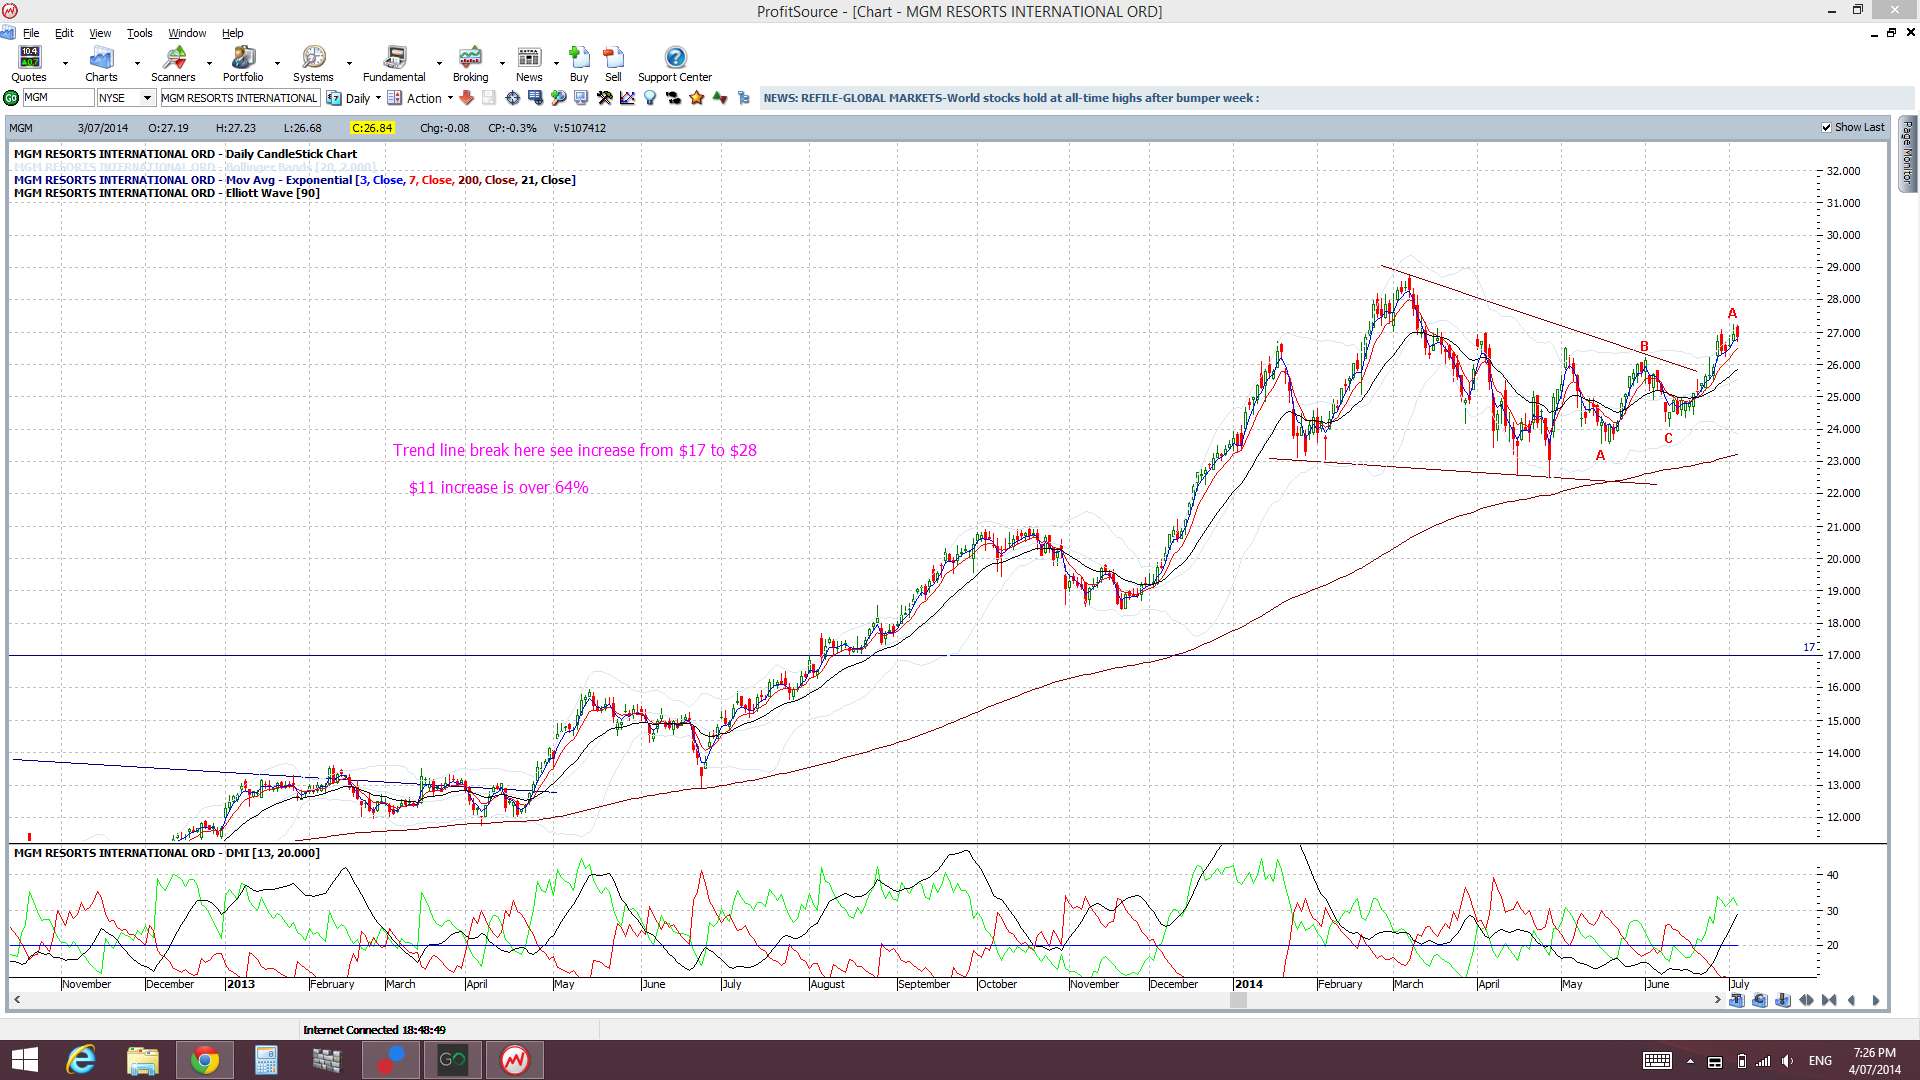
MGM: This has made a ‘Bull Flag’ breakout here now and I’m looking for continuation:
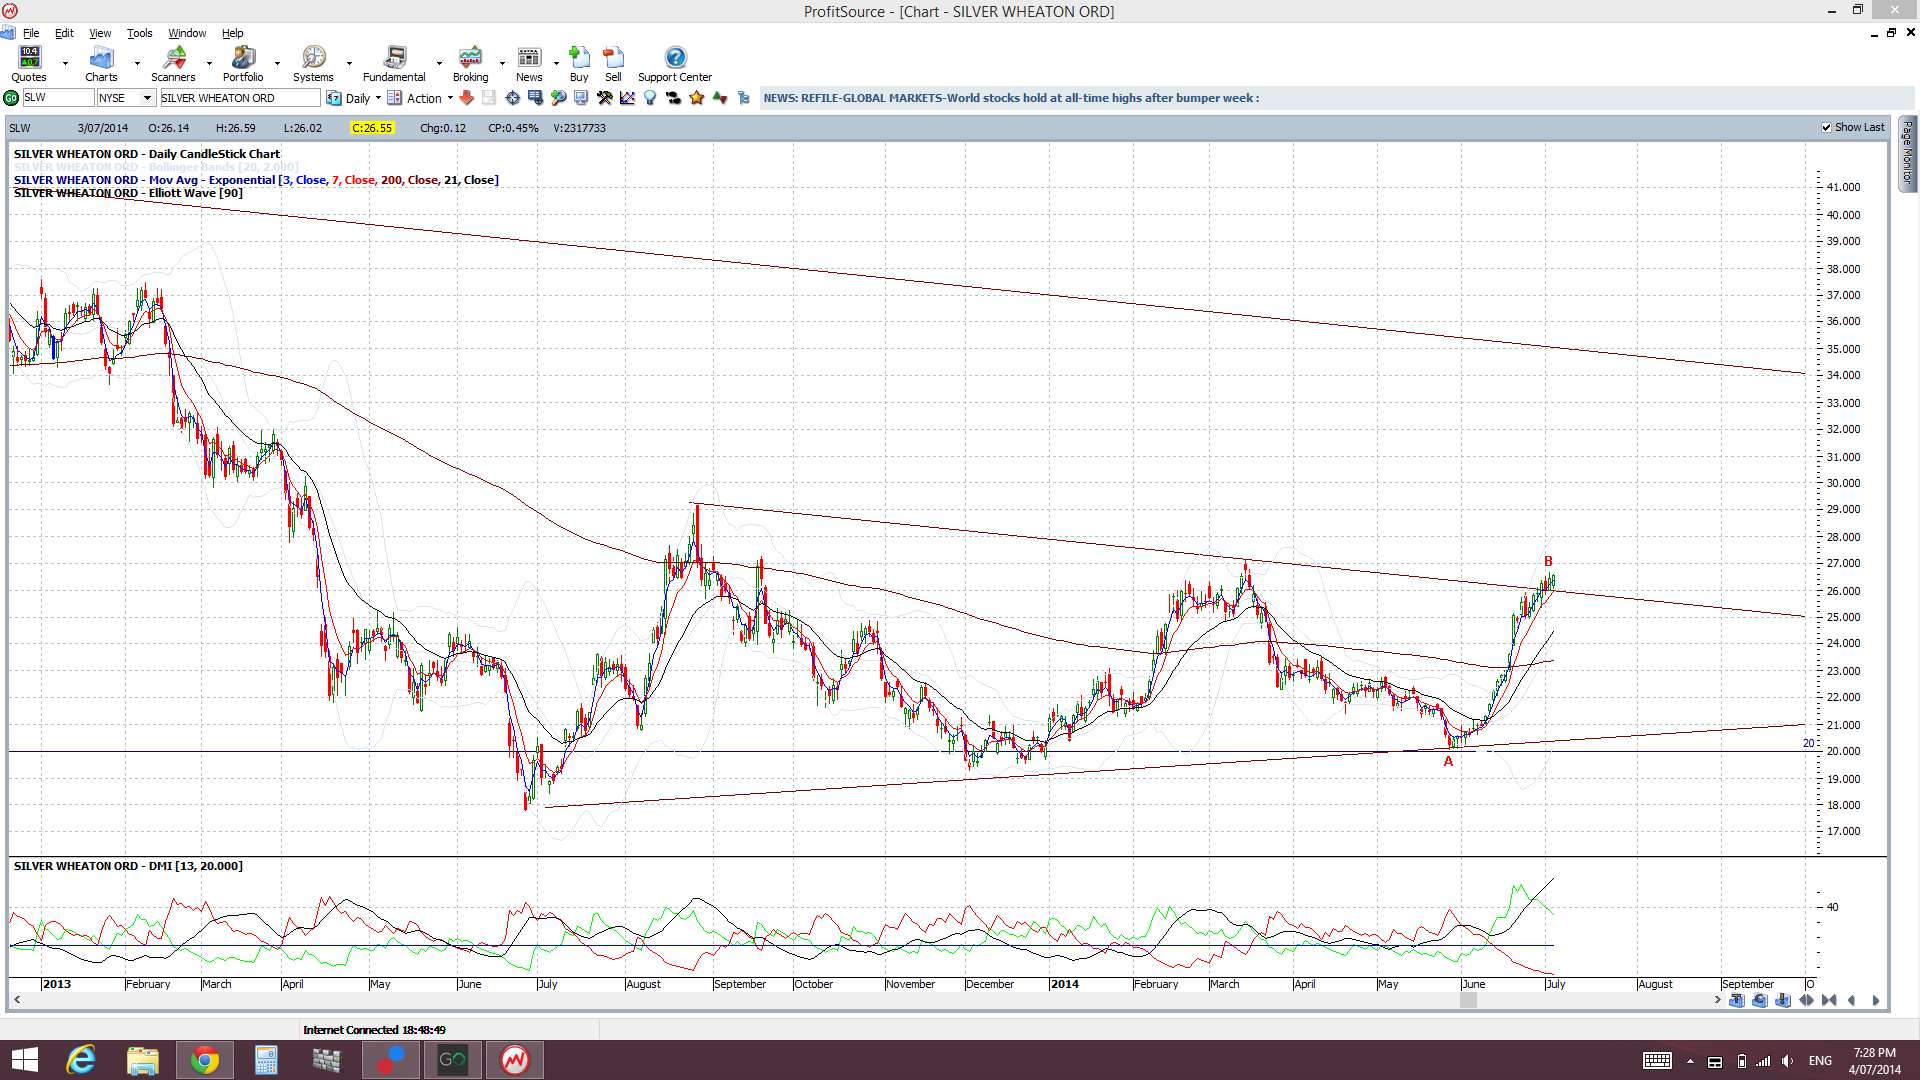
SLW: has made a bullish triangle breakout:
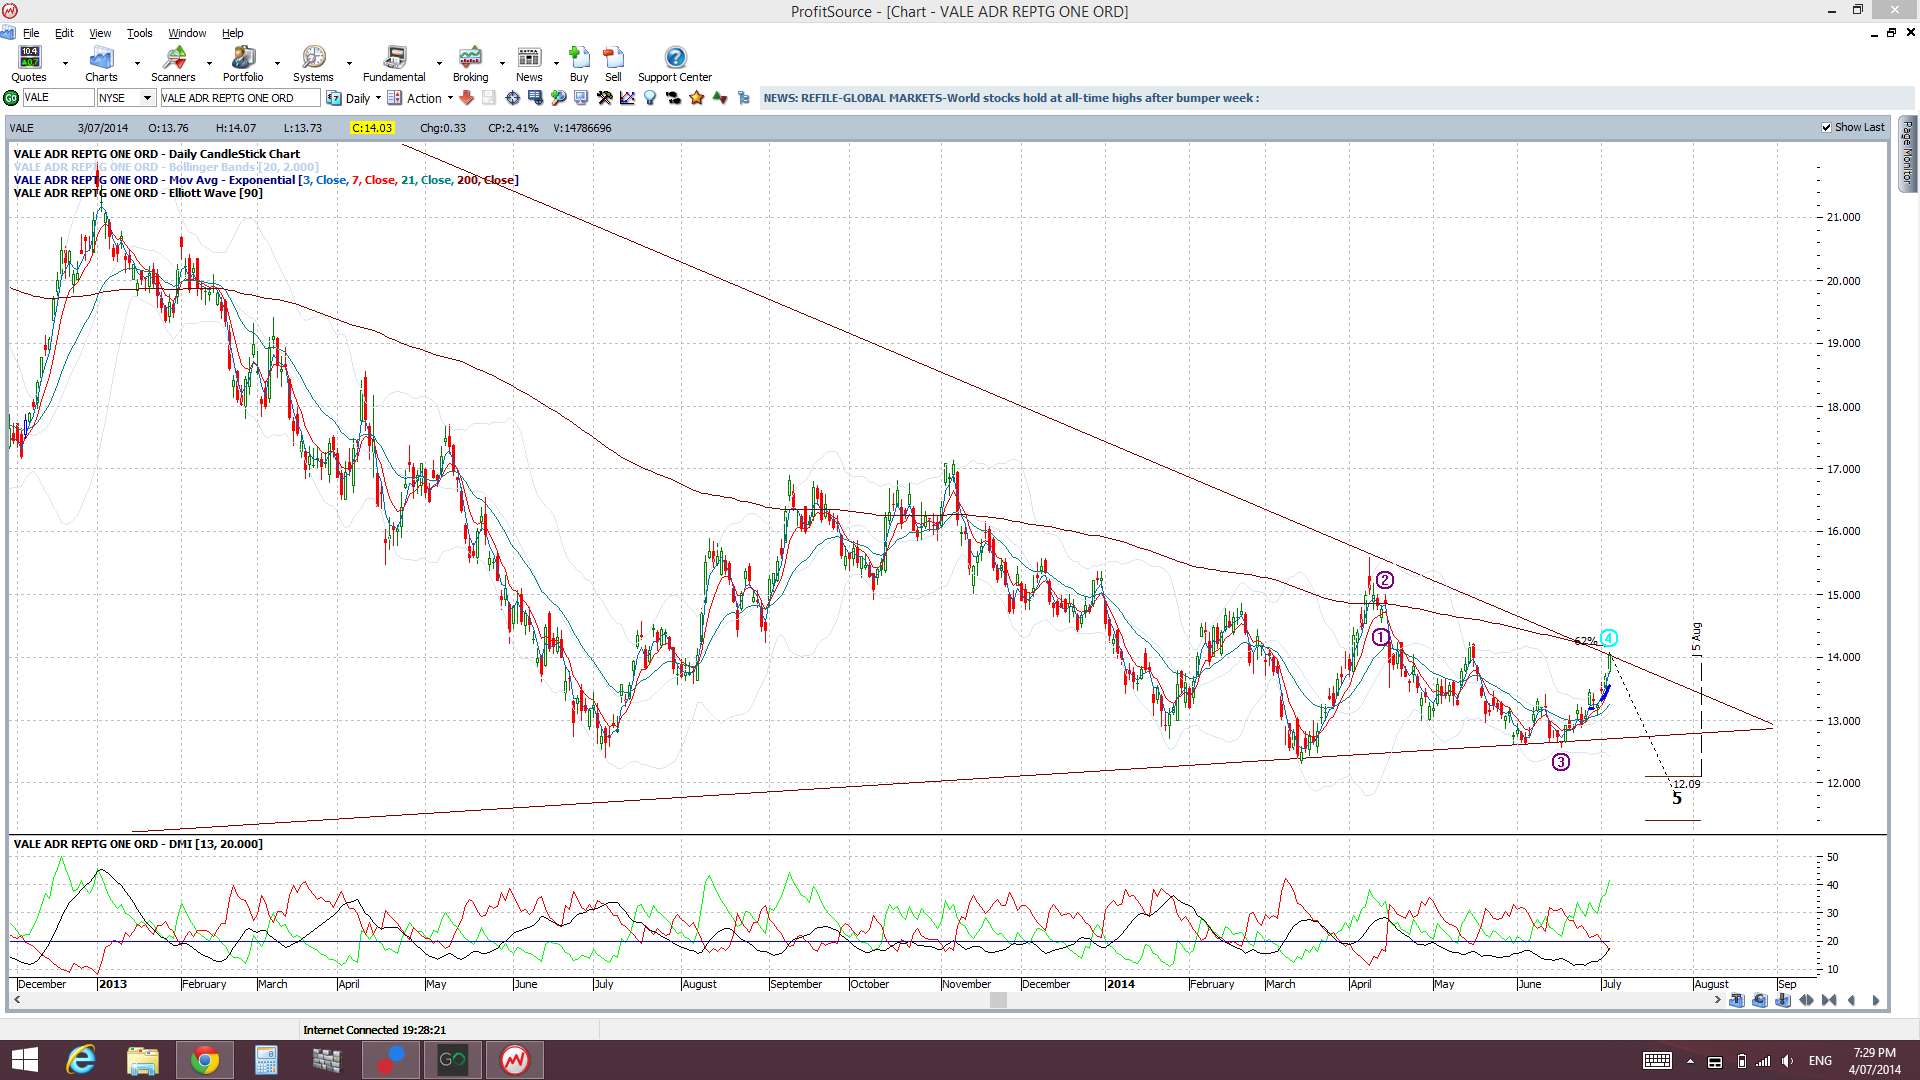
VALE: close to a triangle breakout:
X: US steel makes a ‘Bull Flag’ breakout:

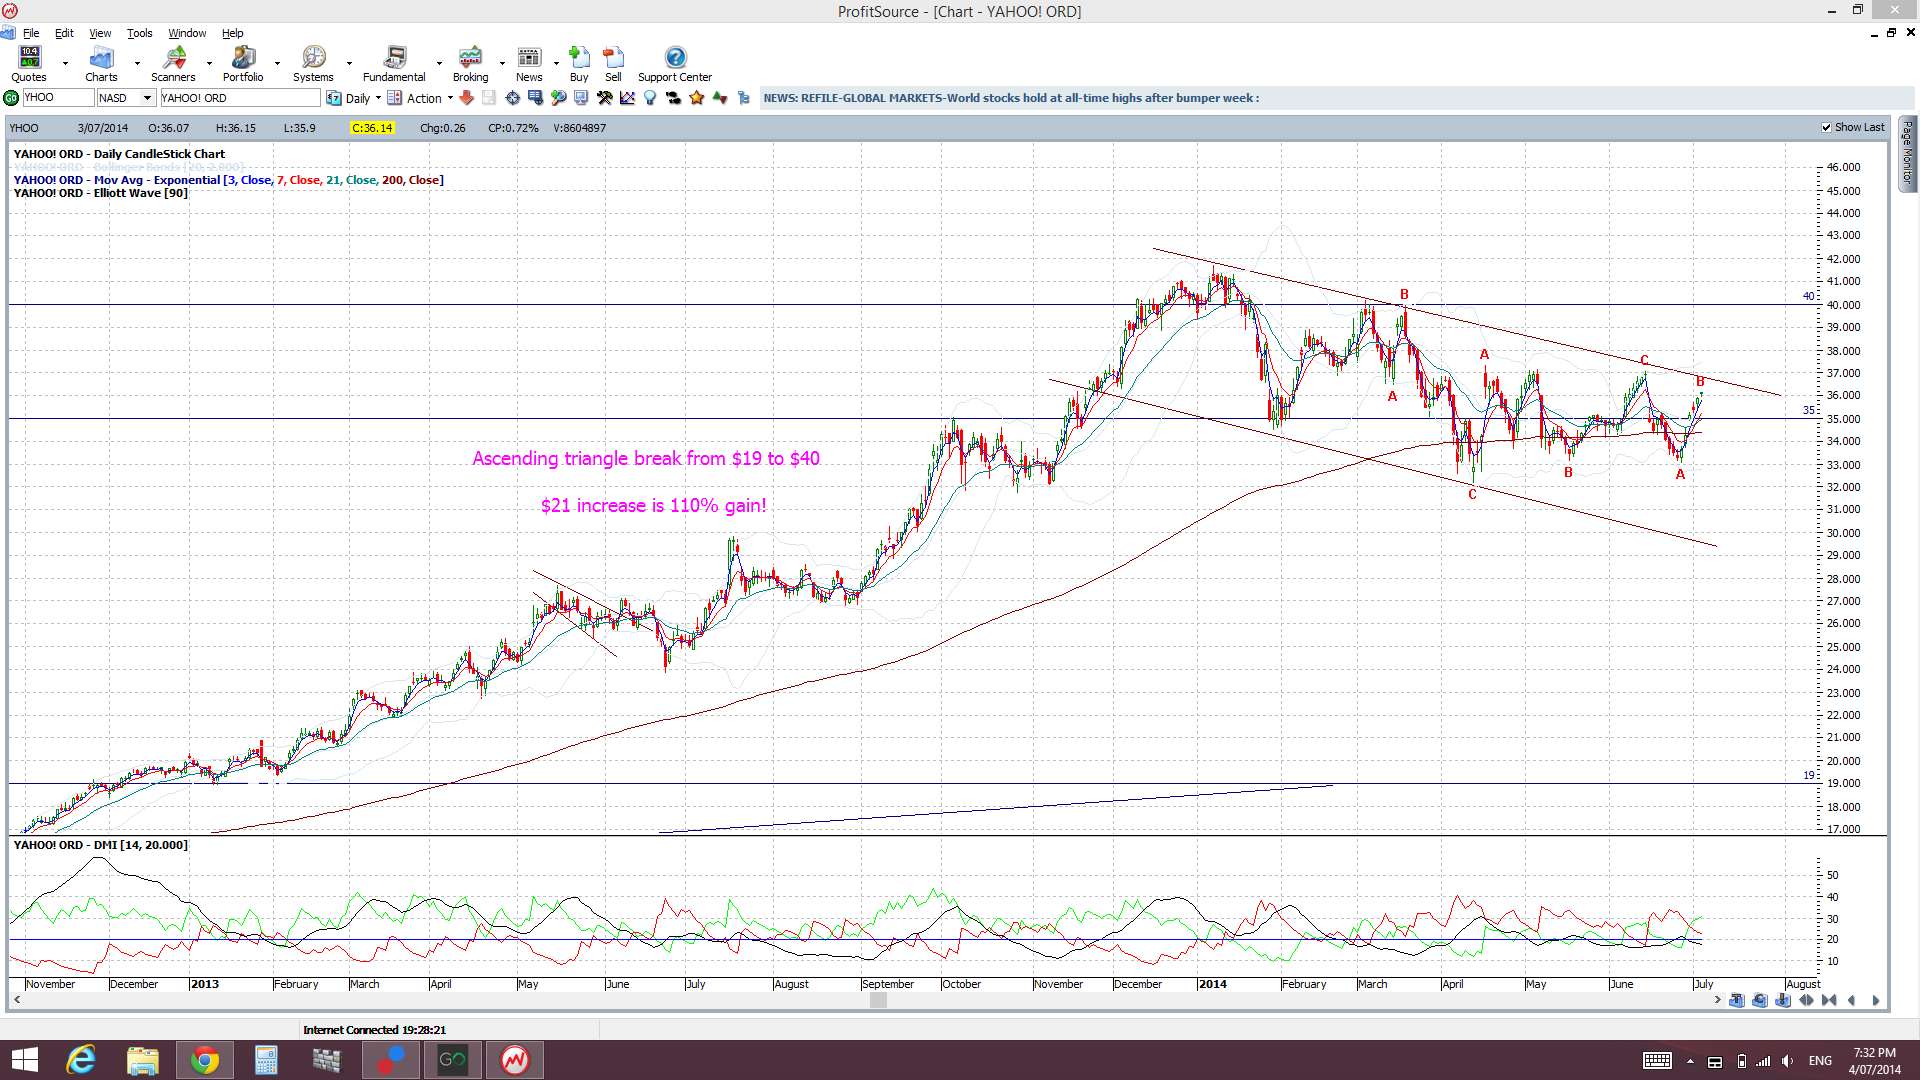
YHOO: watching for a ‘Bull Flag’ breakout:
Some Aussie Stocks in focus:
BHP: a triangle breakout building:

FMG: watching for any triangle breakout here:

LEI: looking for this to pick up if it can close above the 200 EMA:

NCM: this is starting to look interesting too:

RIO: this is looking close to a breakout too:

STO: watching the triangle here as well:

TOL: waiting for a close above the $6 level:

WPL: the continued hold above $40 is bullish:

AMP: has made a triangle breakout and I’m looking for continuation here:

Mary,
Your stalking skills are always Top Drawer!
Really nice to read your work, and thank you for sharing.
PS…….US Treasury supply in July will outstrip FED printing for the 1st time since the advent of this revision of QE which is something worth watching, I think.
Best regards
Hola MF!
Have been thinking of you and wondering where you had slipped off to. Haven’t spied you on FXLive either. Was going to e-mail you….spooky then to see this note from you.
Thanks for the kind feedback.
I have to admit that although I understand the significance of your comment, that is, it seems we may be at a significant economic inflection point, I think I need the finer nuances of this explained in more detail. I’m not blonde but I’m just not as conversant with the economics. Would you have time to explain this at all?
I’ve been thinking, and saying, for some time that I think a big market move is coming. Many trading ‘planets’ seem to be aligning towards supporting such an outcome and I’m wondering if your observation is yet another key contributing factor here?
Might all seem like ‘Alice in Wonderland’ stuff but…as the mantra goes……trade what you see.
Thanks again.
Mary