


When deciding on writing an article for my website I try to focus on areas where there is some interesting movement. One such space that has come to the fore over recent months is with that of Uranium and Uranium stocks. The change in price action for Uranium can likely be equated with the shift in supply and demand and a search, using your preferred internet browser, should help you determine reasons for this latest move. However, in this article my focus is not on the fundamental reasons for this change but, rather, on technical analysis of the recent price action of Uranium and of a number of Australian (ASX listed) Uranium stocks.
NB: Please note that all of the charts in this article are monthly charts and so any key levels noted as worth monitoring should be assessed at the end of a calendar month.
URANIUM
The price of Uranium peaked back in late 2007 and had chopped lower in overall decline until last year, as can be seen on the monthly Uranium chart shown in Figure 1. Note how in March 2021 the price of Uranium broke up through a 14-year bear trend line, in place from 2007 through to 2021, and has been rising rather aggressively since then. The price of Uranium rose back above $50 in September 2021, for the first time since mid 2012, and has since been rising steadily.
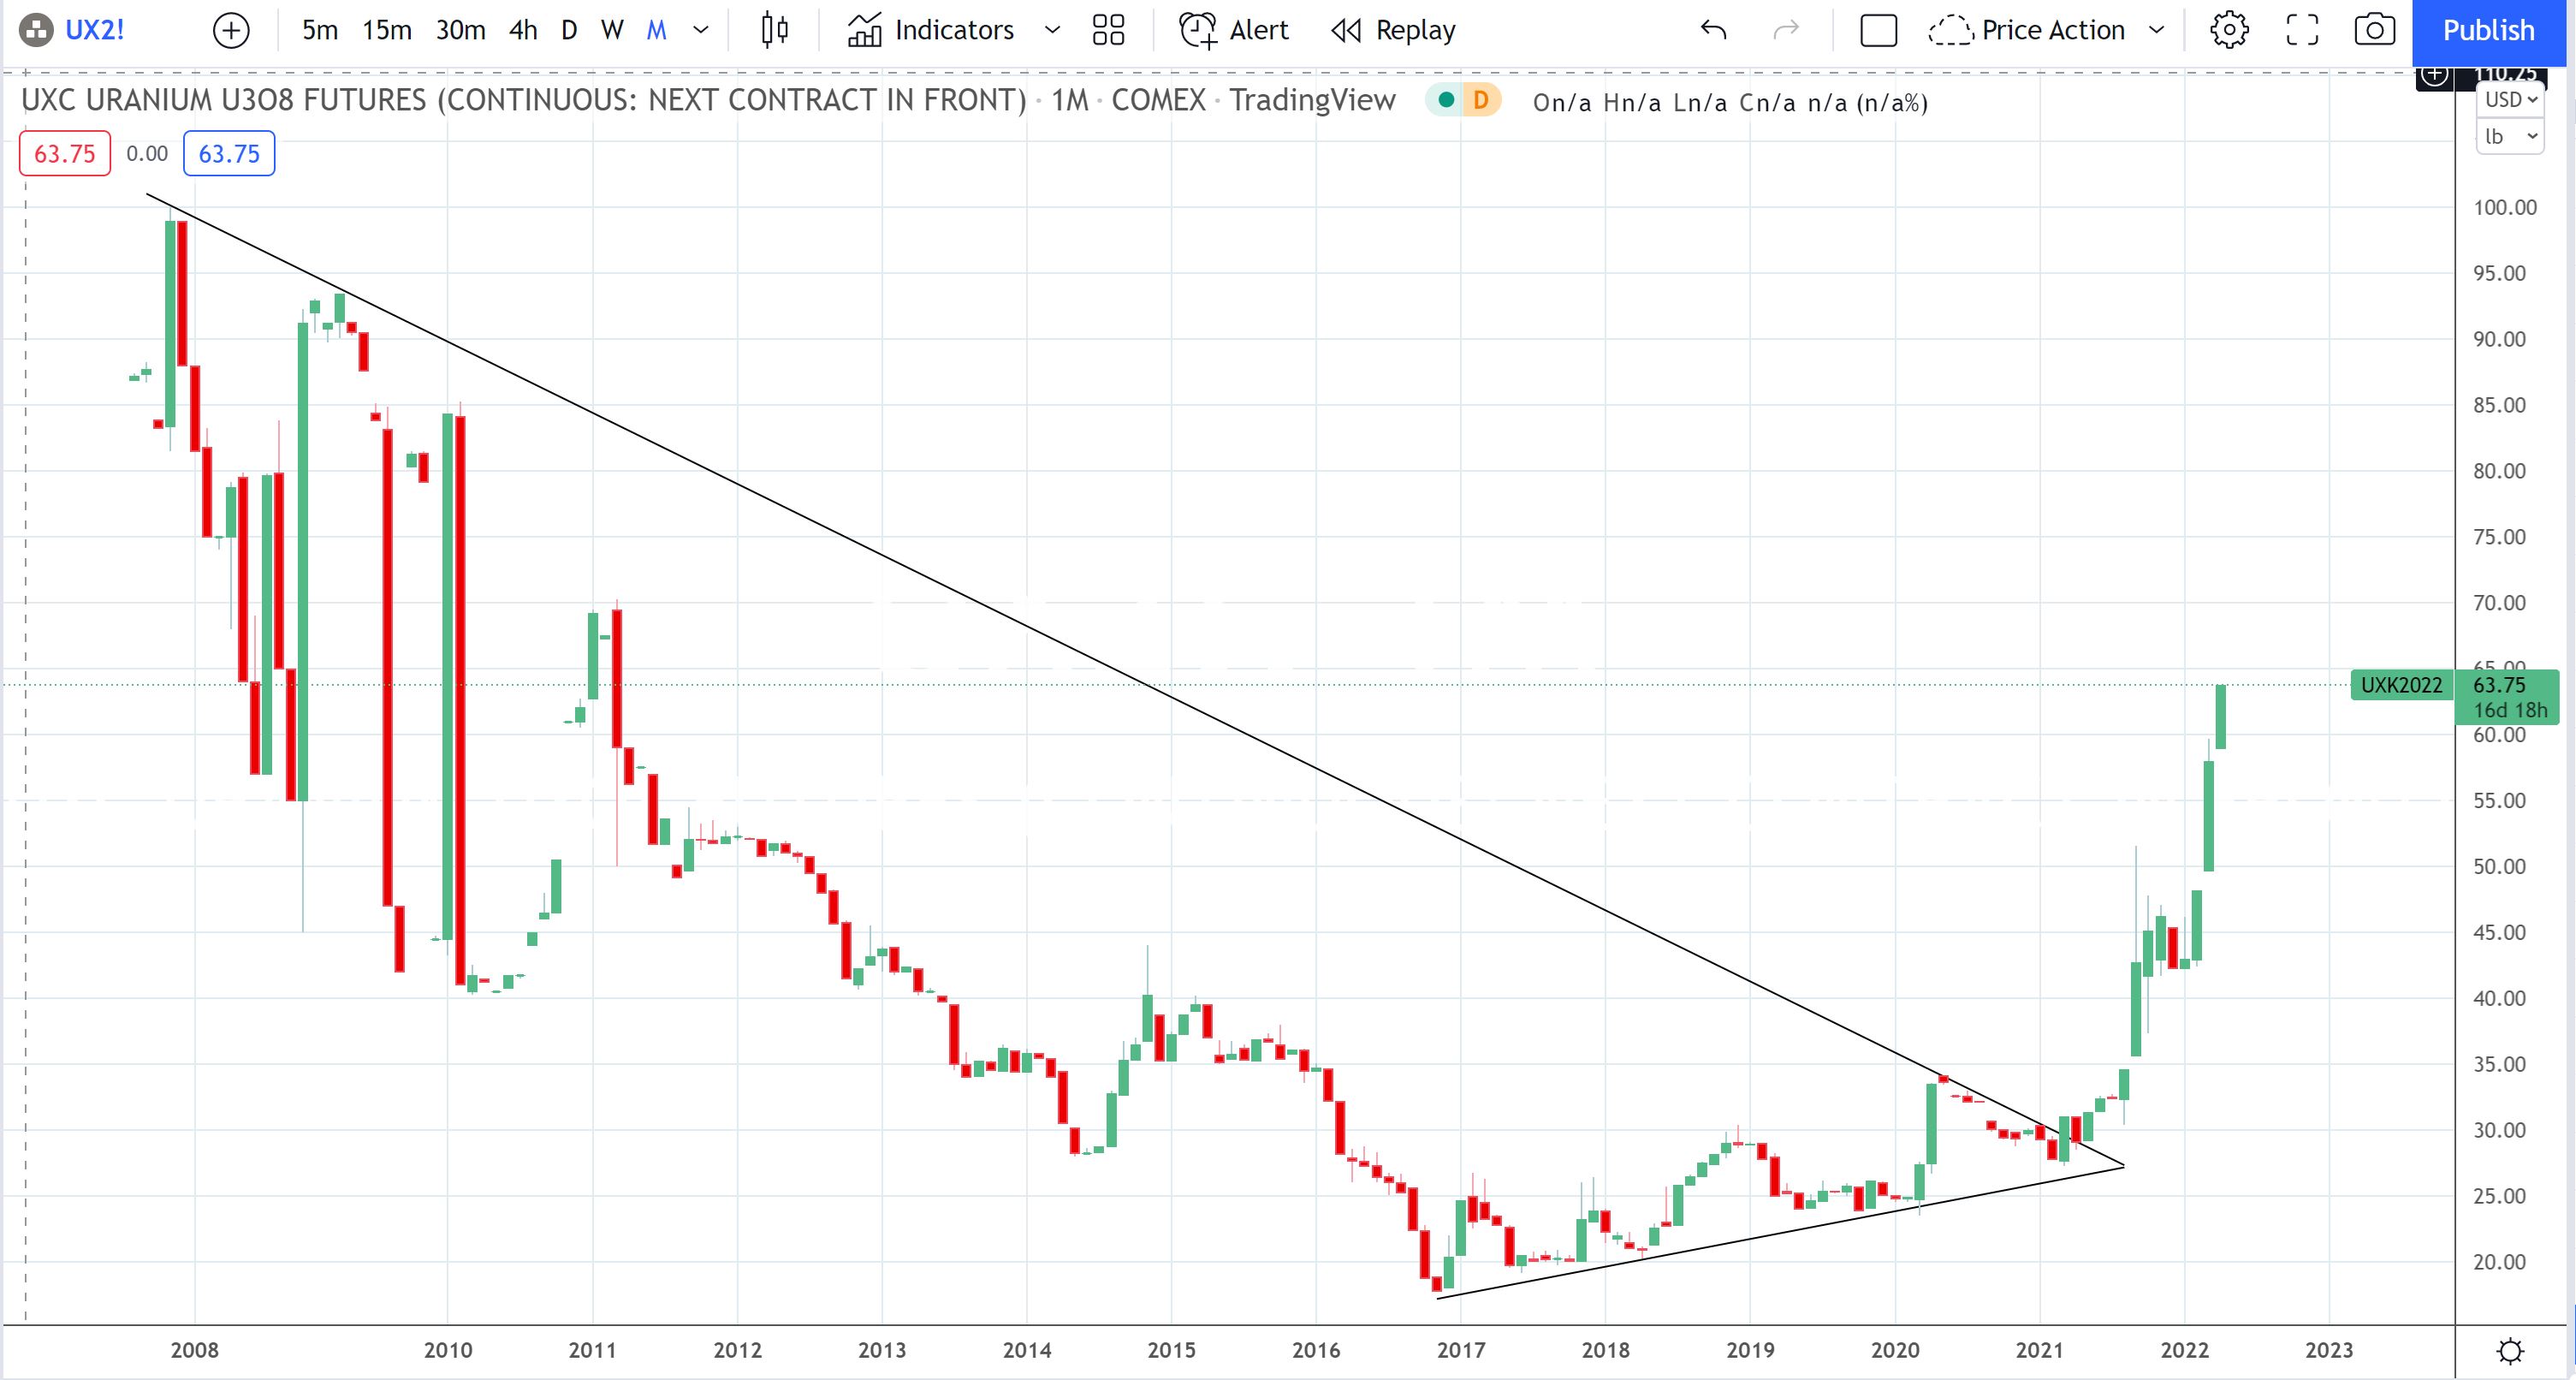
Figure 1: Uranium monthly
The chart in Figure 2 reveals how the $70 level looks to be a region where Uranium price has reacted before and this also happens to align near the popular 61.8% Fibonacci retracement. This $70 level would be one worth monitoring as this whole-number level and Fibonacci region could evolve into a technical trigger for a potential pause with this rally.
It is this recent and aggressive recovery in the price of Uranium that motivated me to explore the charts of Uranium-related ASX listed stocks and the ones with most interesting price action have made it in to this article.
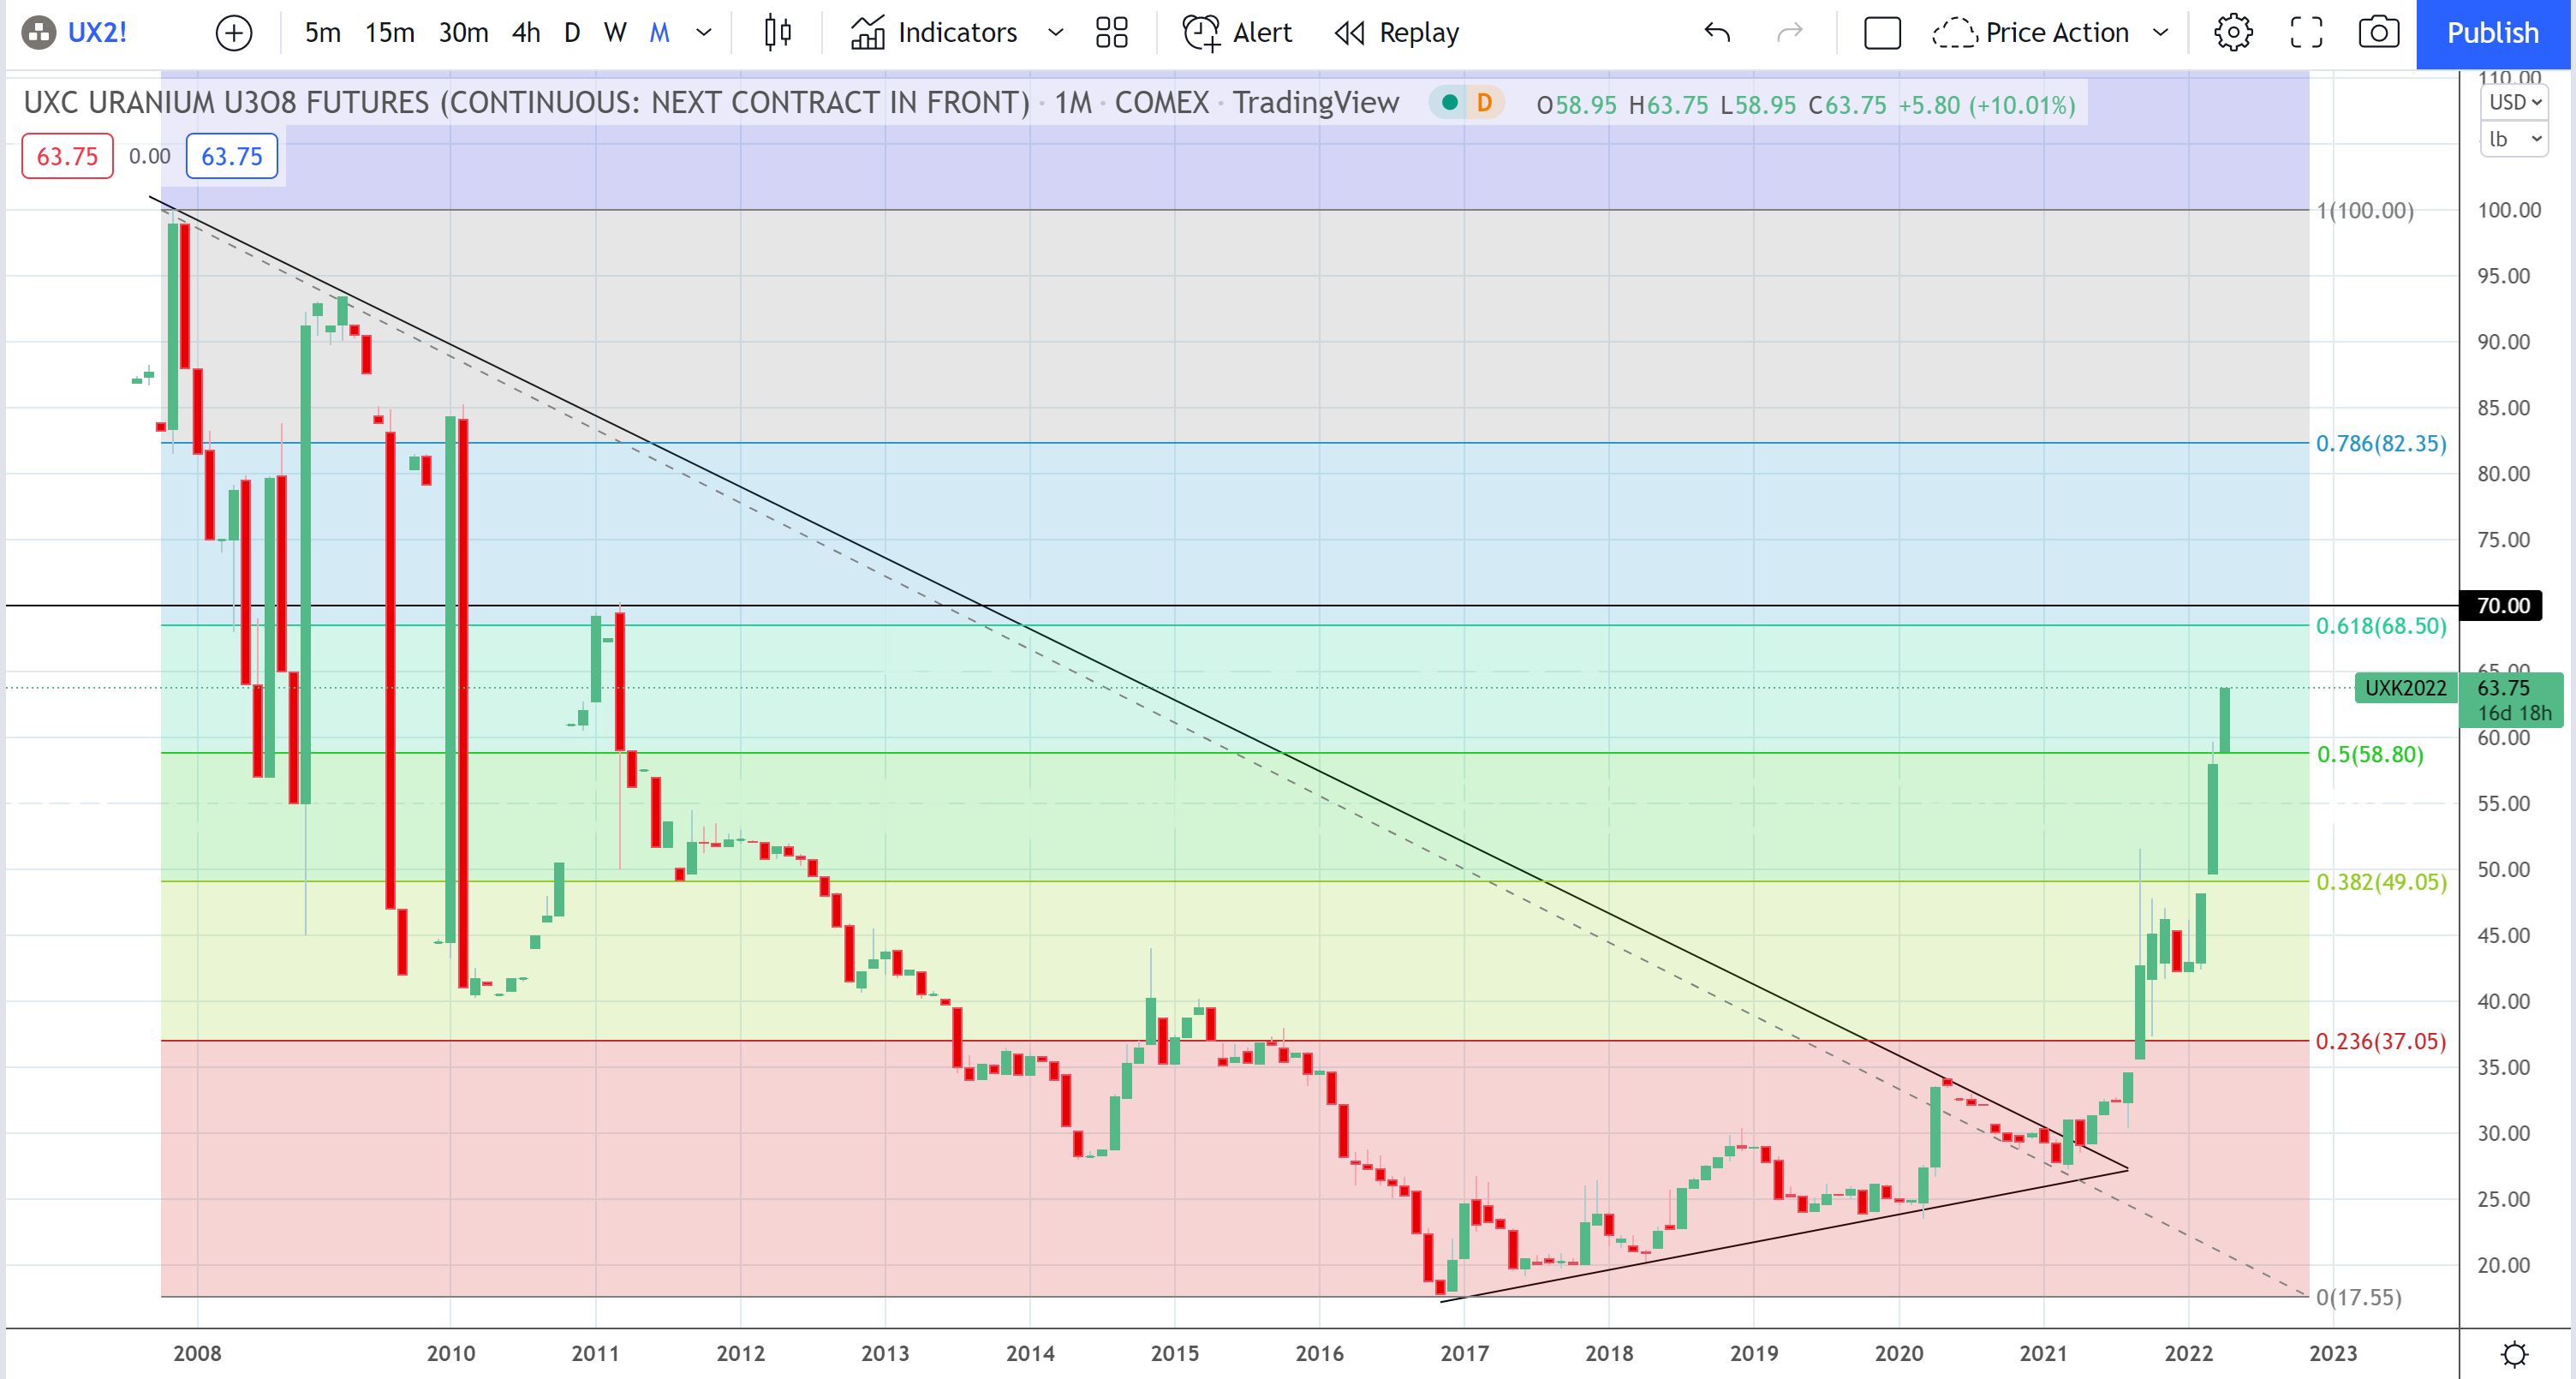
Figure 2: Uranium monthly + Fibonacci
URA: Global Uranium ETF
One popular ETF that can be used to track Uranium is that of the Global X Uranium ETF: URA. The chart in Figure 3 shows a decline in the price of URA from 2011 that is similar to that shown in the earlier charts of Uranium (see Figures 1 and 2). However, the recovery in price for URA has not been as dramatic or substantial as that of the spot metal. Note how URA price is hovering under the $30 level and note, also, how the $40 looks to be a region of historical resistance as well. These are clearly two resistance levels worth monitoring in the coming months.
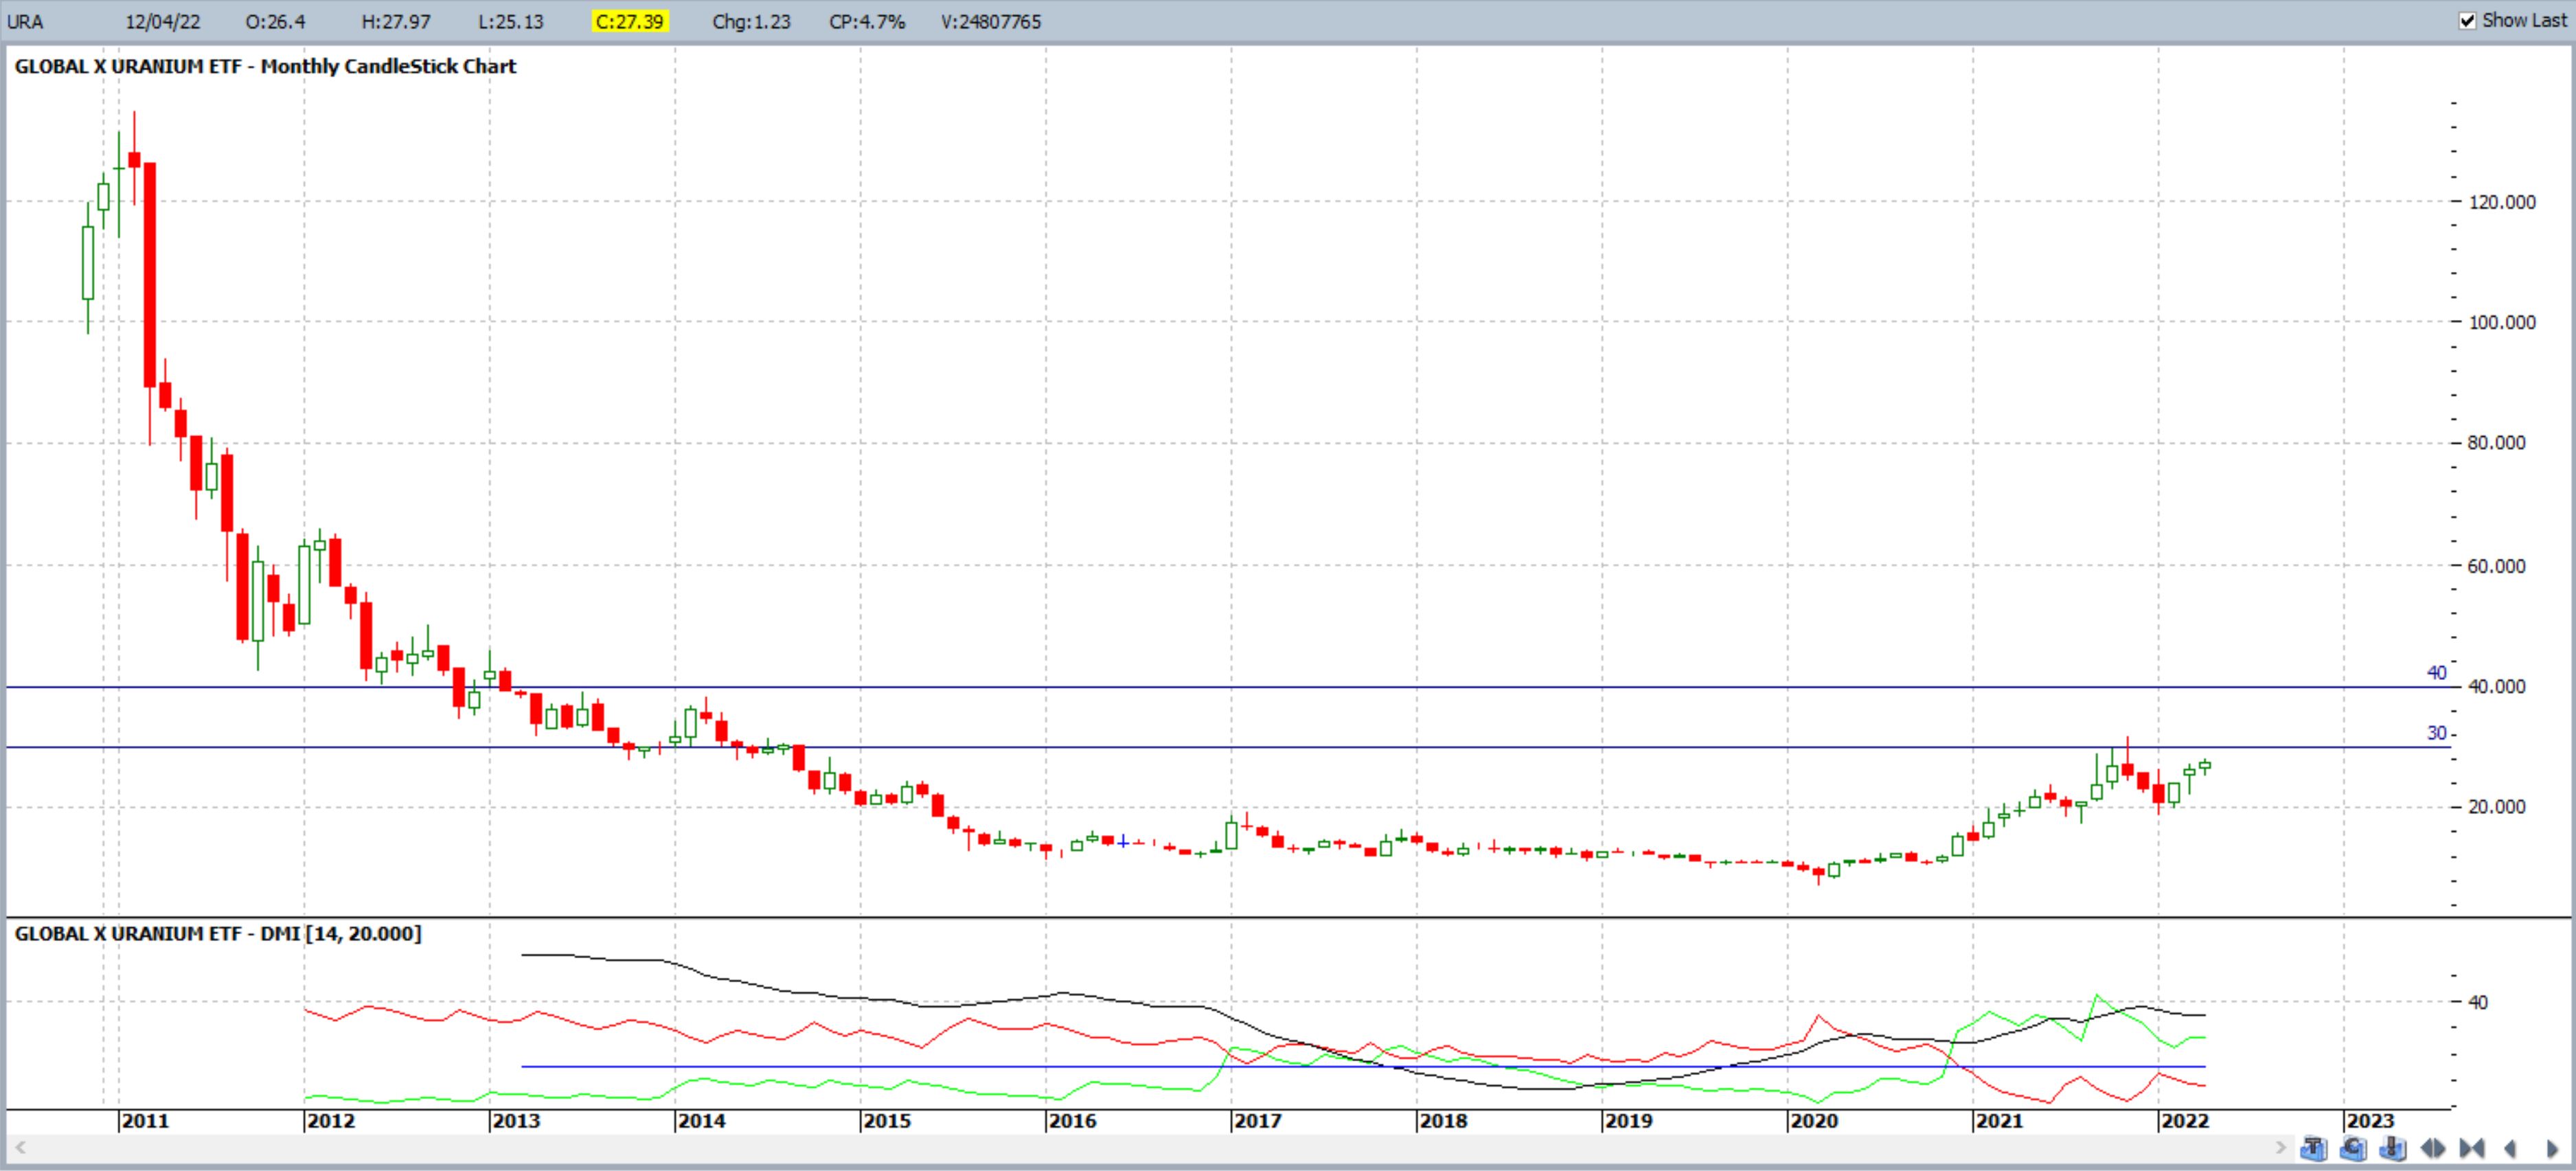
Figure 3: URA monthly
The chart in Figure 4 shows the monthly chart of ERA but with the addition of a Fibonacci retracement. The popular 61.8% region lies up near $85 and this would become an area of interest if price action broke up through $30 and $40 and continued higher.
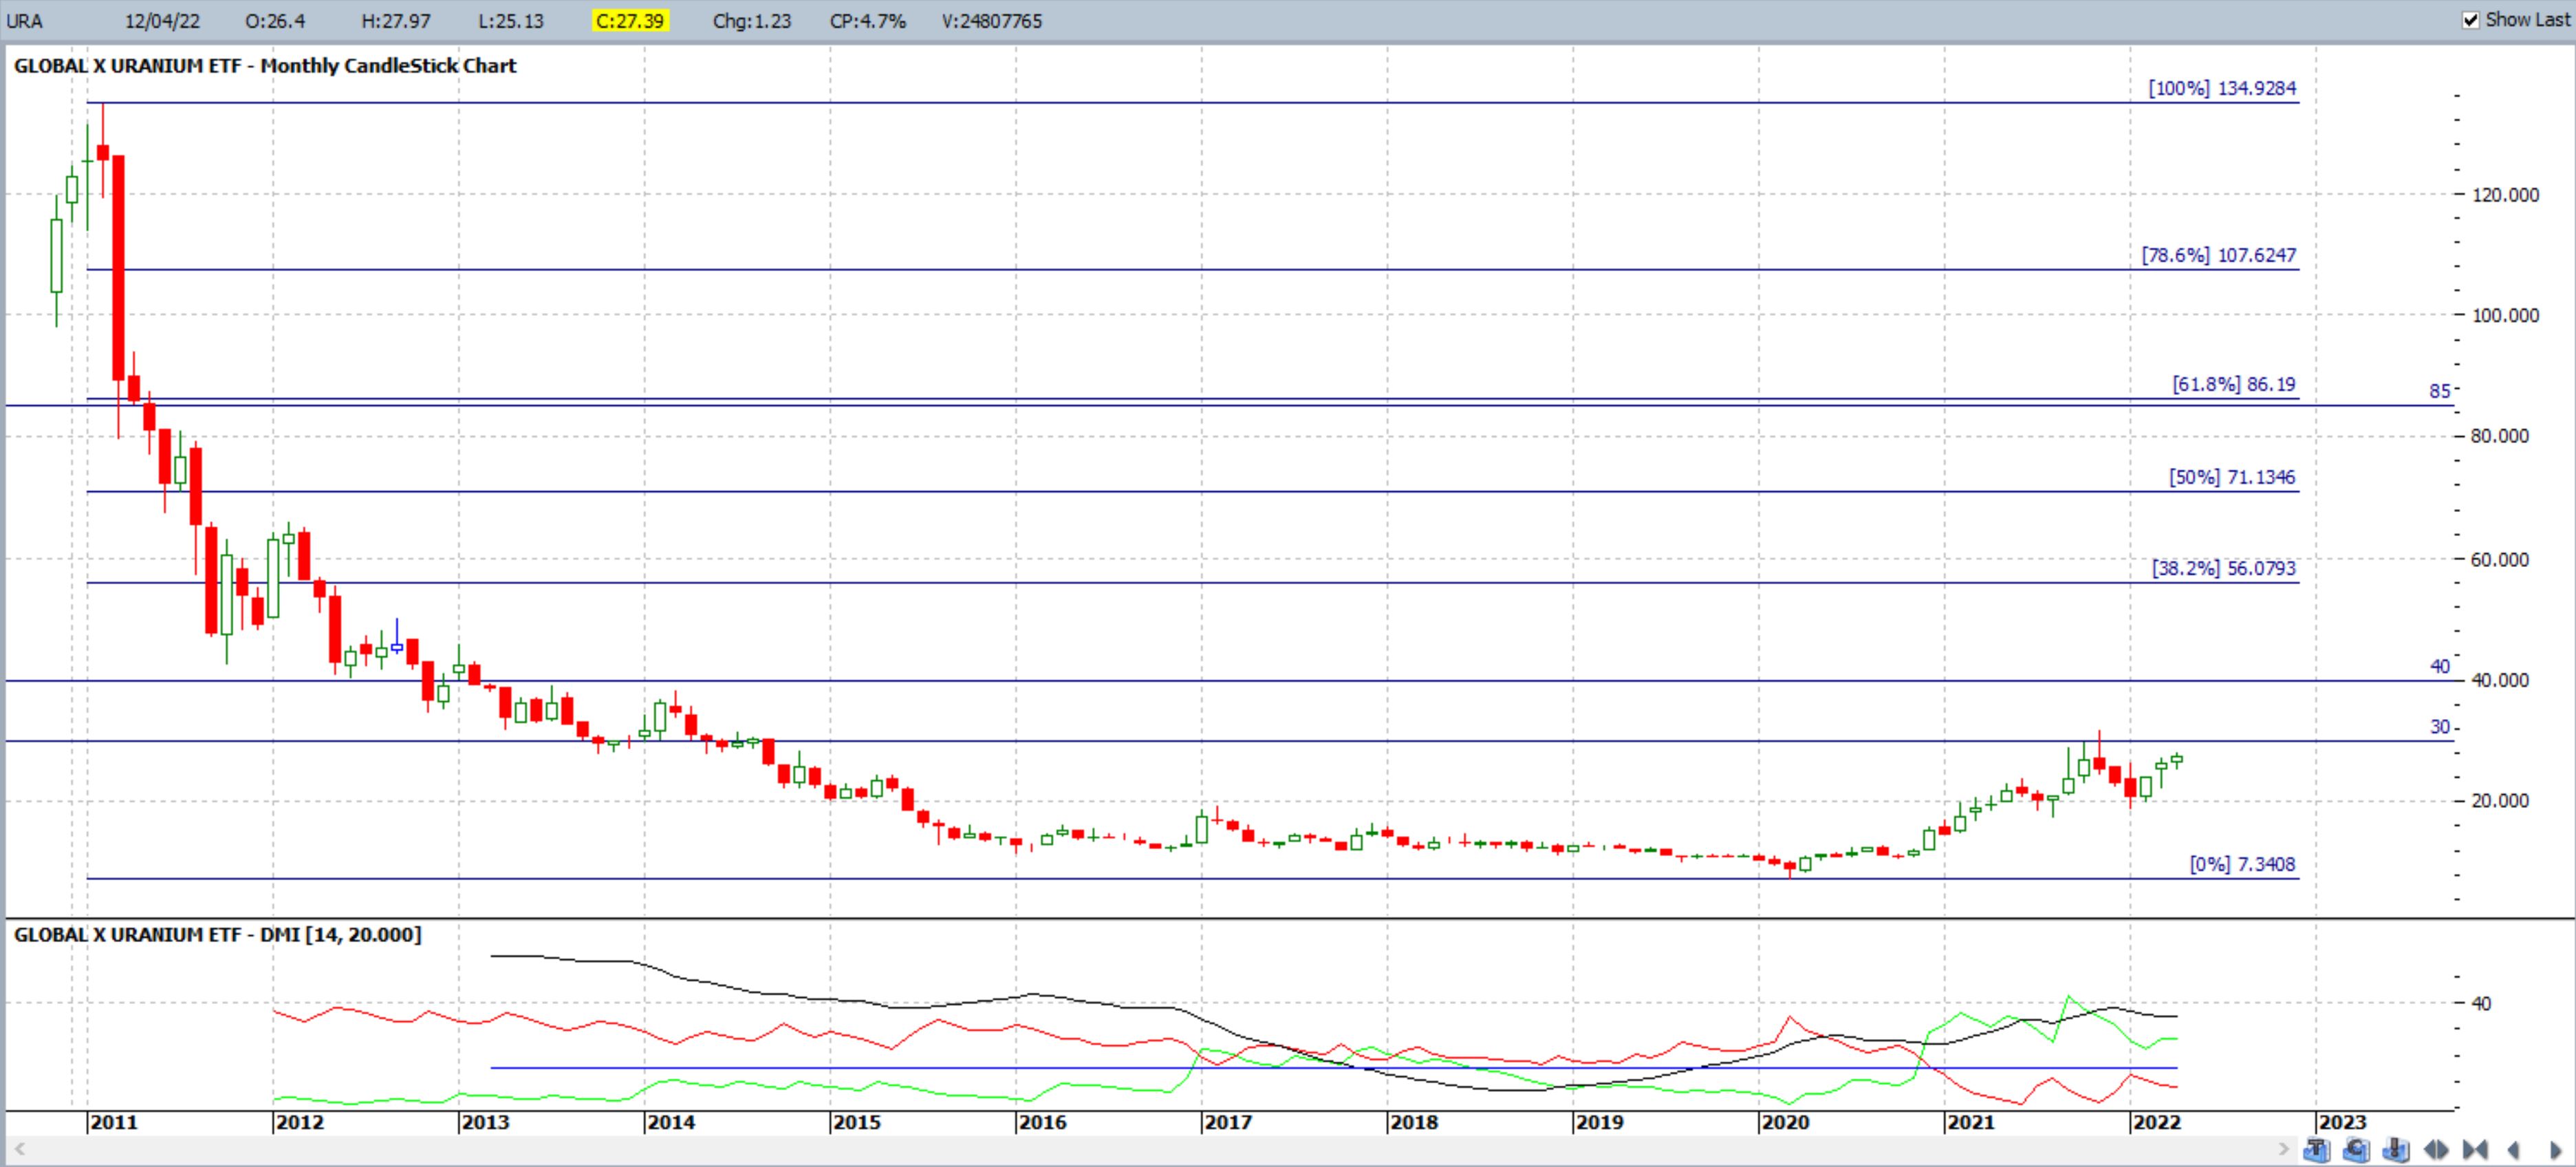
Figure 4: URA monthly + Fibonacci
Australian Uranium Stocks
I used the resource of Market Index to help me rank some Aussie Uranium stocks and I filtered stock candidates by Price, % Growth and Market Capitalization to help narrow down to a shorter list to review for this article. The chart available on the Market Index website is interactive and easily allows the user to change the ranking according to your particular interest. The Australian Uranium stocks charted in this article are the ones that jumped out at me due to their interesting price action.
SLX: Silex Systems
The monthly chart of SLX is shown in Figure 5 and note how the price action closely aligns to the overall trajectory of spot Uranium that was shown in Figure 1 & 2. The $2 level is a long term reaction zone and seems to be acting as the current resistance level to beat.
Note how the popular 61.8% Fibonacci retracement level is up near the $8 region and how this was also a reaction zone of some merit from back in 2007 – 2009. Any momentum-based break and hold above the $2 level would bring this $8 region into greater focus if bullish momentum is sustained.
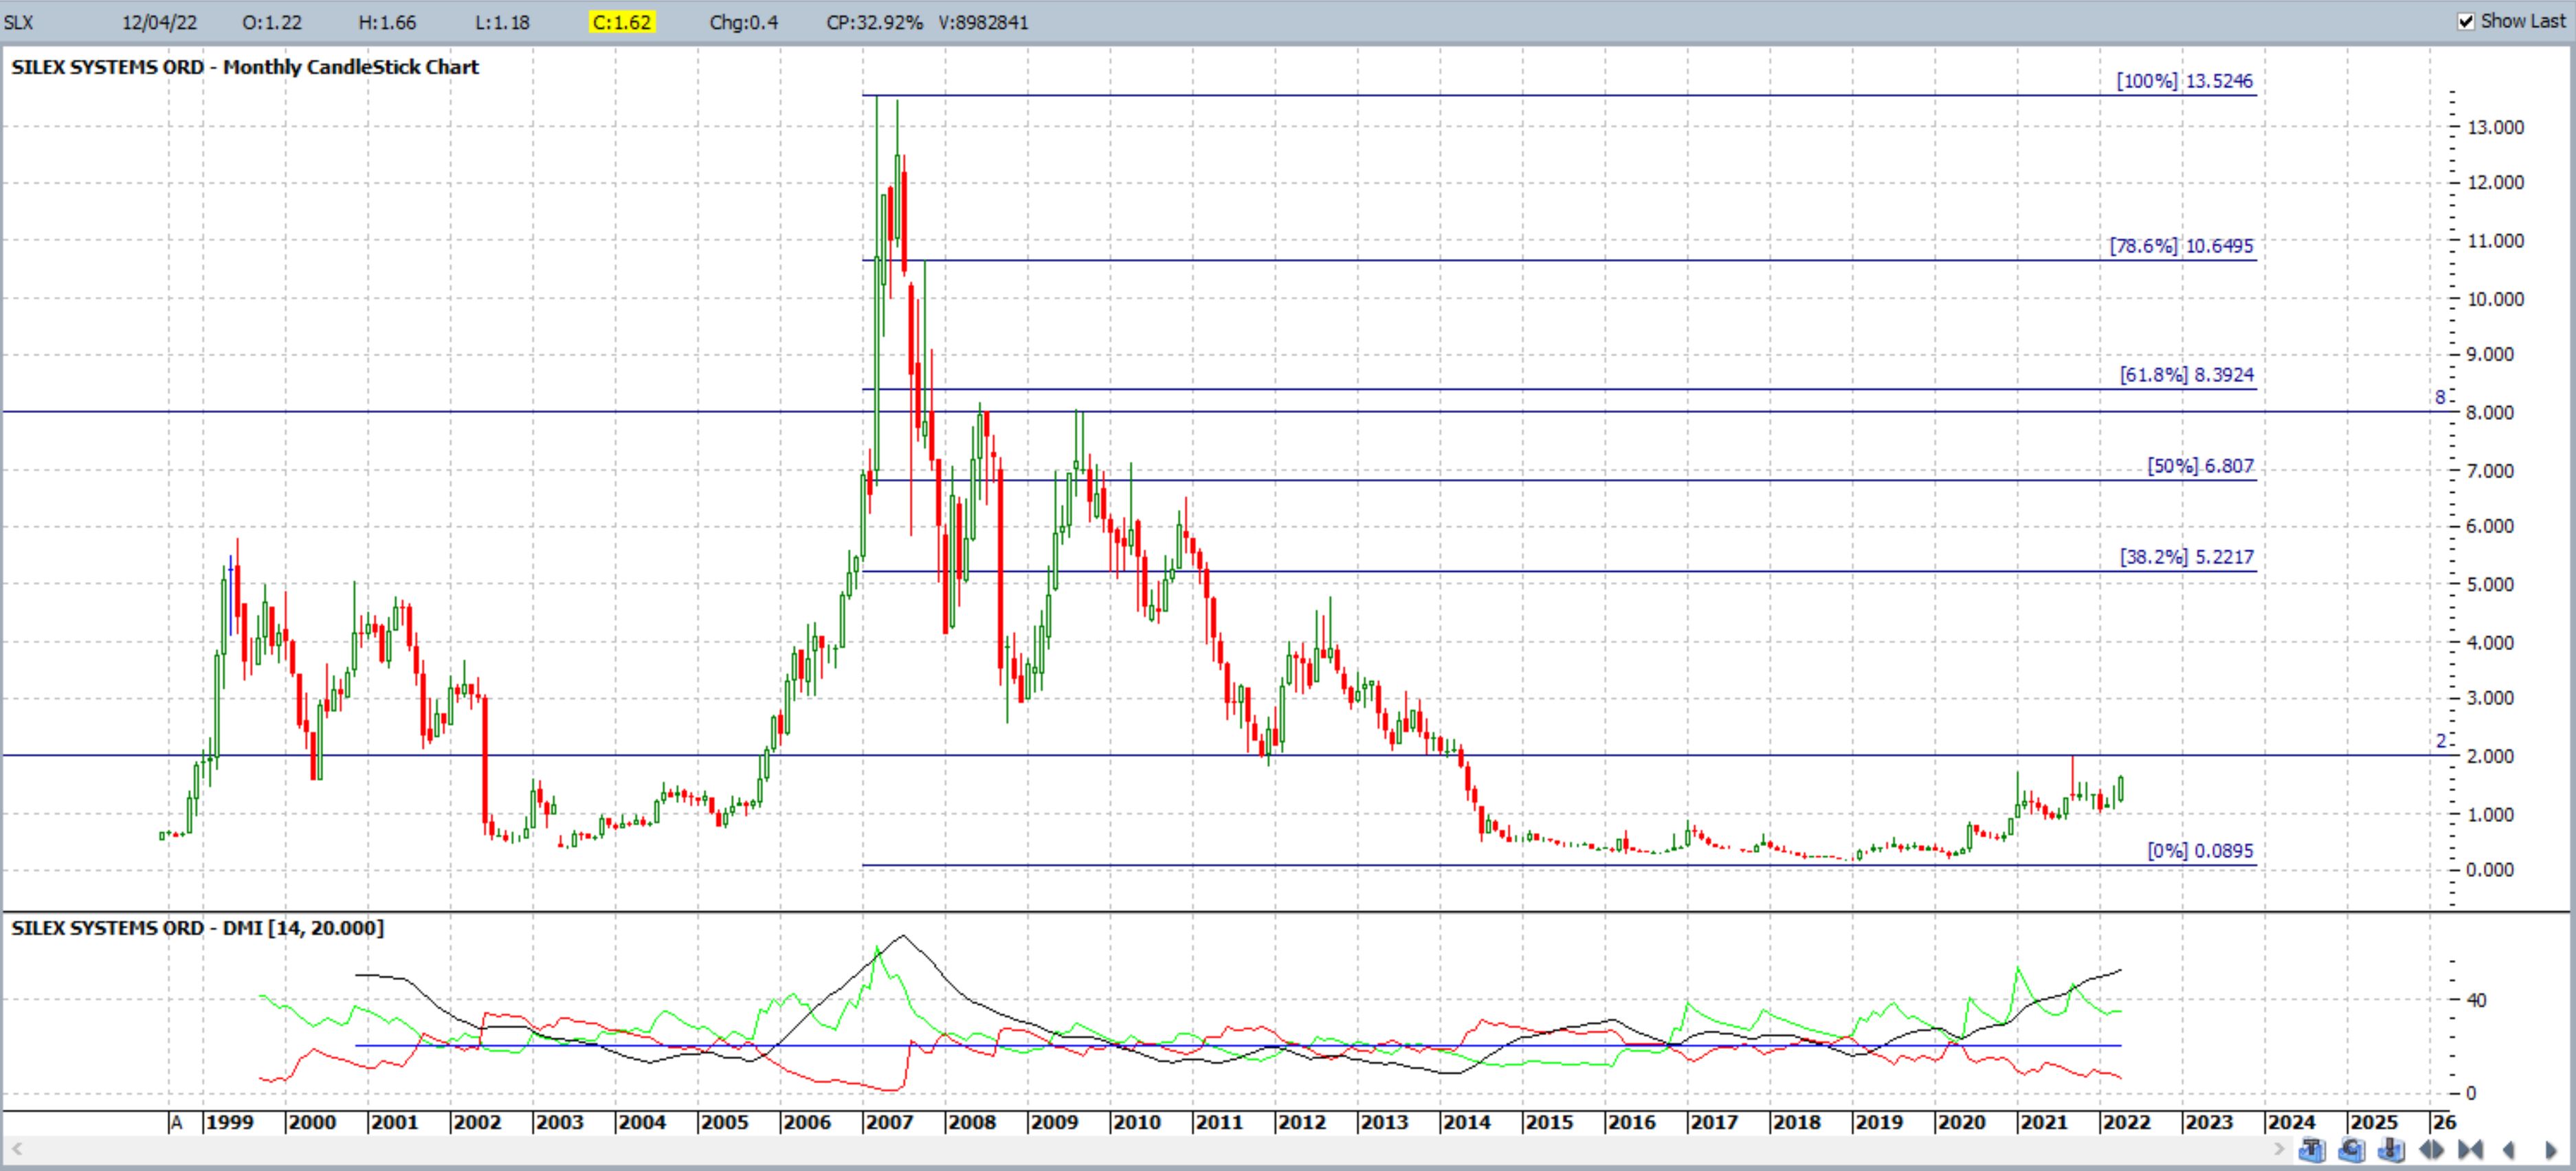
Figure 5: SLX monthly
ERA: Energy Resources of Australia Ltd
ERA is another Uranium stock where the price trajectory has closely aligned with that of the spot metal. The chart in Figure 5 shows that the ERA price is holding well below $1 for now but this can be seen to be a significant reaction zone for the stock during 1998 – 2003 and 2011 – 2015.
Note how the popular 61.8% Fibonacci retracement level is up near the $8.50 region and how this was also a reaction zone of some merit back in 2005 – 2010. Any momentum-based break and hold above the $1 level would bring this $8.50 region into greater focus if bullish momentum is sustained.
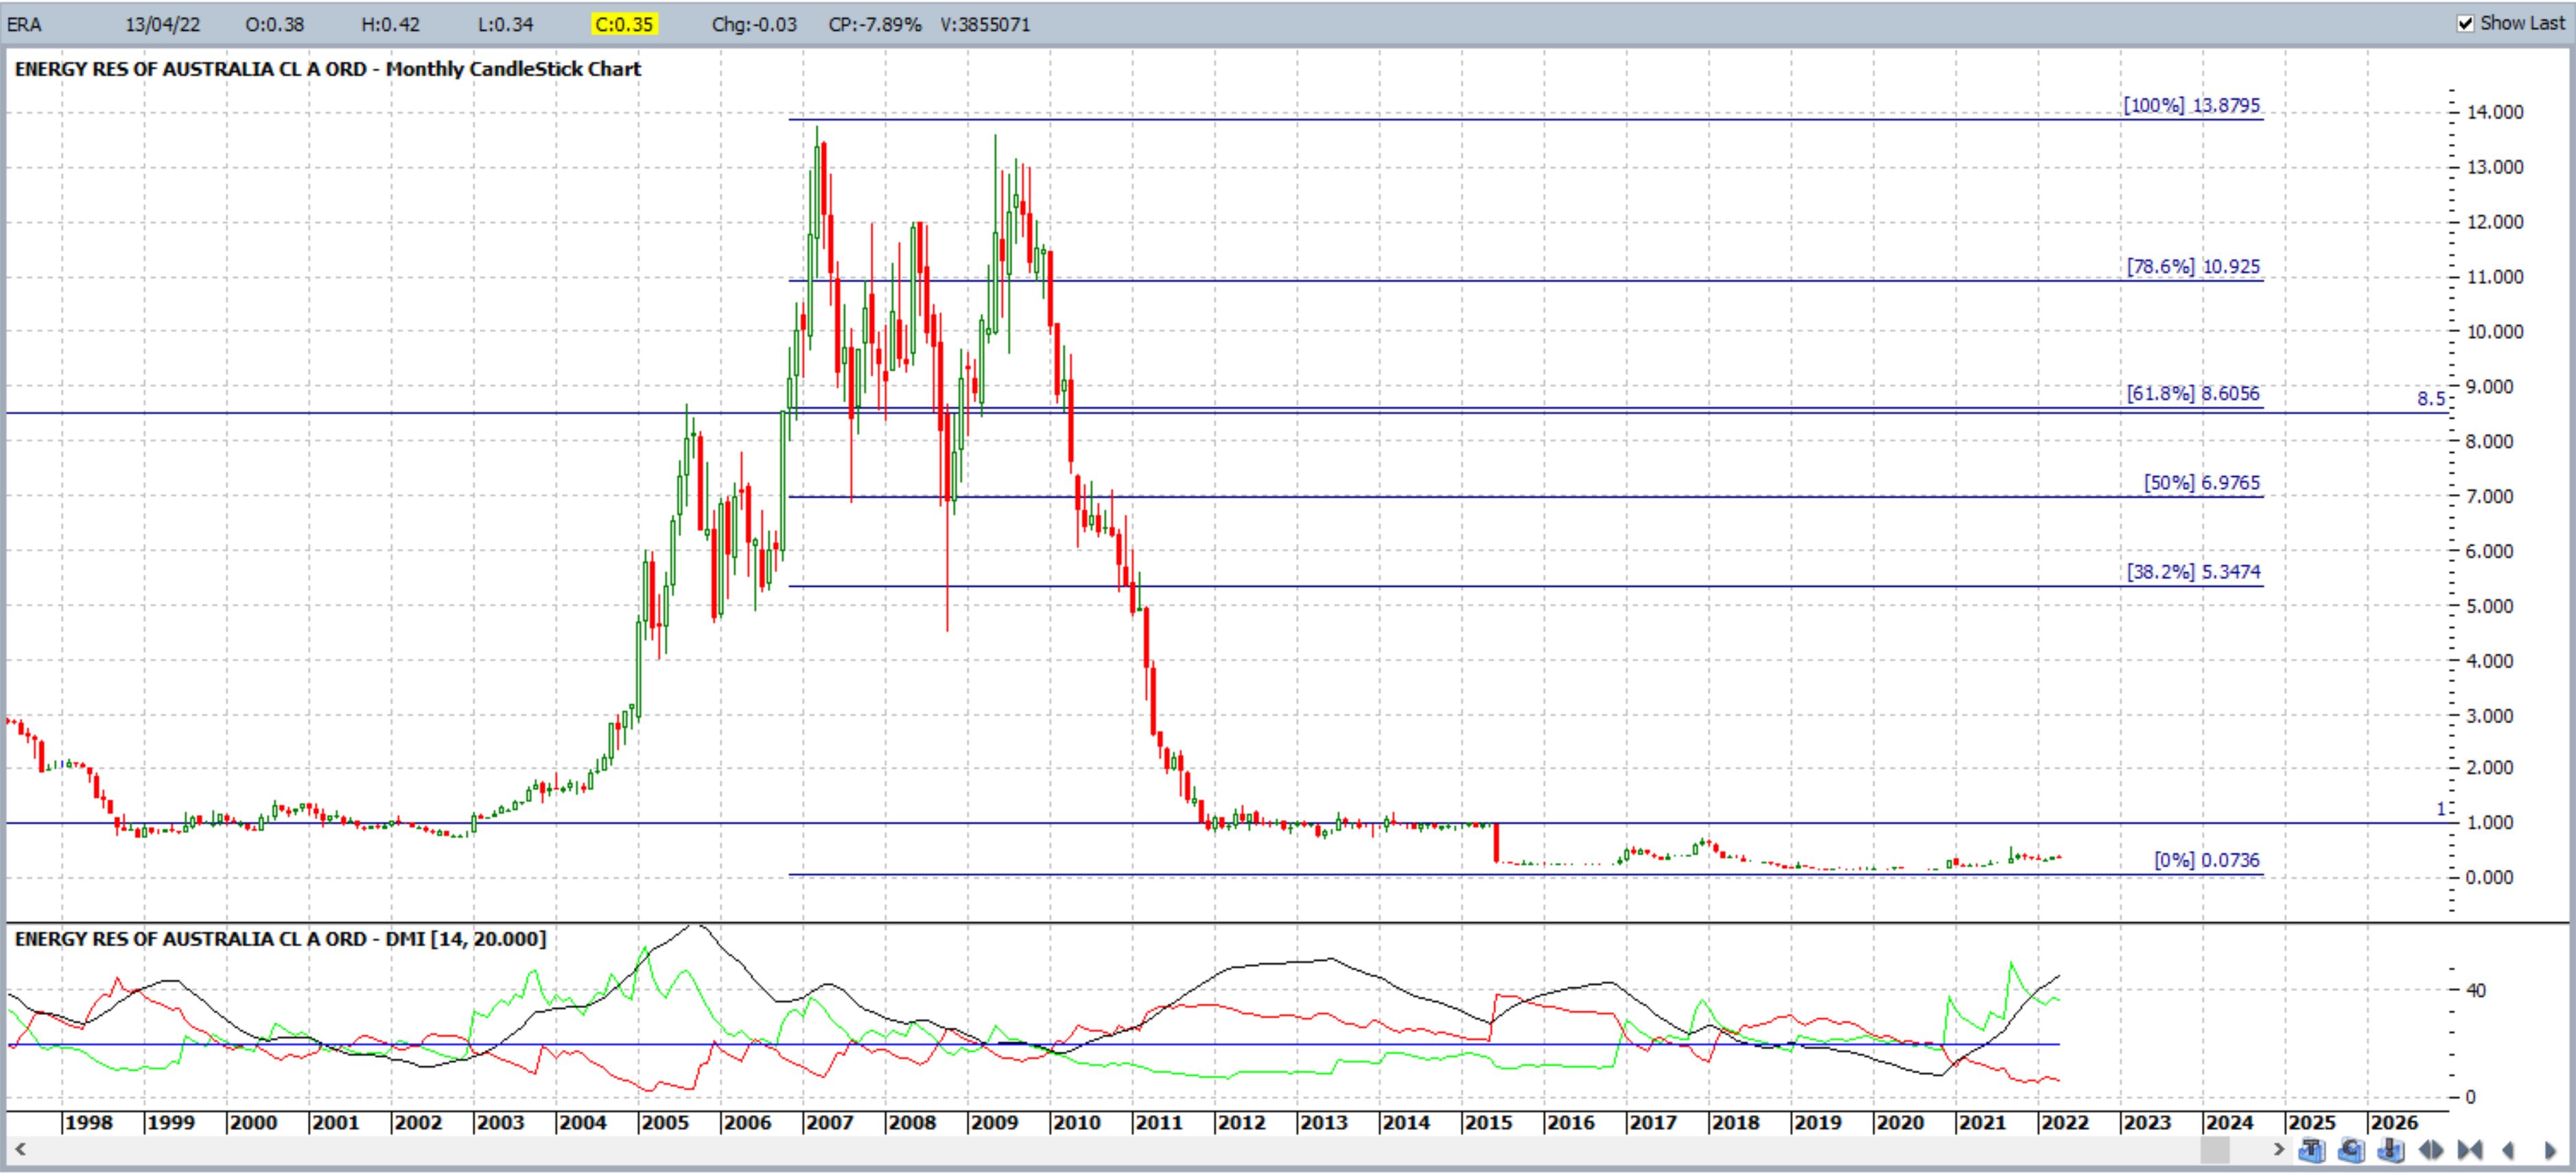
Figure 6: ERA monthly
BMN: Bannerman Energy
BMN is another Uranium stock where the price trajectory has closely aligned with that of the spot metal. The chart in Figure 6 shows that the BMN price is holding below $0.50 and this can be seen to be a decent reaction zone for the stock during the periods of 2006, 2008, 2010-2011, 2021 and now in 2022.
Note how the popular 61.8% Fibonacci retracement level is up near the $2.50 region which was also a reaction zone of some merit back in 2007 and 2008. Any momentum-based break and hold above the $0.50 level would bring this $2.50 region into greater focus if bullish momentum is sustained.
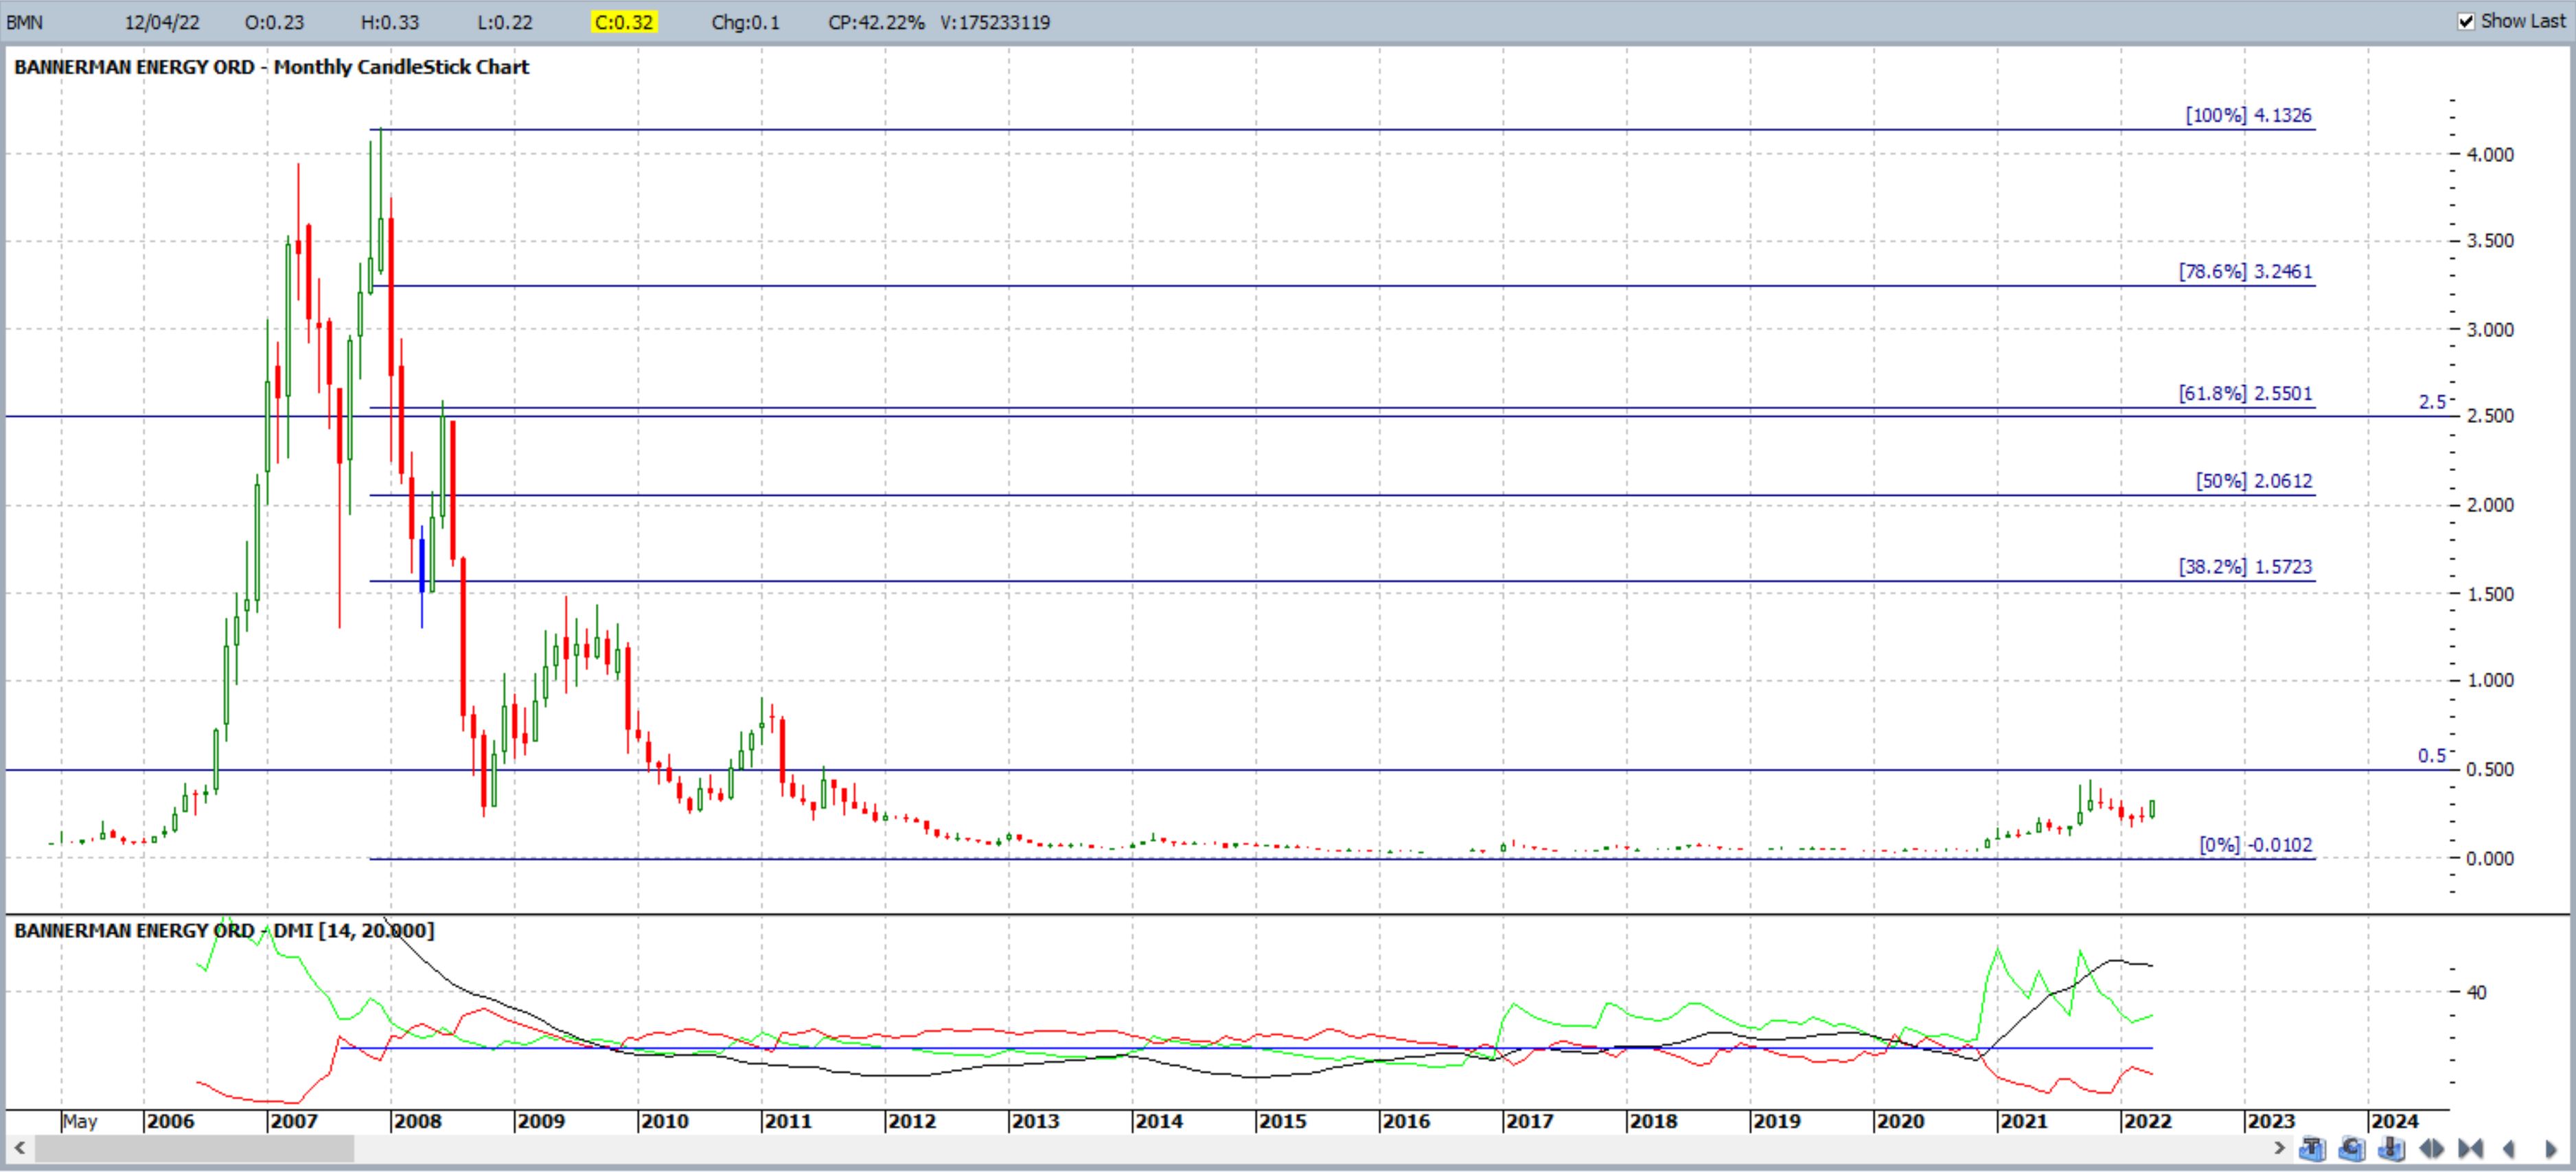
Figure 6: BMN monthly
BOE: Boss Energy
The chart of BOE shown in Figure 7 is rather different from other the Aussie Uranium charts shown above. Price action shows a 2007 peak followed by a decline but the recovery for BOE is almost back to the 100% retracement level, circa $3.50, and this is giving the chart the look of a bullish continuation ‘Cup’ pattern. I have more information and examples about this type of technical chart pattern on my website but, in short, the theory with these Cup patterns is as follows: any break and hold above the upper threshold or neck line level, in this case $3.50, may result in an upwards extension that is similar to the height of the Cup, in this case an extension move of about $3. This would give a bullish breakout target of $6.50 ($3.50 + $3).
Price action is currently hovering under the $3 level but it may well be worth watching for any break and hold above $3.50. Any break and hold above $3.50 would then bring $6.50 into greater focus if bullish momentum is maintained.
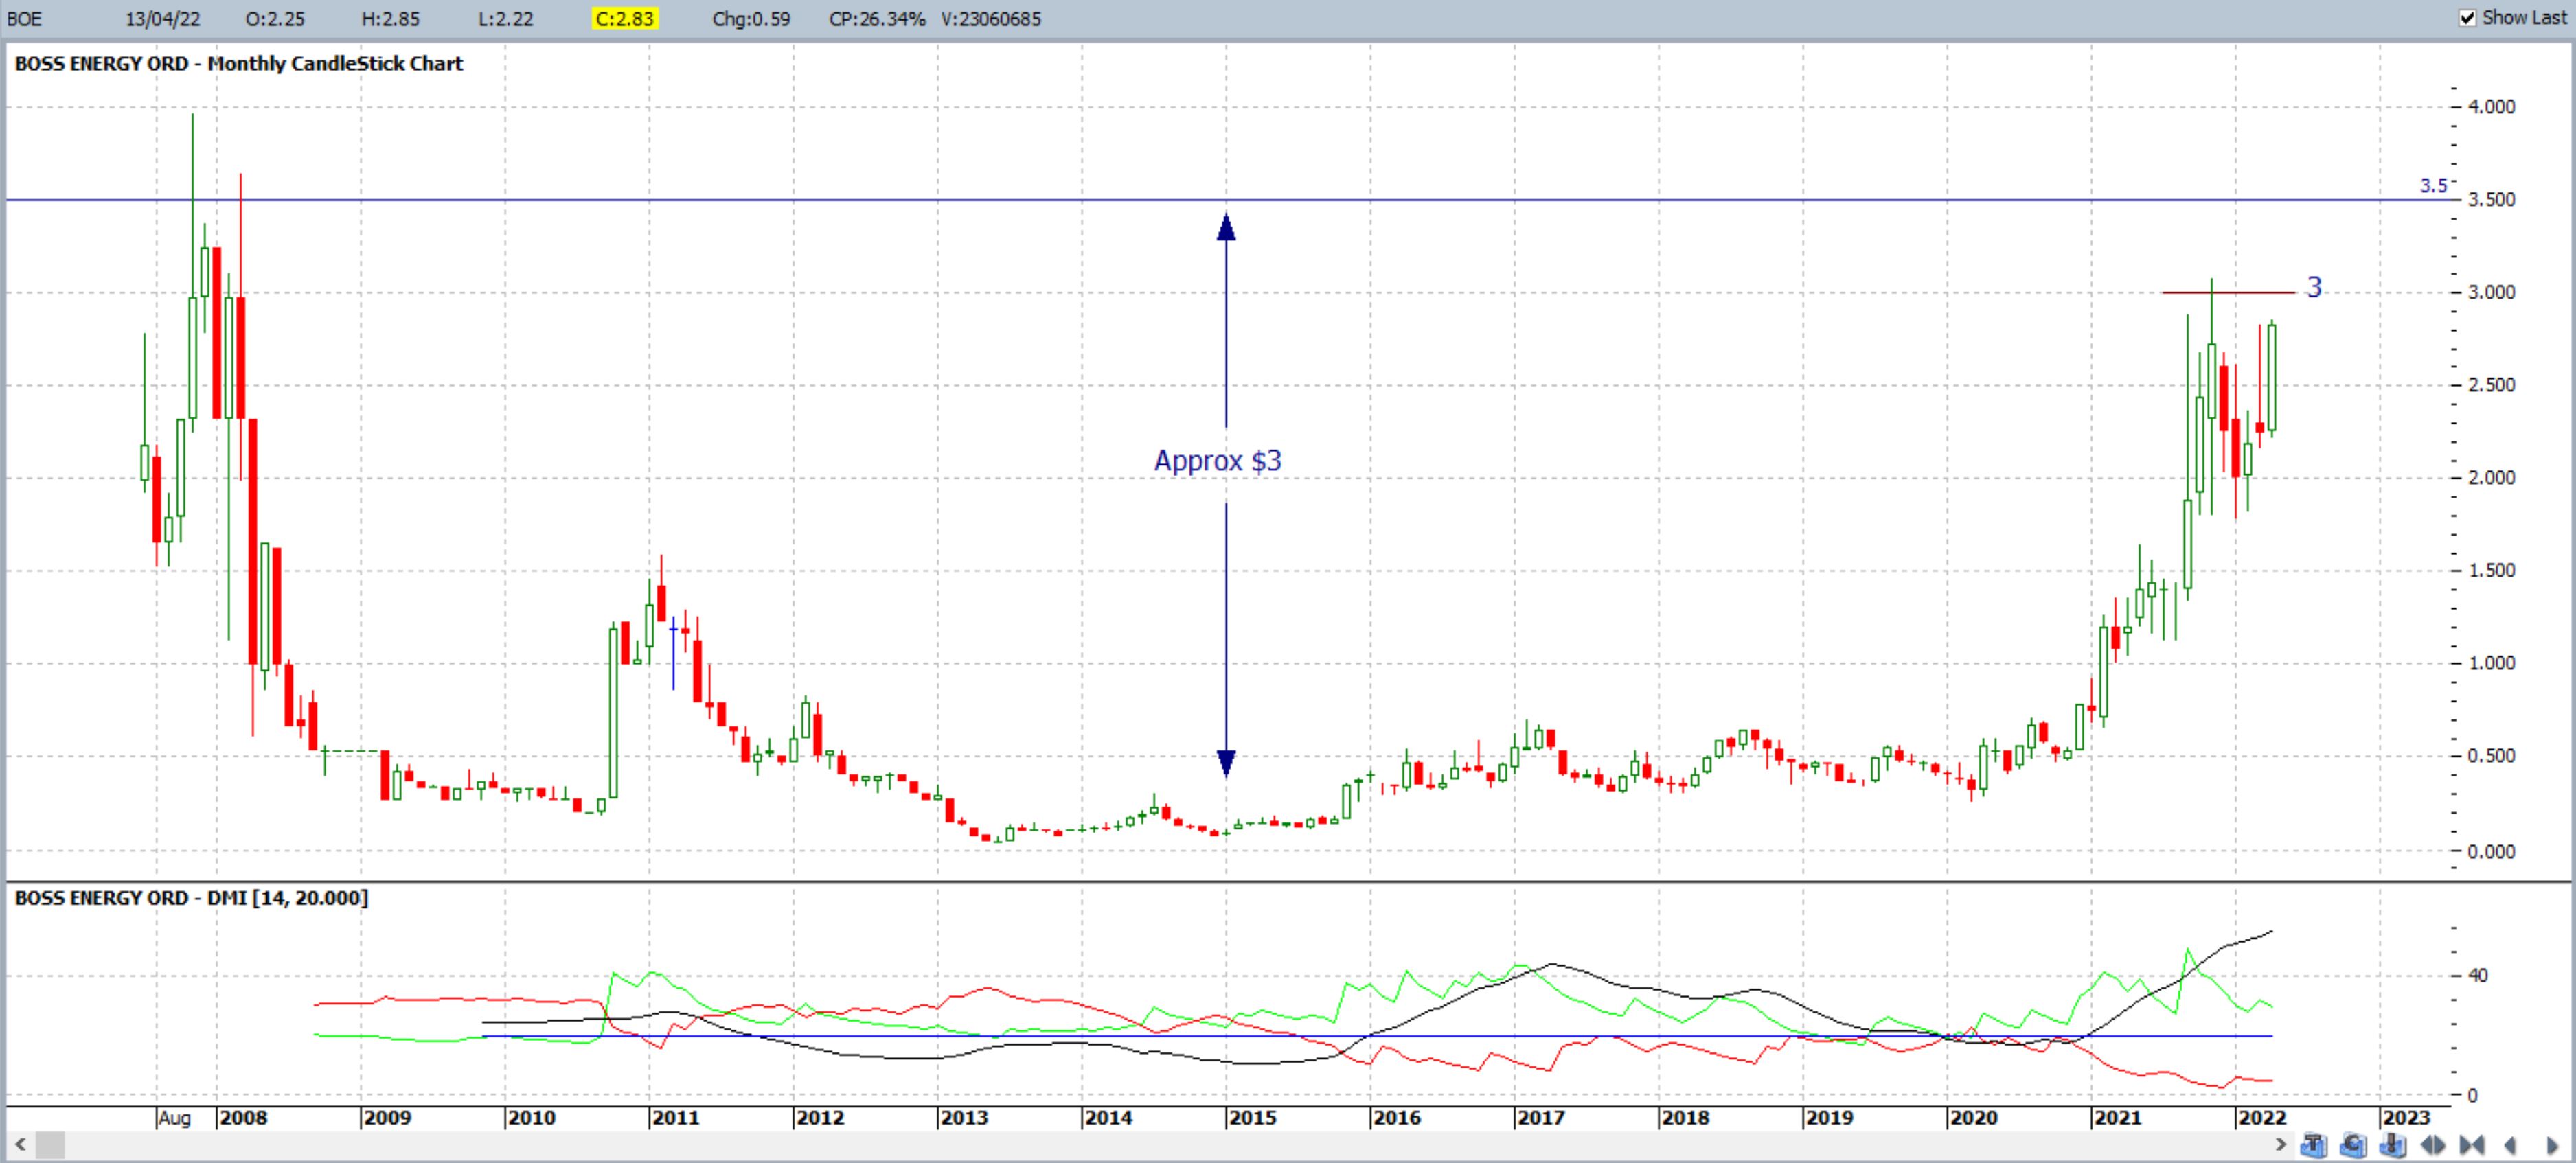
Figure 7: BOE monthly
EL8: Elevate Uranium
EL8 is another Uranium stock where the price trajectory has aligned similarly to that of the spot metal. The chart in Figure 8 shows that the EL8 price is holding below $0.80 and this can be seen to be a reaction zone for the stock during the periods of 1995, 2004 – 2005 and since 2012.
Note how the popular 61.8% Fibonacci retracement level is up near the $25 region which was also a reaction zone back in 2000 and between 2006 and 2009. Any momentum-based break and hold above the $0.80 level would bring this $25 region into greater focus if bullish momentum is sustained.
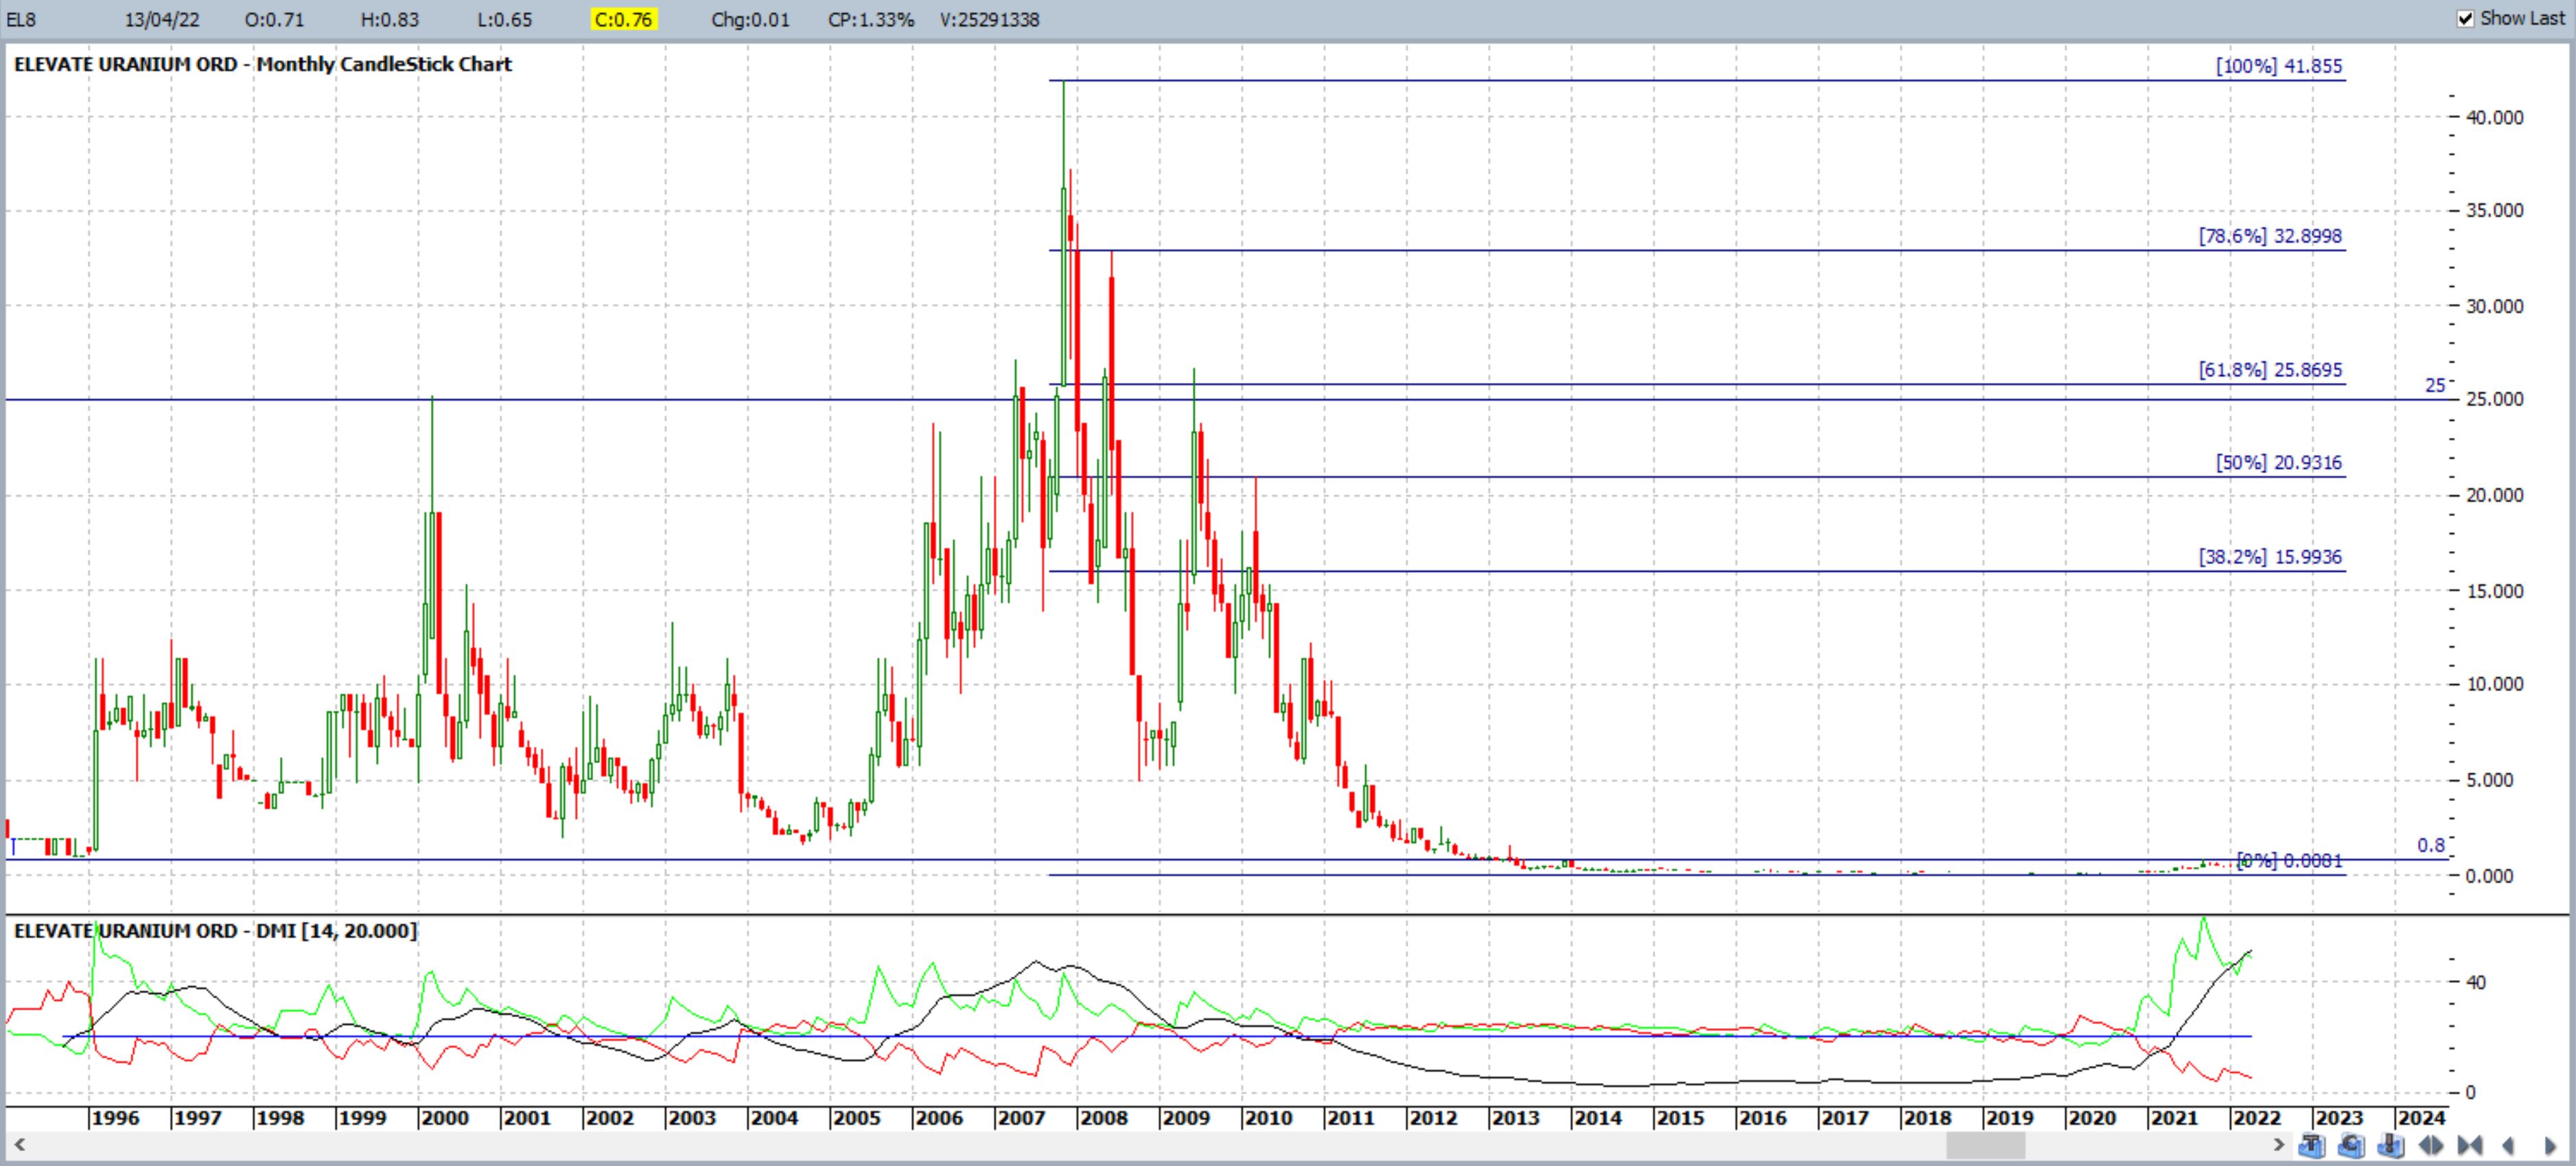
Figure 8: EL8 monthly
Concluding Comments
The price of Uranium has been in recovery mode since mid 2021 and this is reflected in the price action across many Uranium based stocks. Five different Australian Uranium stocks have been reviewed in this article and key levels have been noted to monitor for any further bullish breakout. The charts that were profiled were monthly charts and so these key levels need to be evaluated at the end of subsequent calendar months.
As always, traders should only ever trade with funds that are surplus to their needs and that they can afford to lose. Trading is a high-risk activity and trading risk, measuring the amount of funds that can be lost on a trade, should be carefully managed. Traders should seek financial advice before engaging in any trading activity.