


I posted yesterday about how I’m checking out my new coded TC template using the stock Indices and short-term charts and this is how the template and charts panned out. Before and after shots of the stock indices are shown below. All the identified trade entries were positive but some were potentially much more profitable than others. NB: this is a work in progress.
DJIA 15 min: Before:
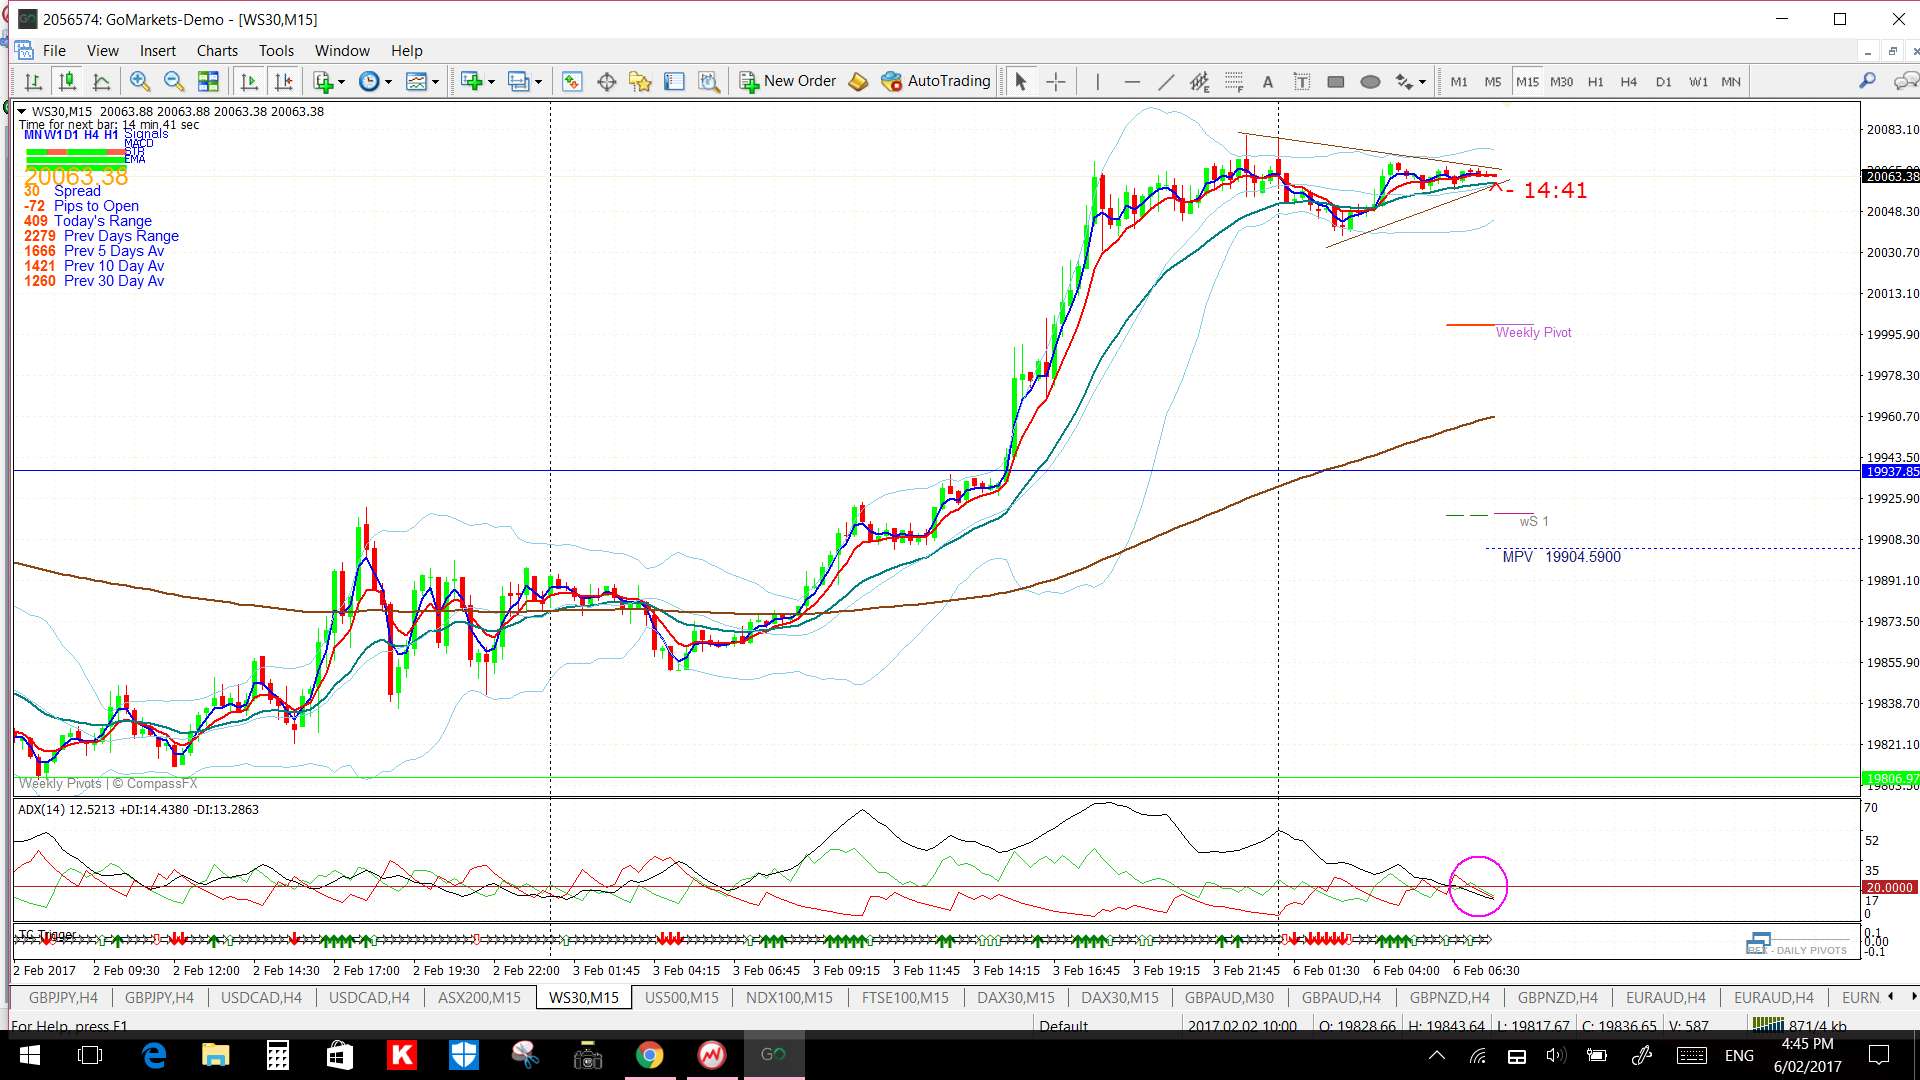
After: I modified the trend lines later in the evening as little had happened. There were eventually two Short signals but price action was rather choppy.

S&P500 15 min: Before:

After: this index was pretty choppy too and I modified the trend lines later in the evening. As with the DJIA, there were two Short signals that didn’t do too much.

NASDAQ-100 15 min: Before:

After: only one choppy LONG signal here:

DAX 15 min: Before:
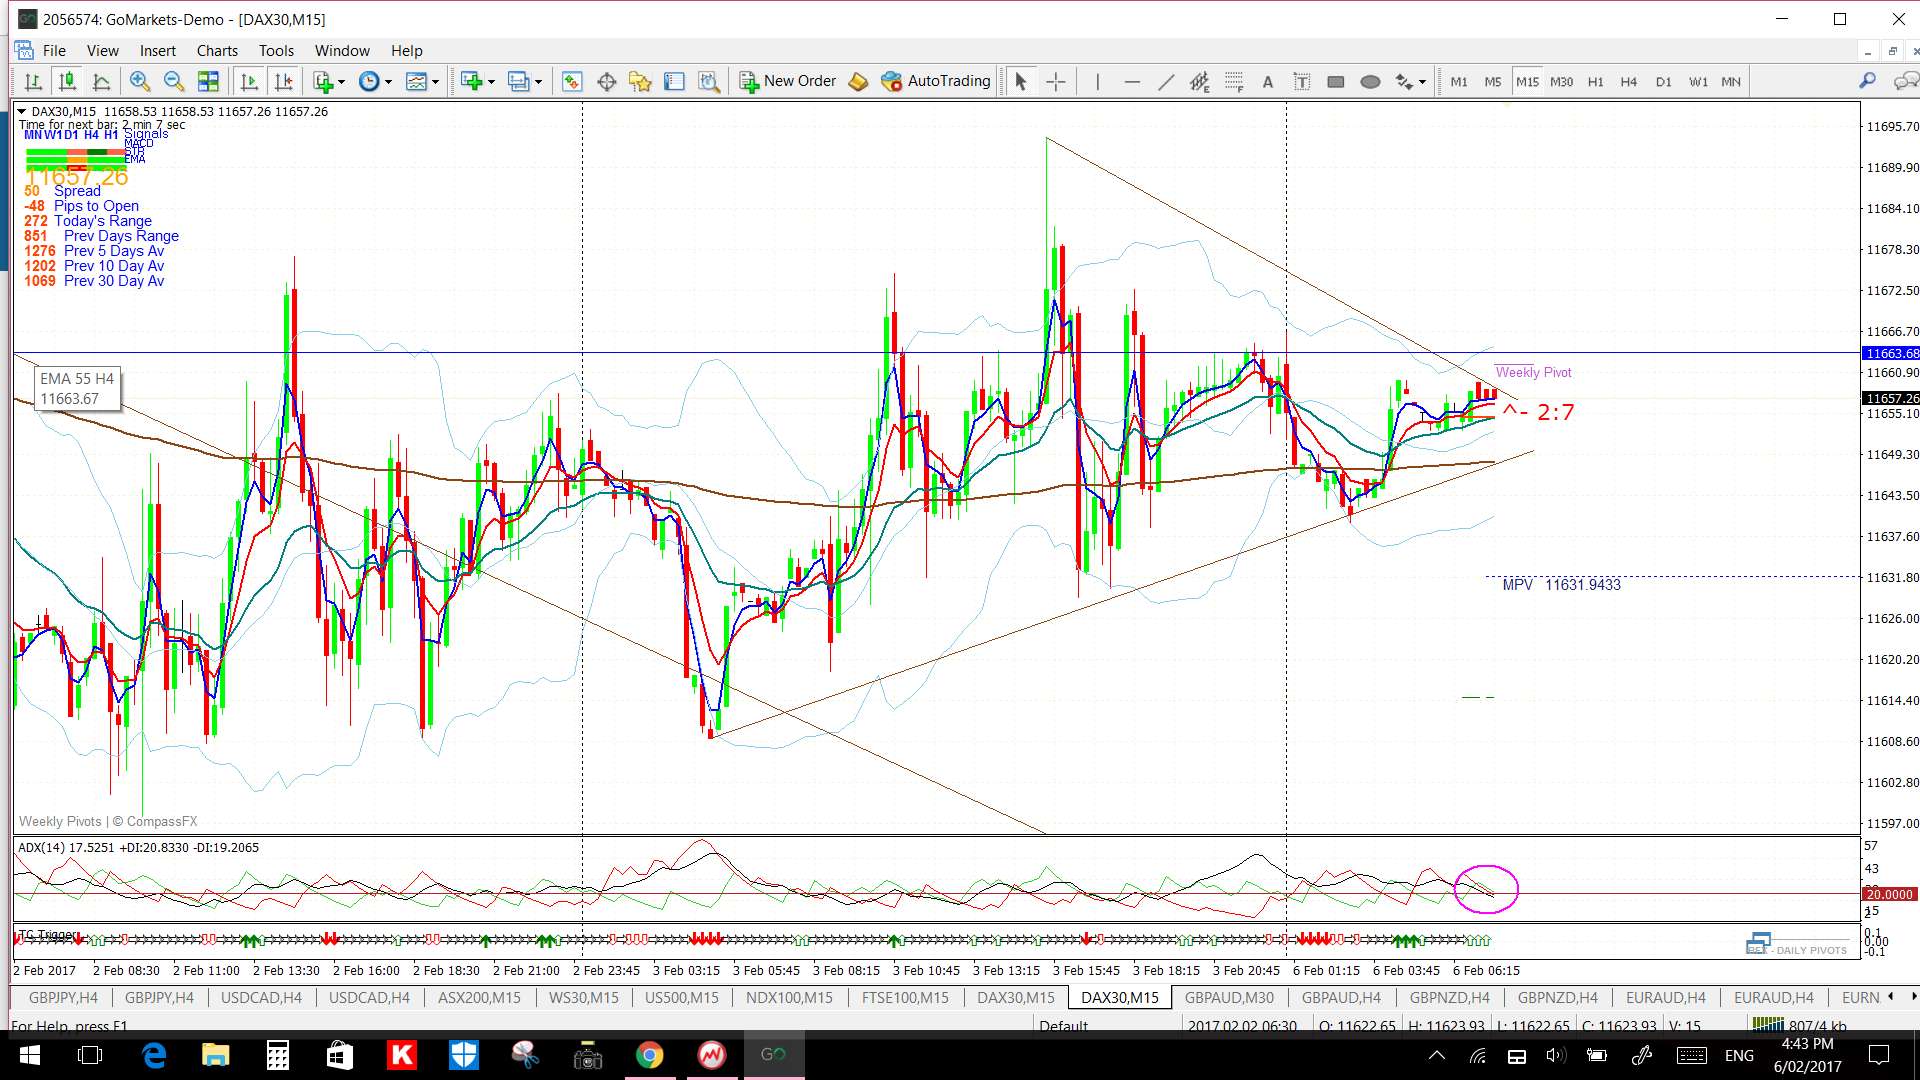
After: this was one of the more productive indices giving two decent sized moves following Short signals:

FTSE-100 15 min: Before:
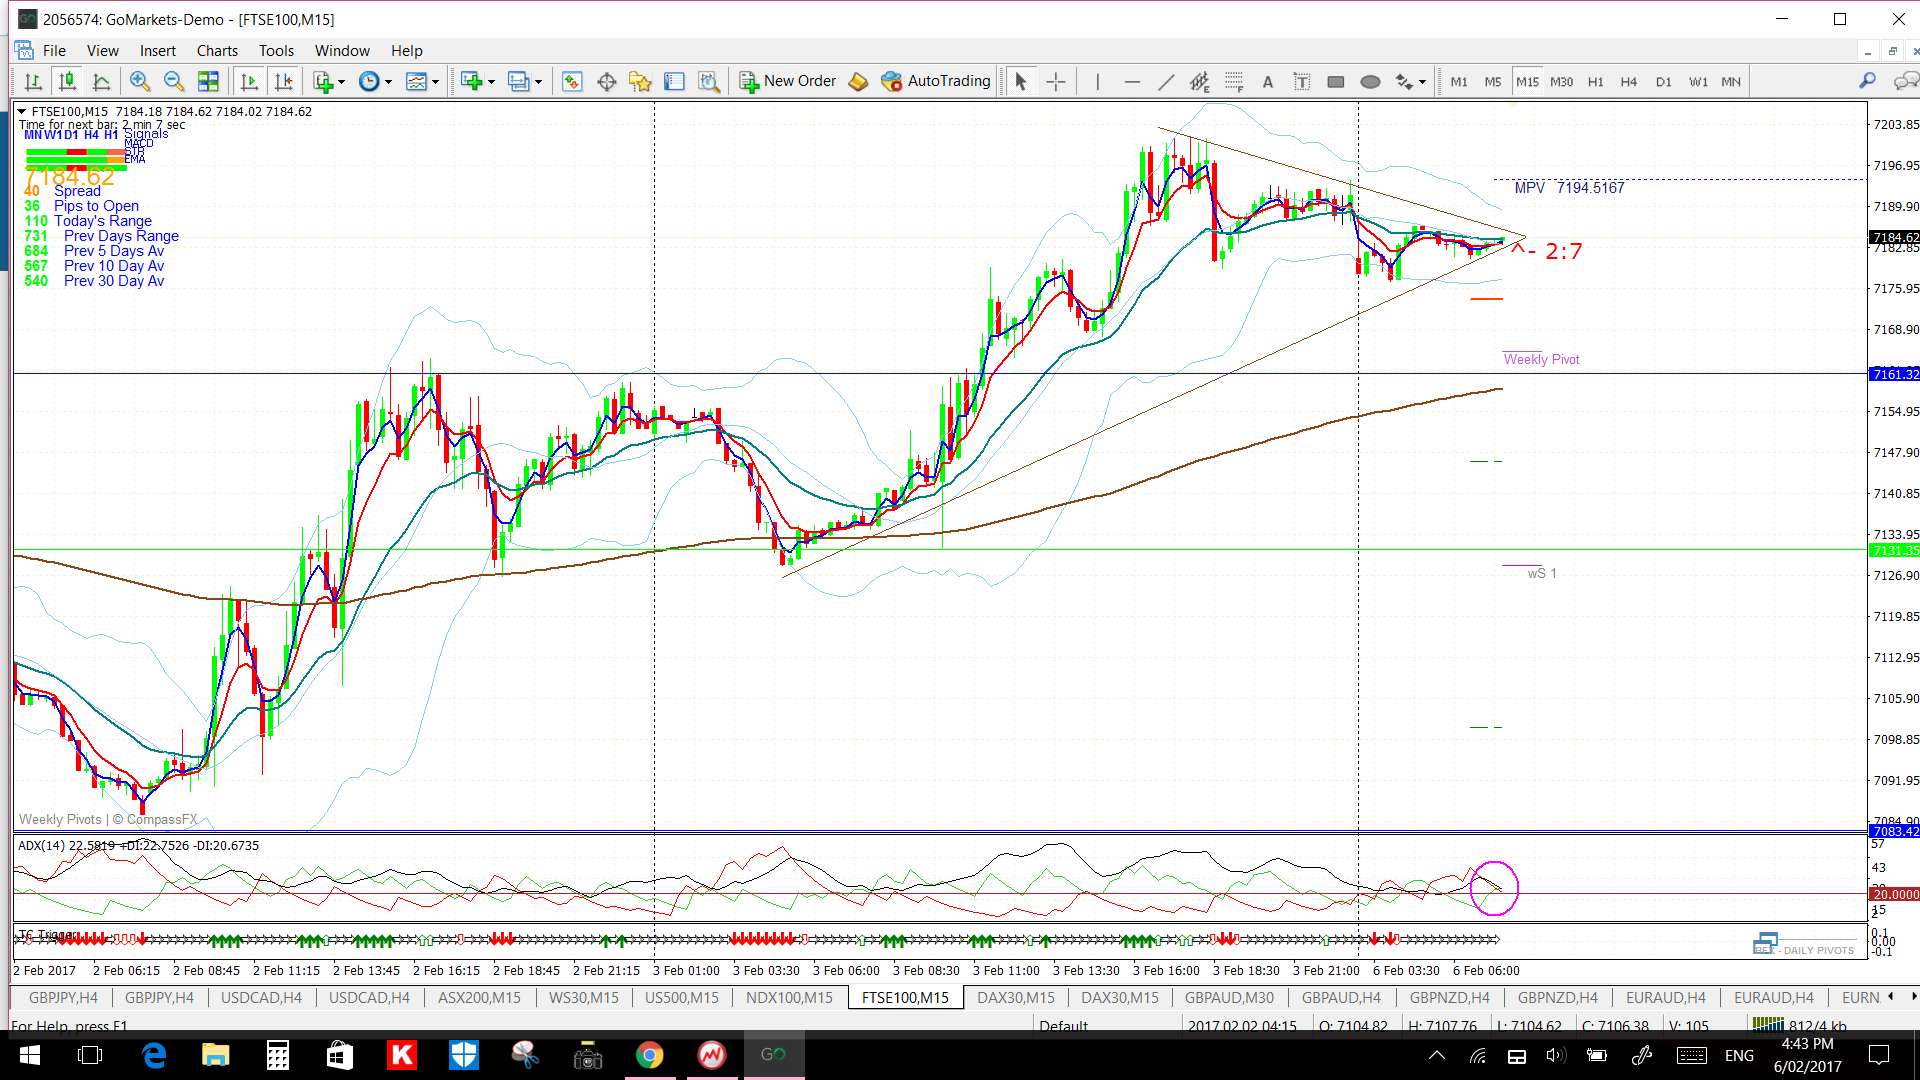
After: an OK Long and a reasonable Short signal here:

NB: This Aussie ASX-200 index wasn’t covered in last nights post but I had noted yesterday with a colleague how this had given a great potential trade during Monday’s Asian session:
