


Fri 4th July (4.30 pm)
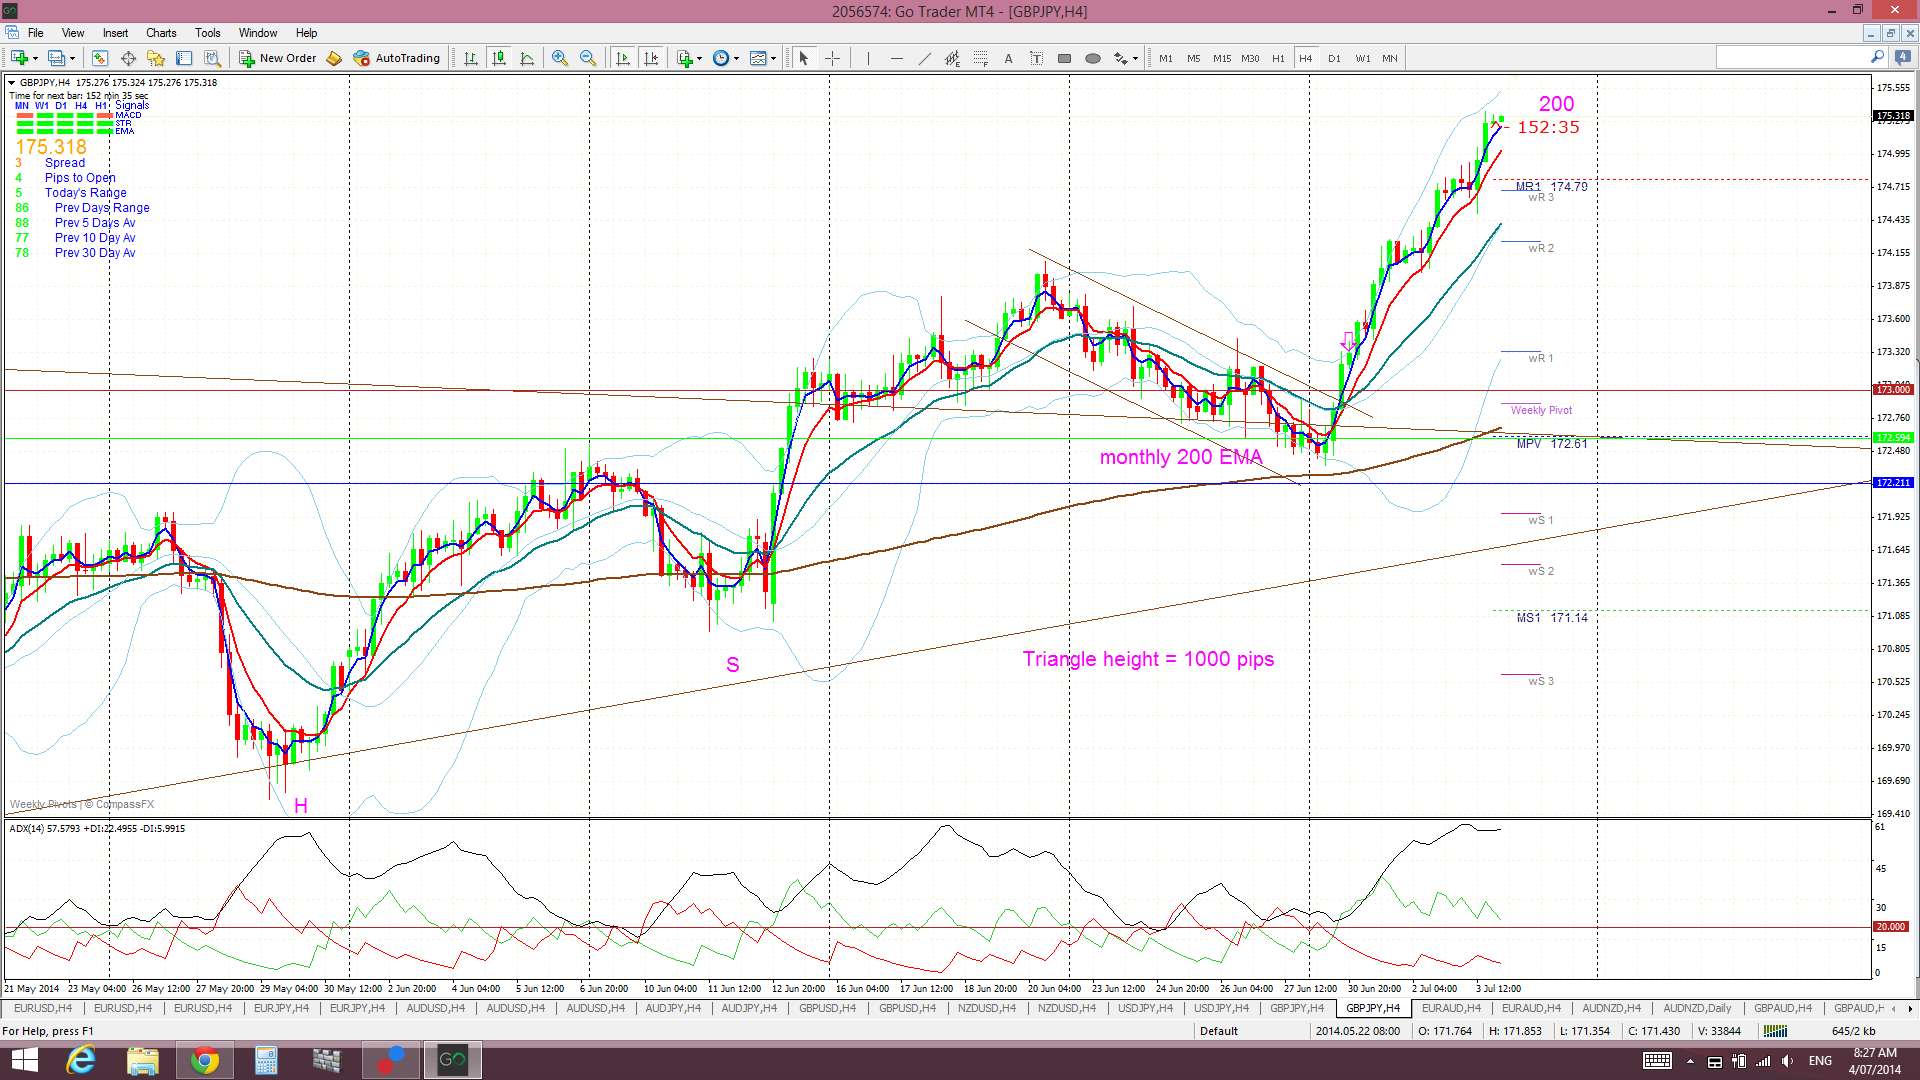
GBP/JPY: I actually think this pair could head to the 200 level which is the region of the 61.8% fib level of the 2007 -2011 bear move. The June monthly candle close above the monthly 200 EMA and the hold above the key 173 level are quite bullish signals here:
GBP/JPY monthly:
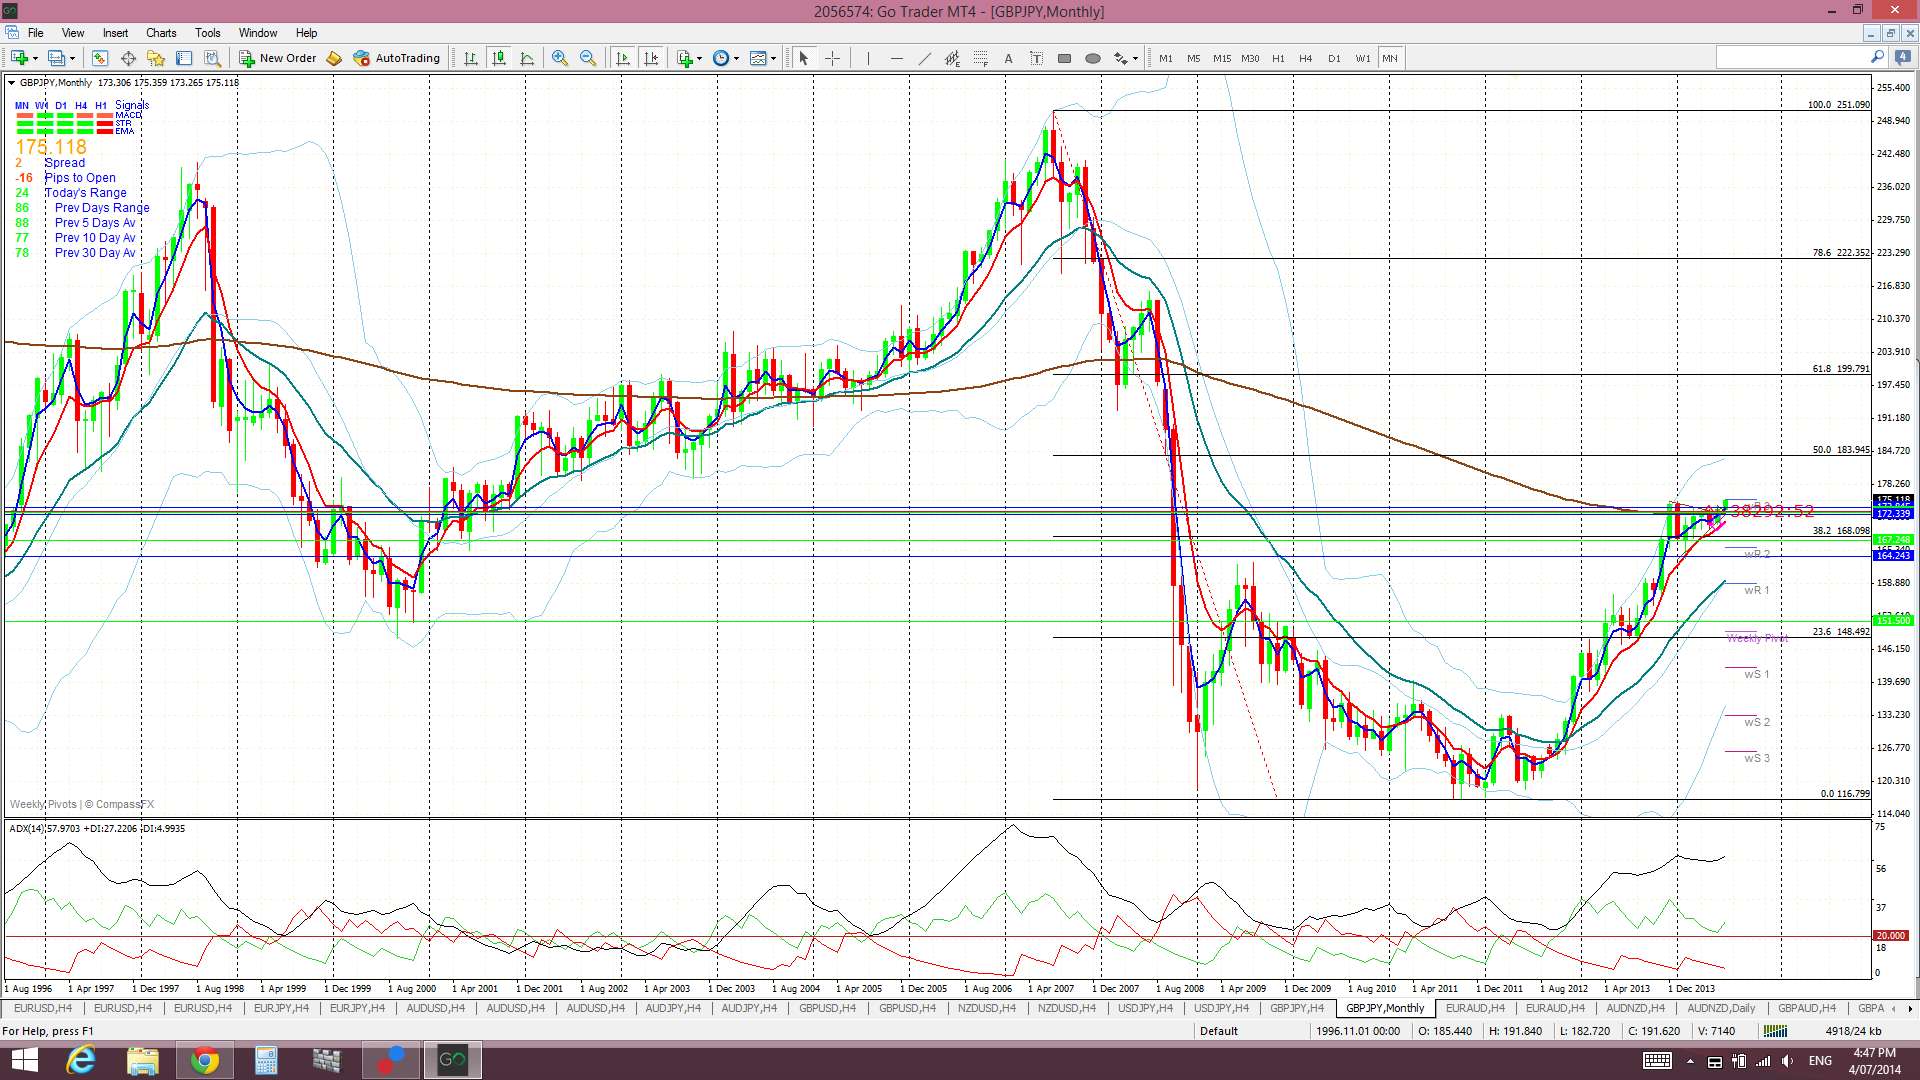
I’m not sure it will head there in a straight line though and would expect the major level of 173 to be tested again. Thus, I’d be keeping a tight stop on the current TC signal to lock in healthy profit here. I am long this pair but keeping a reasonably tight stop. If I get stopped out I will look to get back in next week:
G/J 4hr

Fri 4th July (2 pm)
E/J: this signal has closed off for a loss of 15 pips:

Fri 4th July (8 am)
NFP data was very positive with US unemployment falling to a much better than expected rate of 6.1%. This should add cheer to many 4th July gatherings this w/e. I am slightly surprised to see that the USD, whilst having rallied off this data print, isn’t trading even higher. It is still below the major resistance of the weekly 200 EMA. Also, Gold, Silver and the Cable have held up well and stocks have continued with their rally.
S&P500: I had stated yesterday that this chart was setting up for an excellent 30 min trend trade during the US session and this is what we got:

Some S&P500 point to mull over on this 4th July w/e: A point to note here with the S&P500: many traders can’t believe this rally can continue but a technical view suggests otherwise. The monthly chart shows the S&P500 part way though its bullish ascending triangle breakout. Technical theory would suggest a target of 2,500 here; based on the height of the triangle:
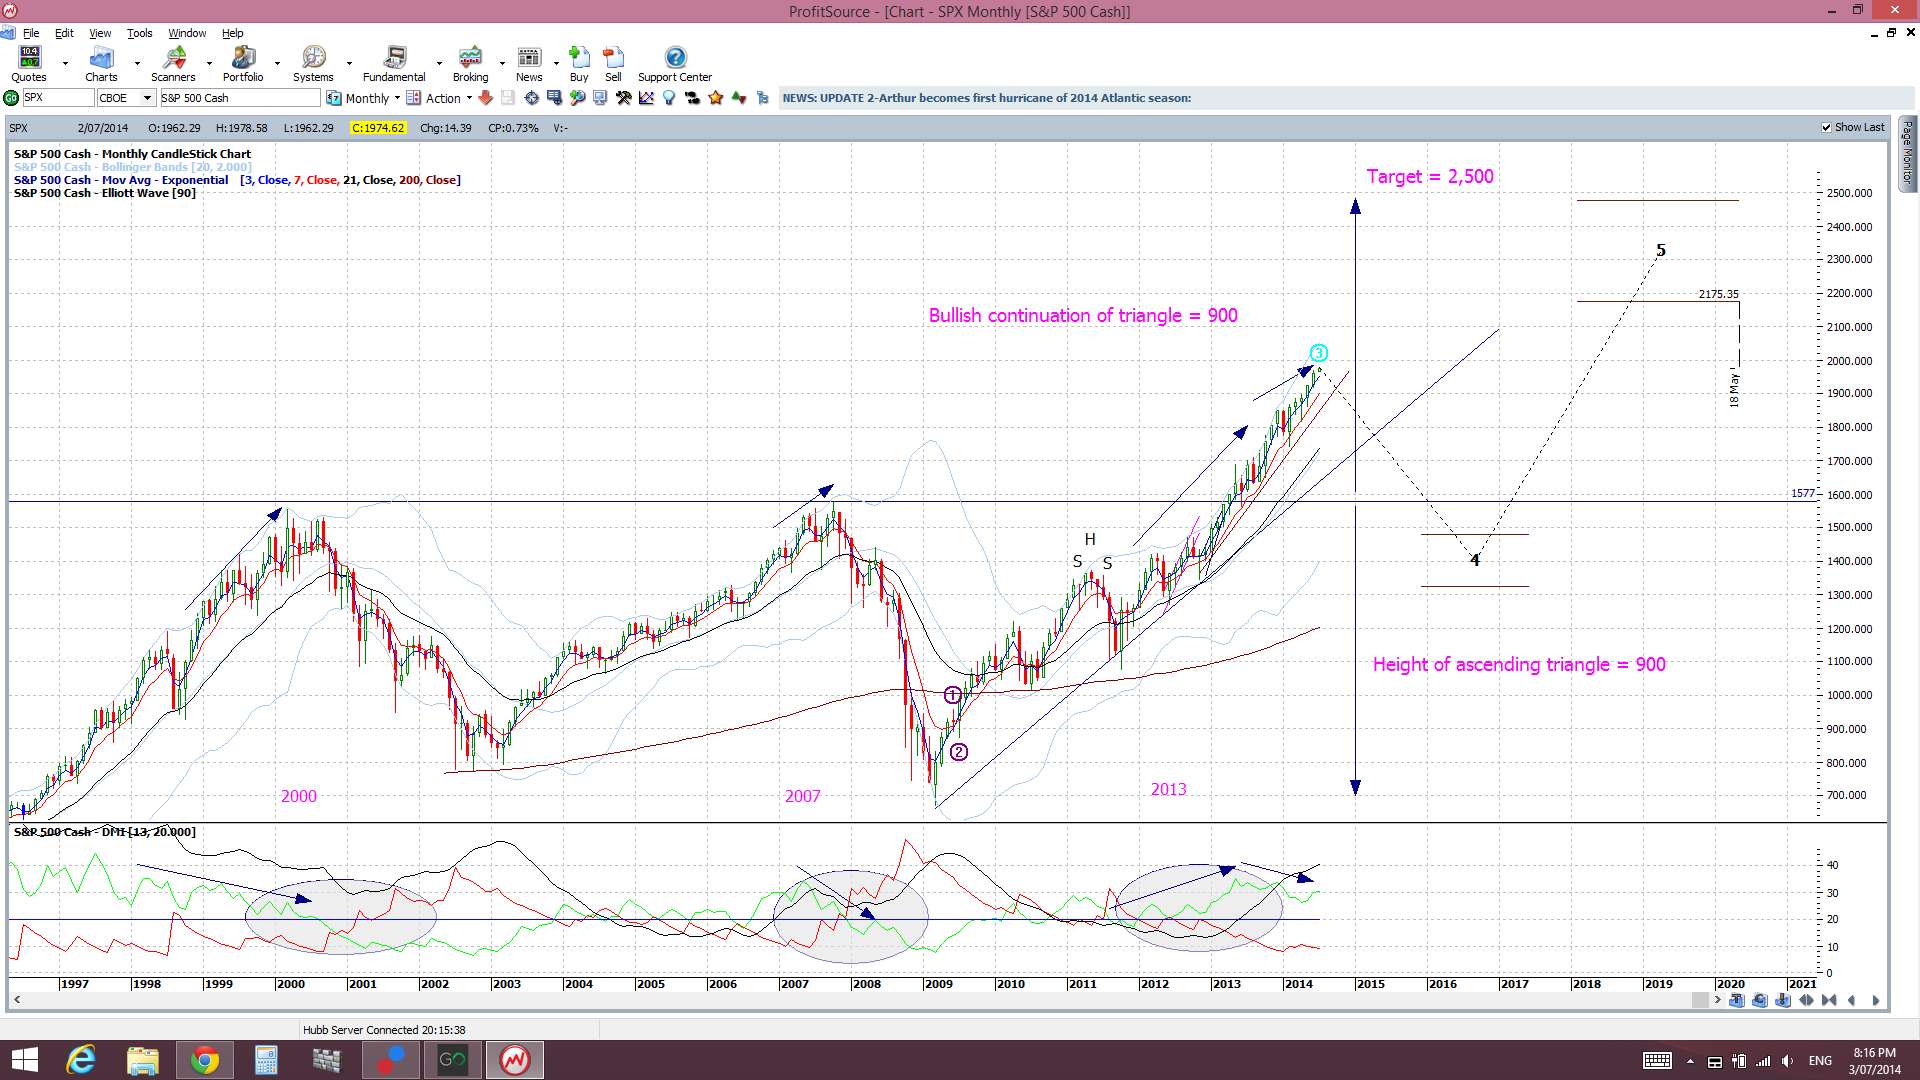
A pull back, when it does eventually evolve, would probably test the 1,577 breakout level but there is no sign of this just yet with daily and monthly support trend lines still intact.
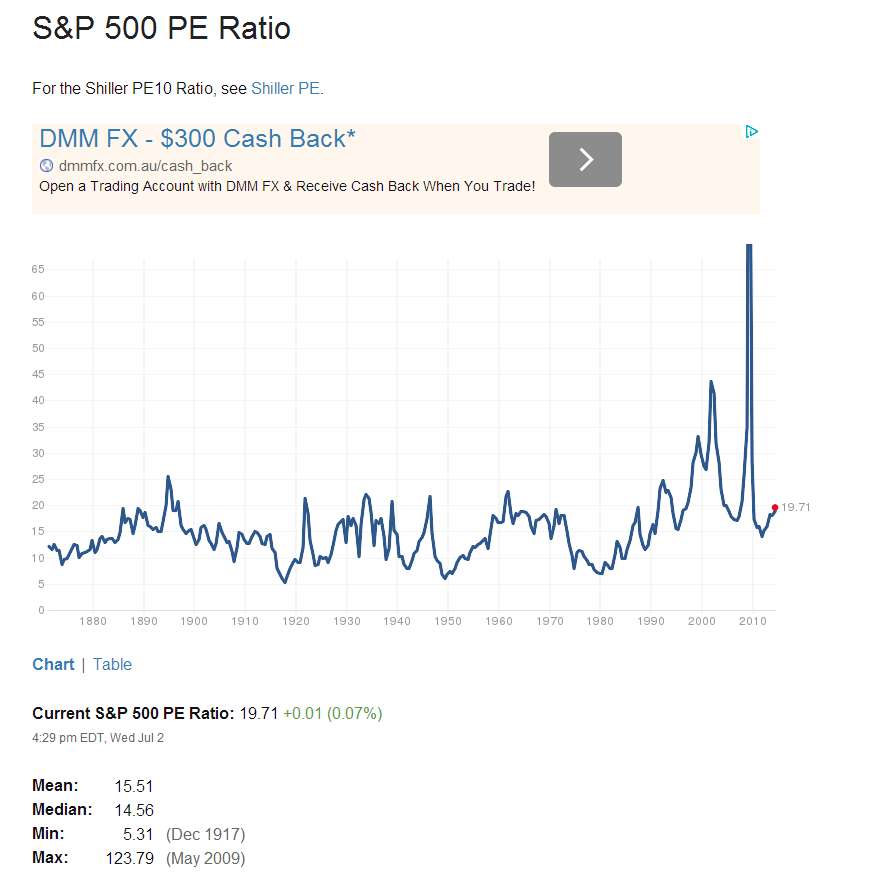
The S&P500 PE ratio for the index doesn’t seem overly extended at the moment. This suggest further room for the index to move higher:
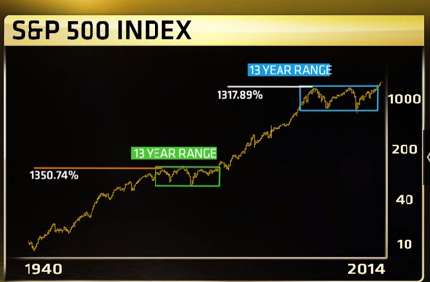
This 70 year S&P500 chart from GS, as my chart data doesn’t go back that far, suggests we could possibly be entering into a new boom market phase:
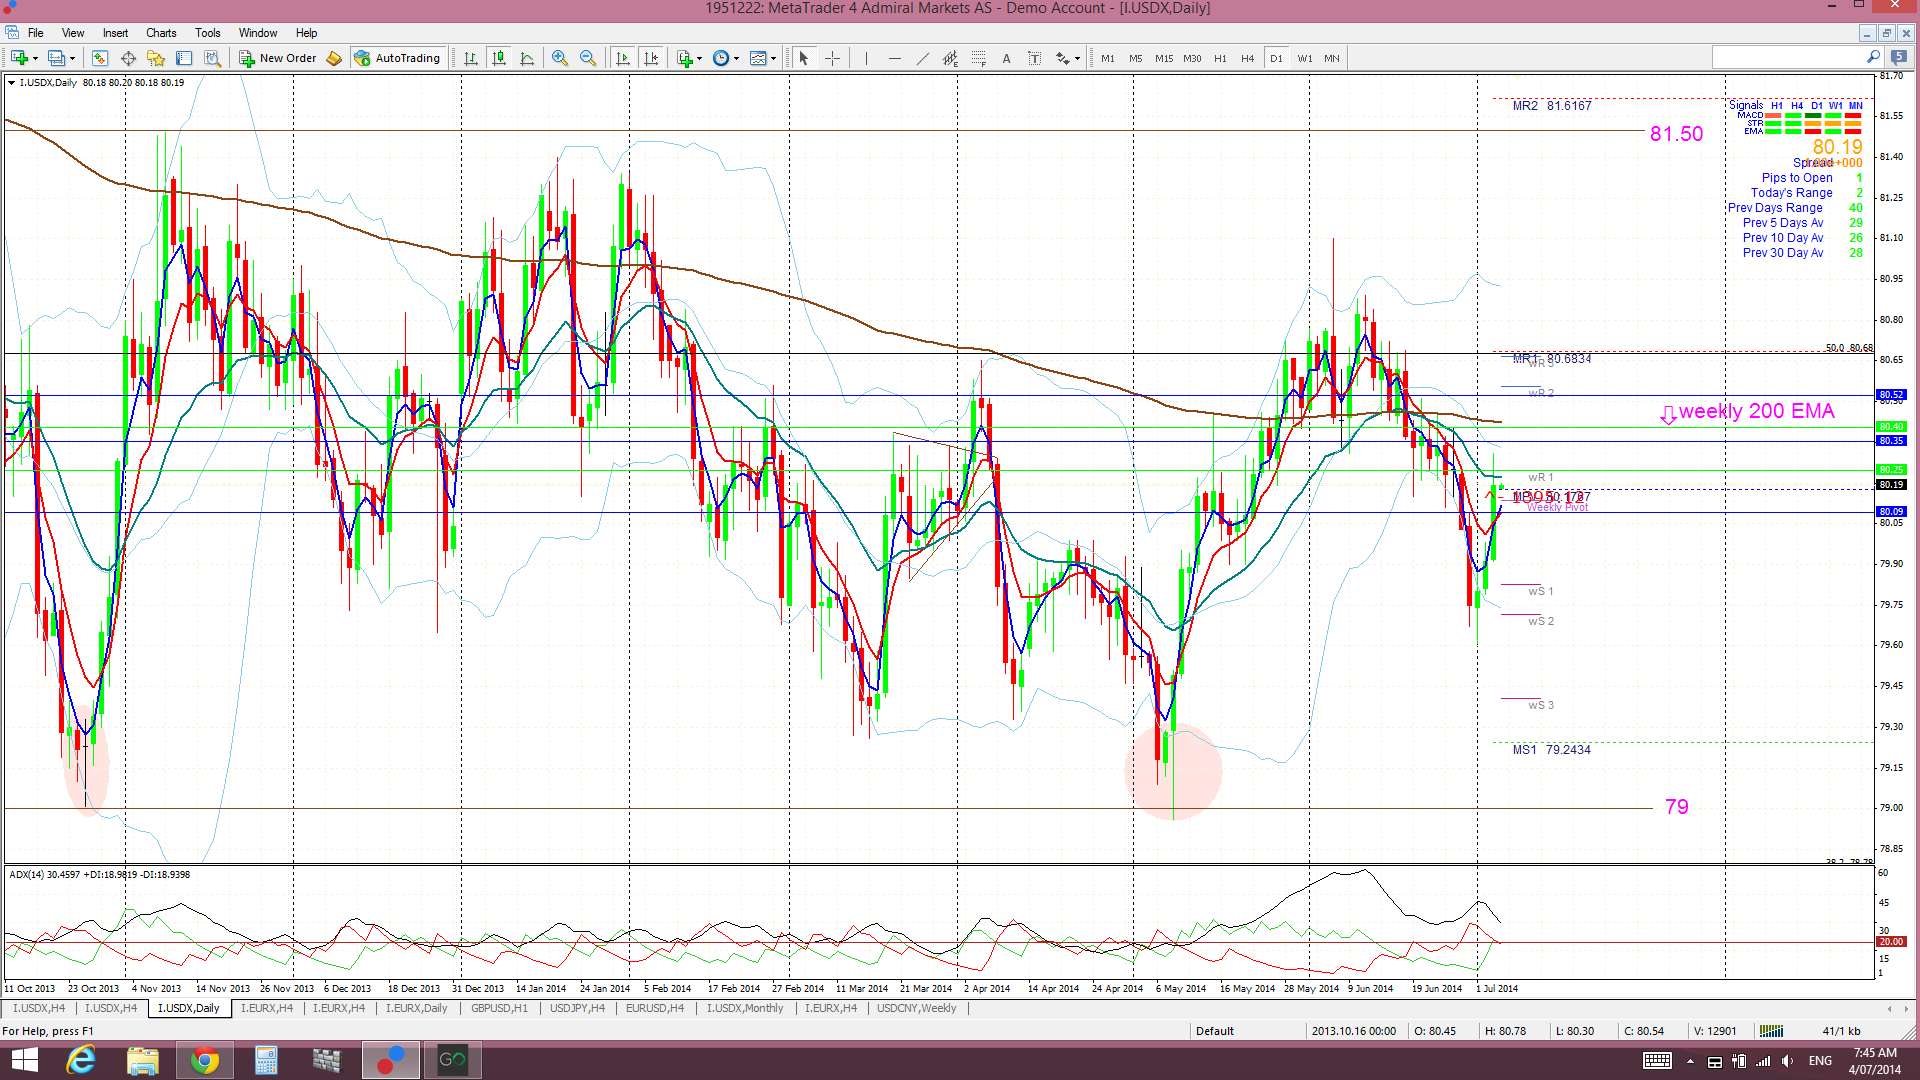
USDX: higher but still below the weekly 200 EMA S/R level:
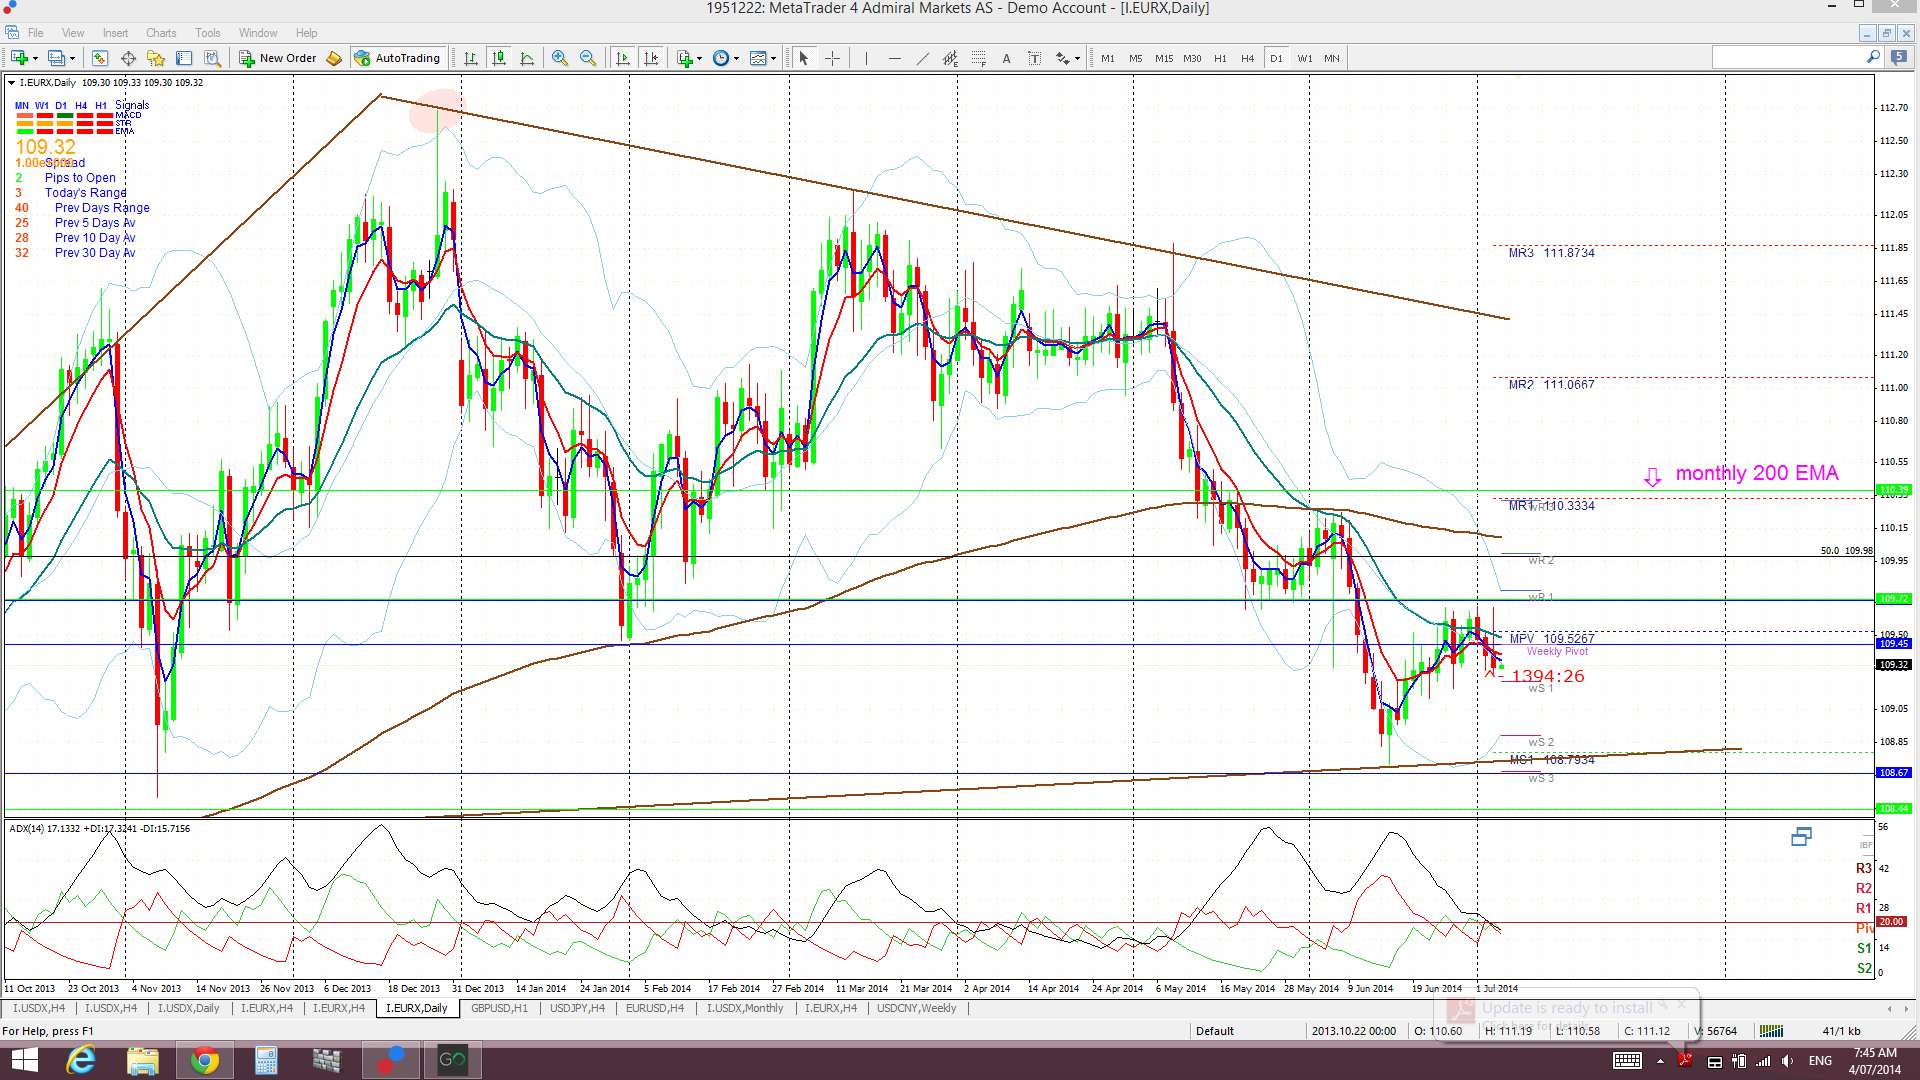
EURX: dipping lower on USD strength:
TC Signals: does anyone recall me saying that we won’t get trends back in FX until US stock indices breakout; either up or down? I think I ranted this for many, many weeks! Well, we had the bullish ascending triangle breakouts on the S&P500 and DJIA a couple of weeks ago and, then, the NASDAQ breakout above 4,400 followed just recently. And now, just this week, there have been 3 TC signals that have given 450 pips in great trend trades:
GBP/JPY: has given 200 pips now:
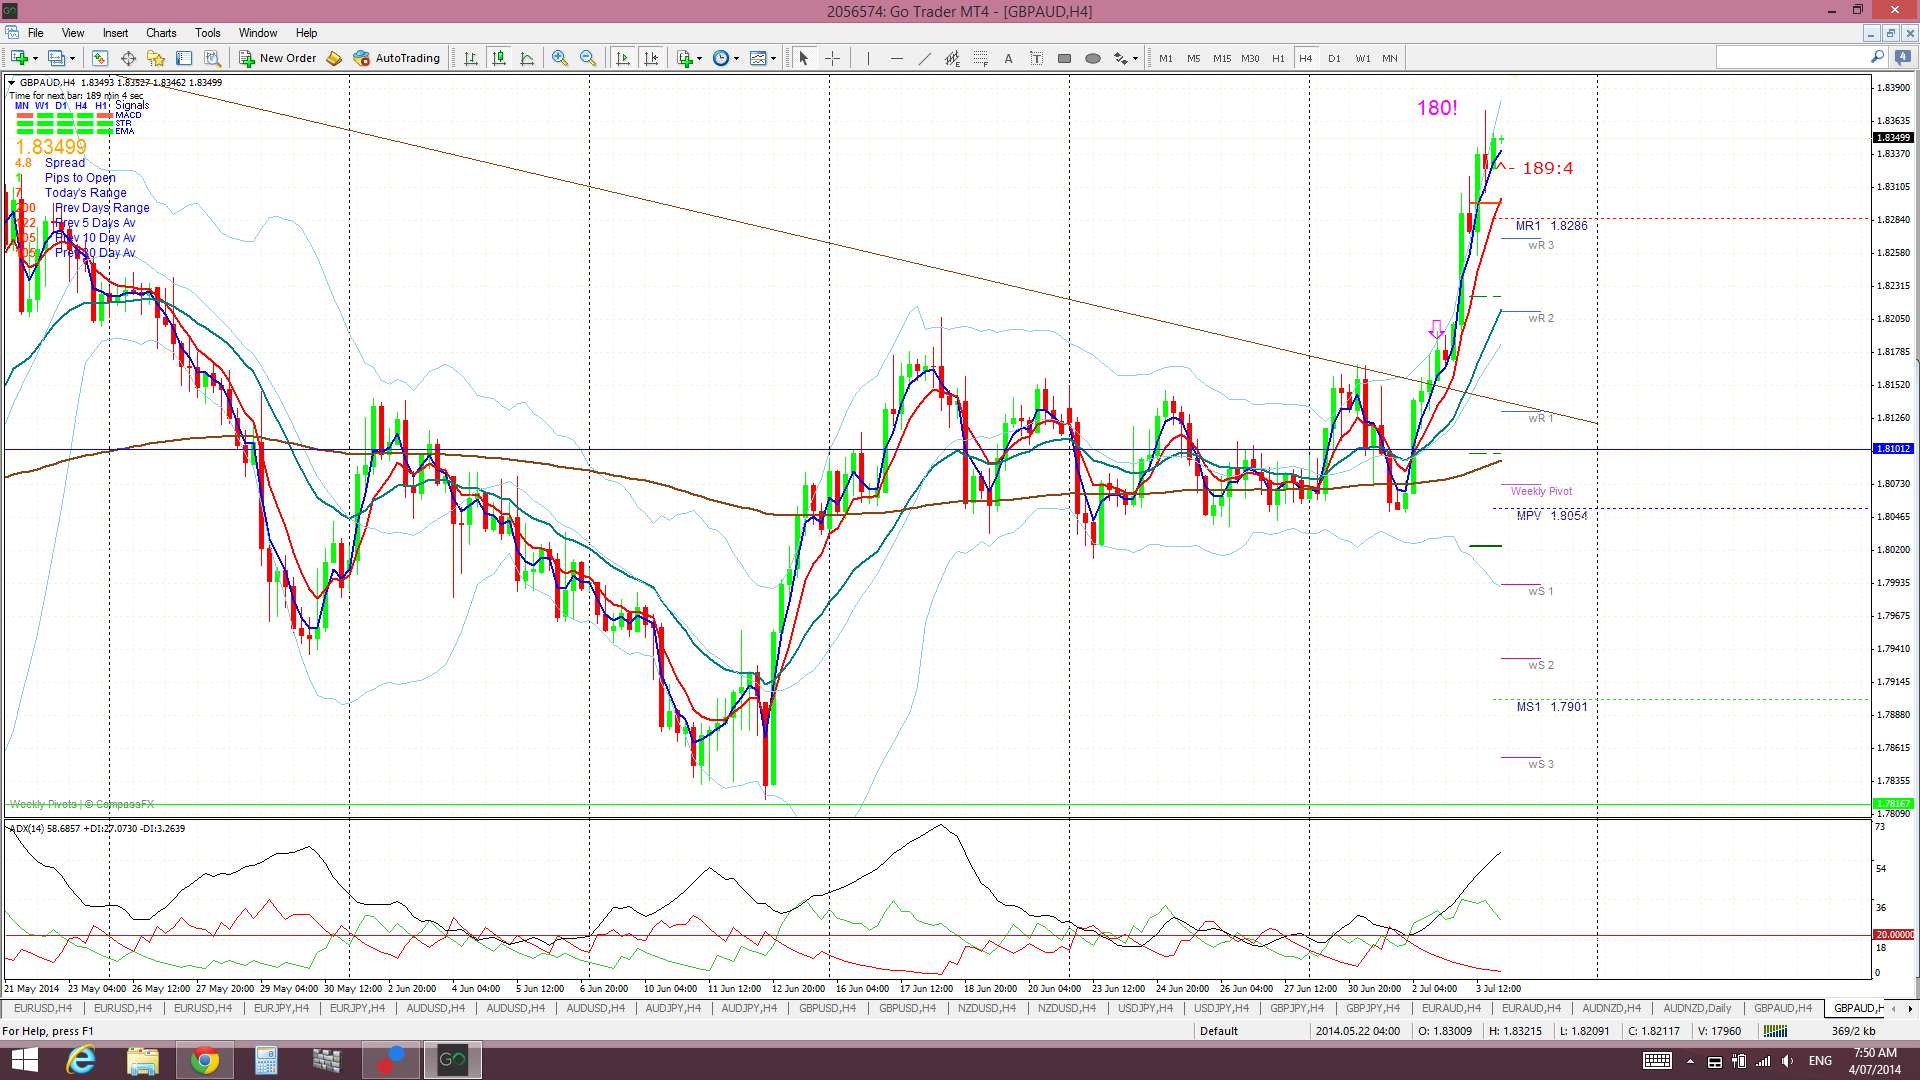
GBP/AUD: has given 180 pips now:
U/J: has given 70 pips:

E/J: this signal has done little and is flat at the moment:

Other FX:
E/U: has taken a dip given the USD strength:

A/U: ditto here. This TC signal that I ignored is positive though:

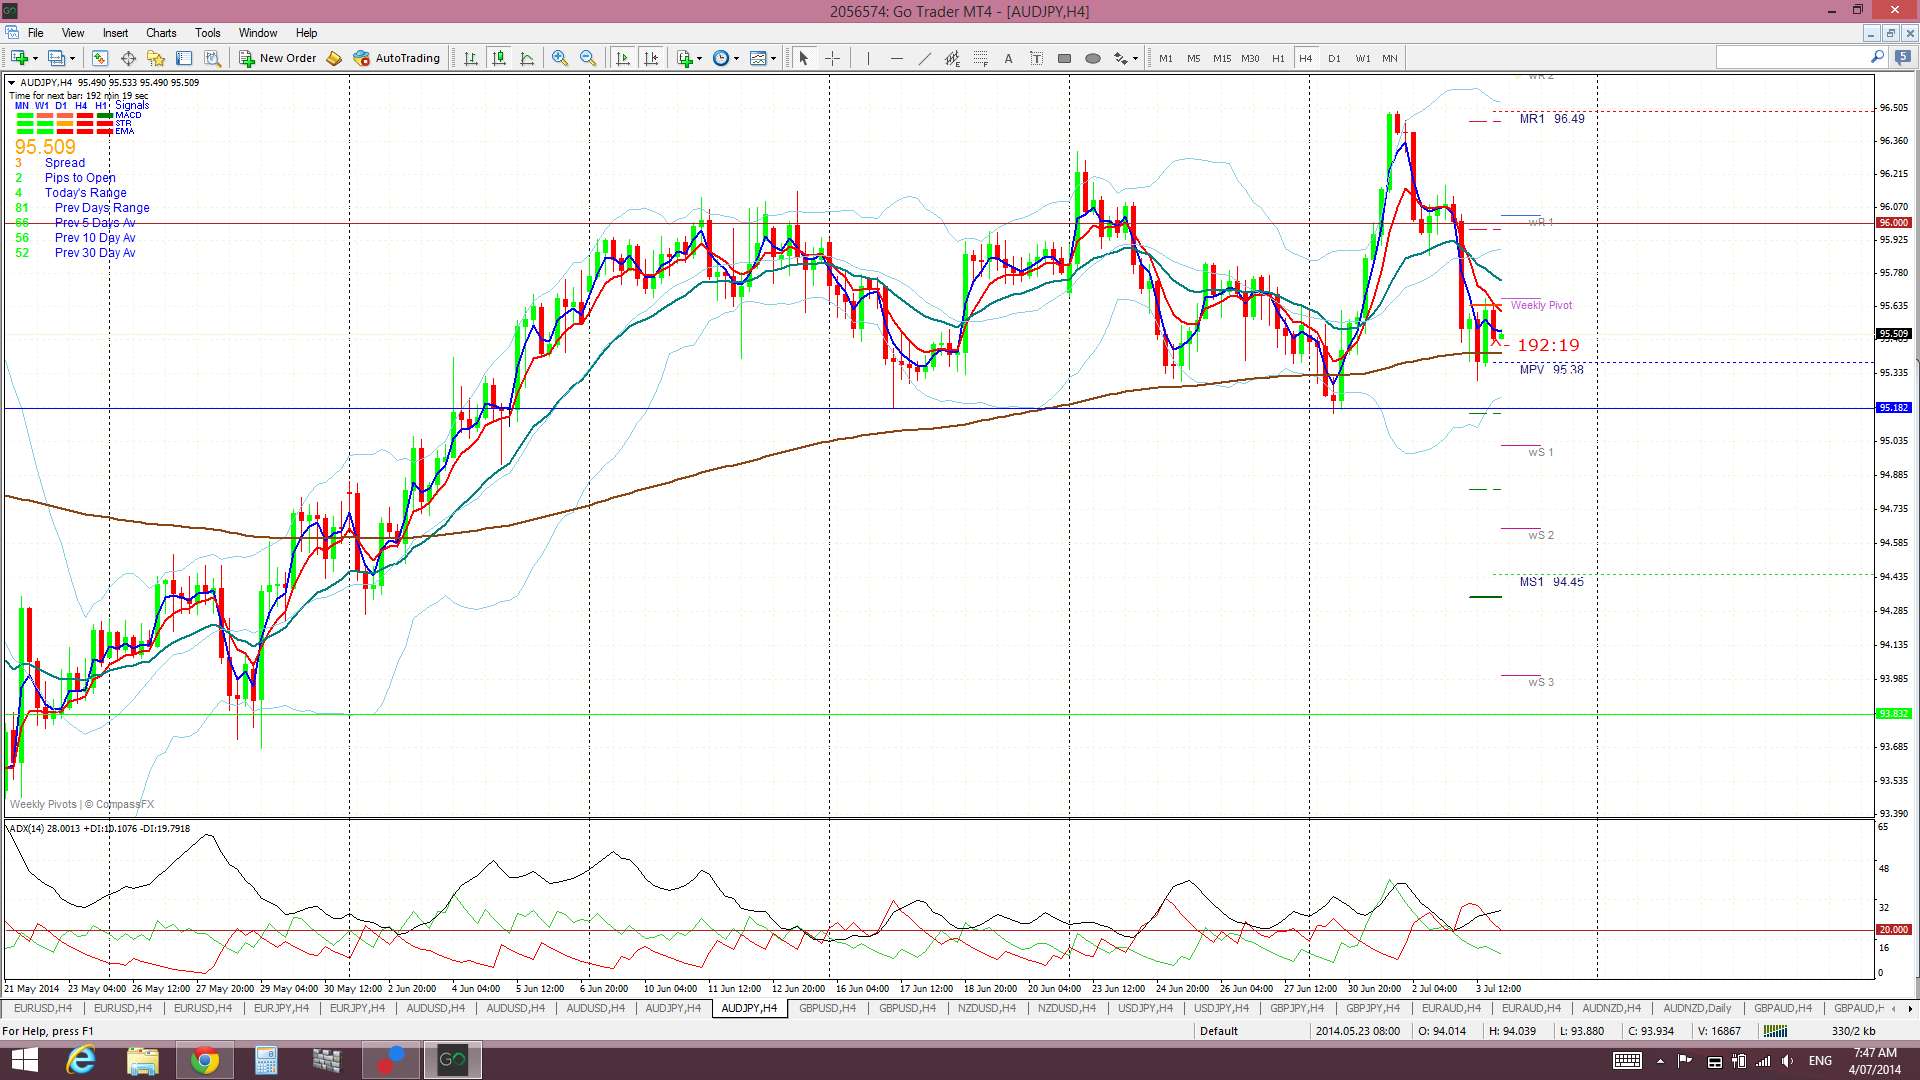
A/J back below the 96 again:
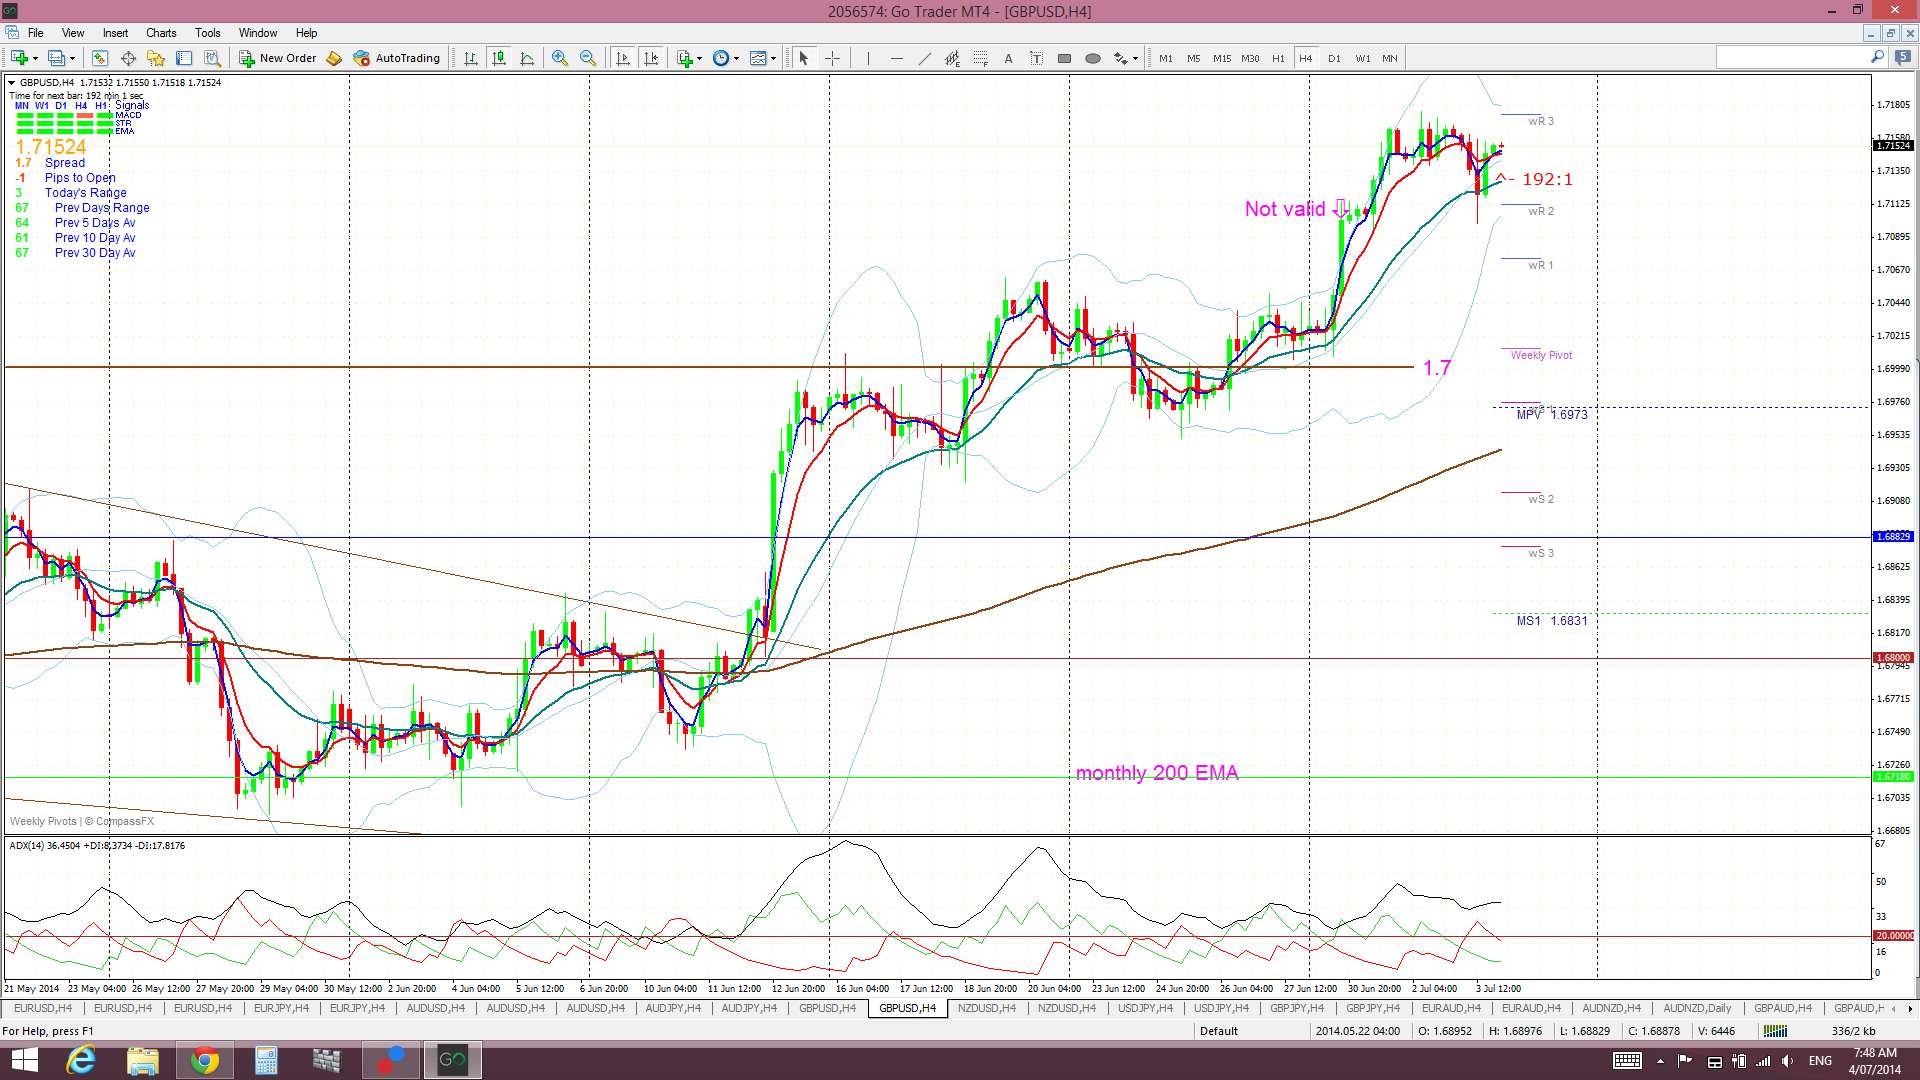
Cable: holding up fairly well given the USD strength:
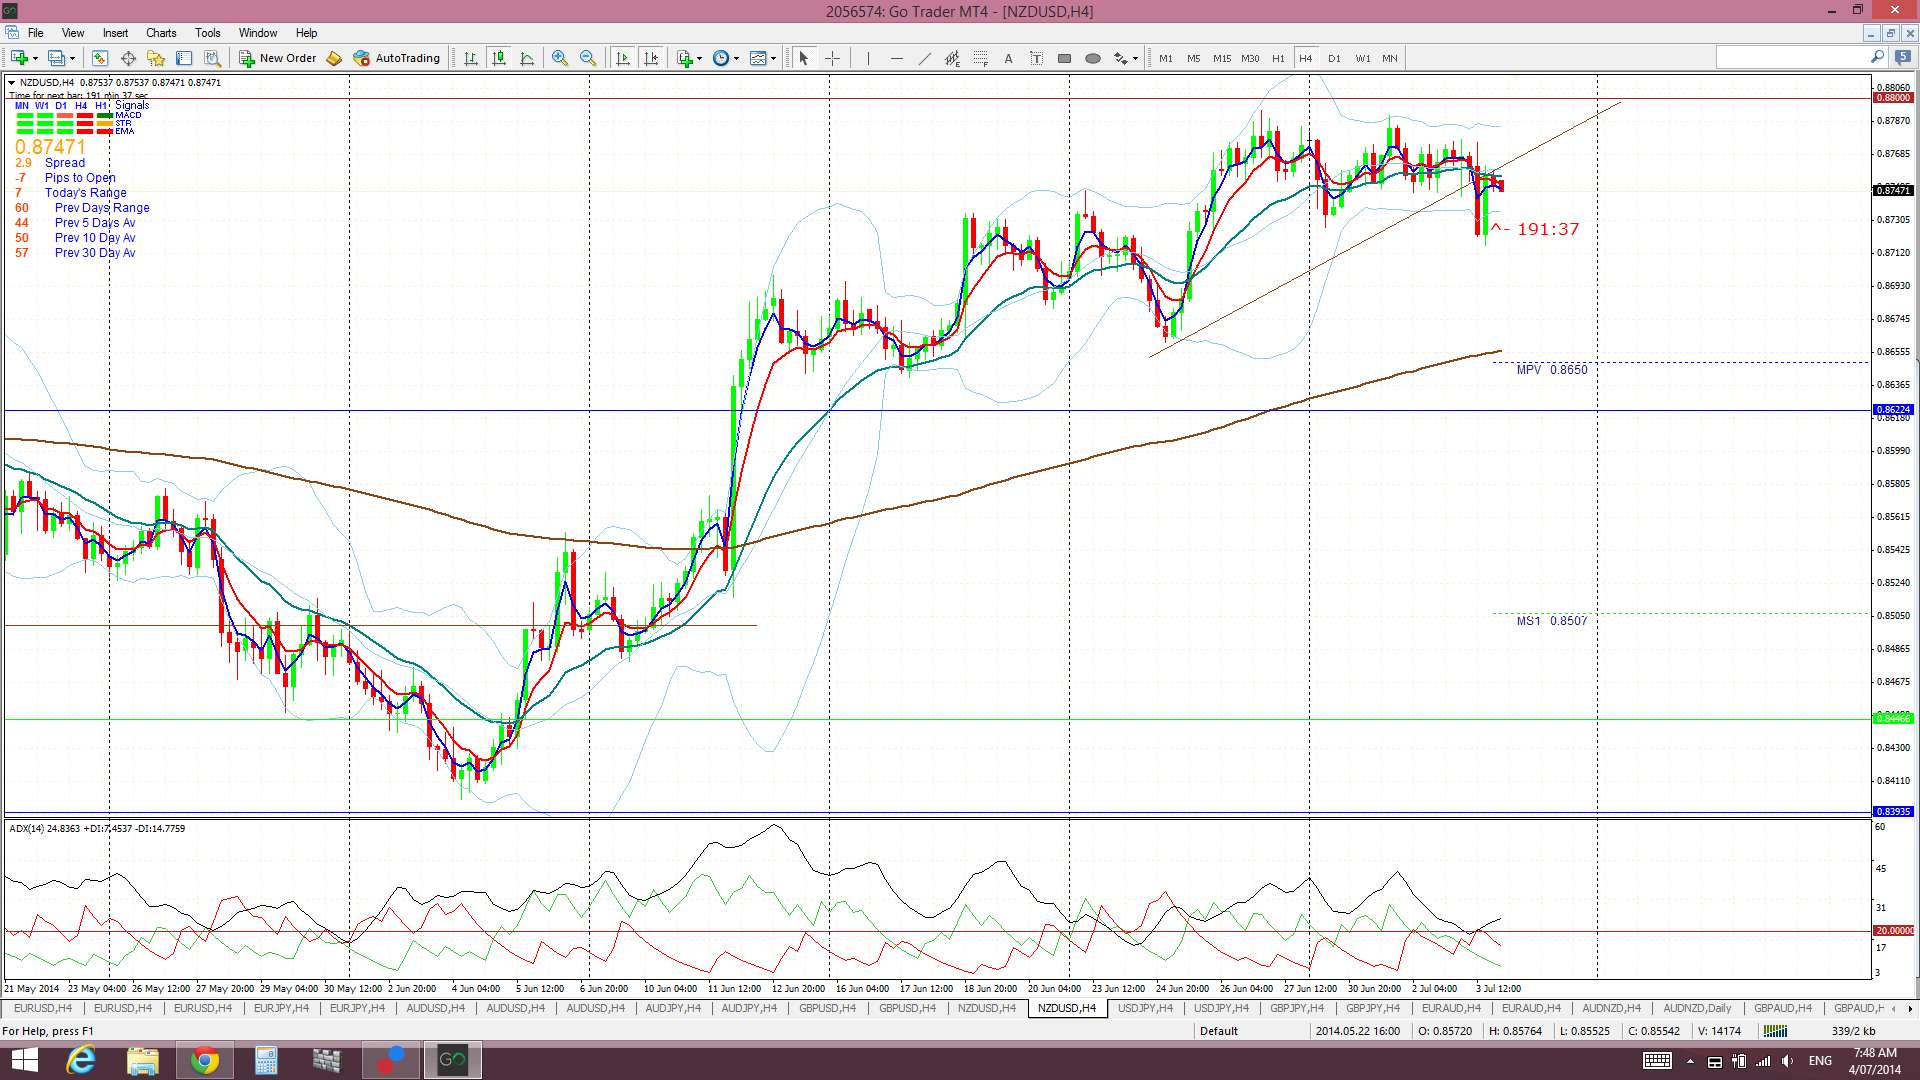
Kiwi: ditto here. The trend line has been broken but there hasn’t been much follow through just yet AND I don’t have any new TC signal:
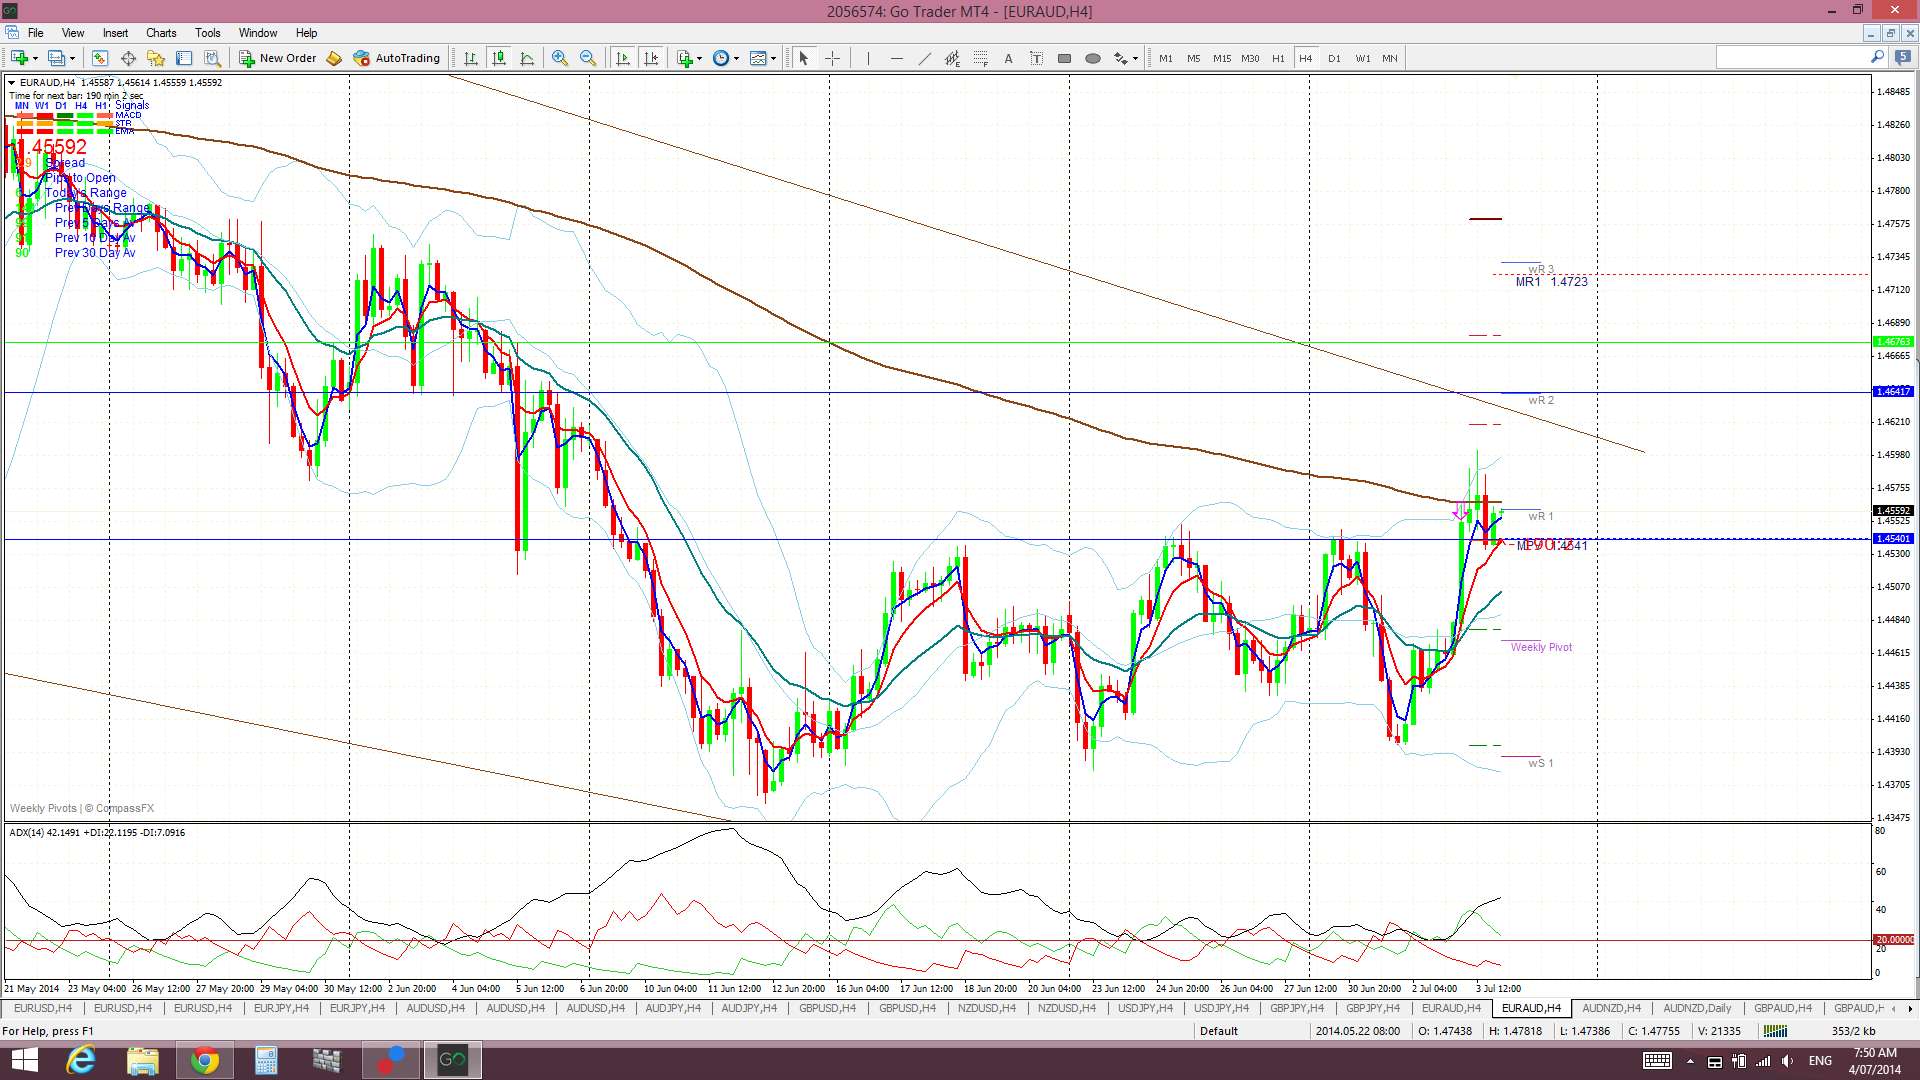
EUR/AUD: choppy given that both the EUR and AUD have weakened:
AUD/NZD: I’m still thinking this will test the region of the 1.05 lows again, at least!

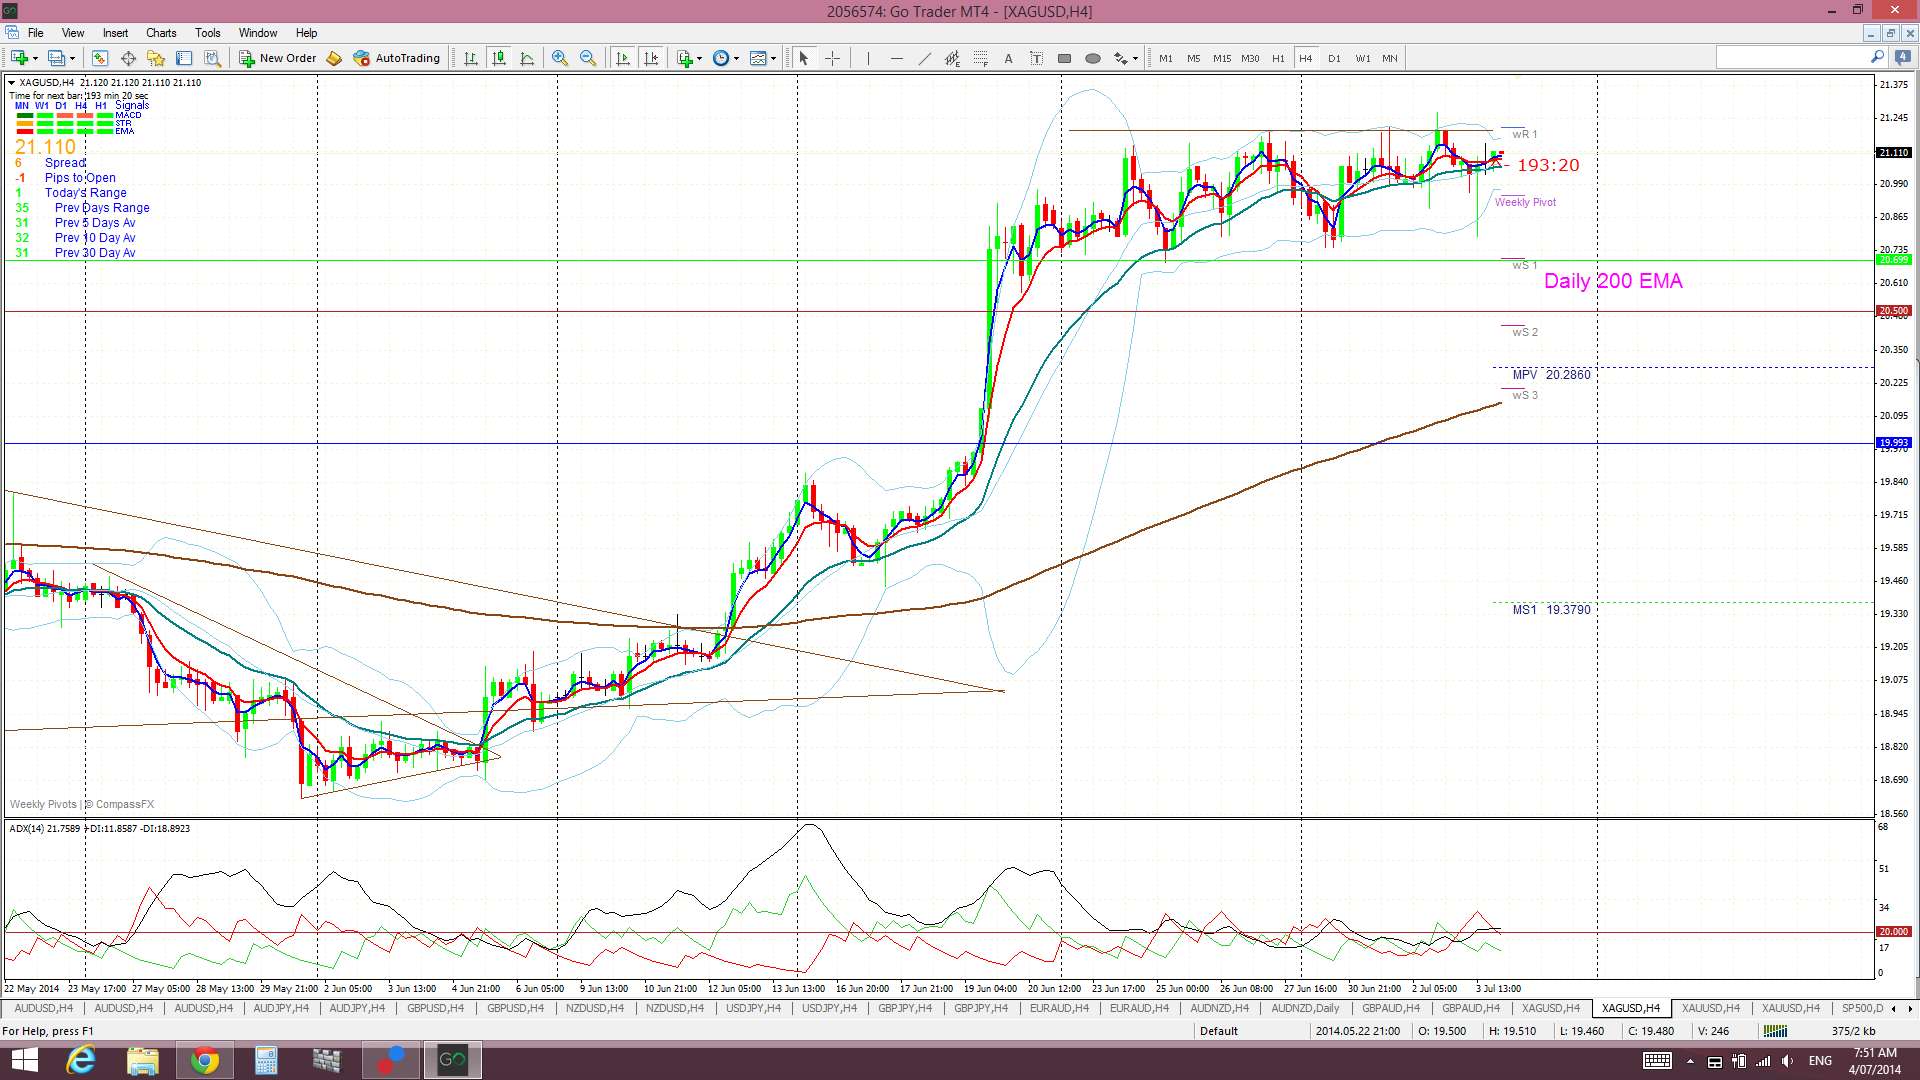
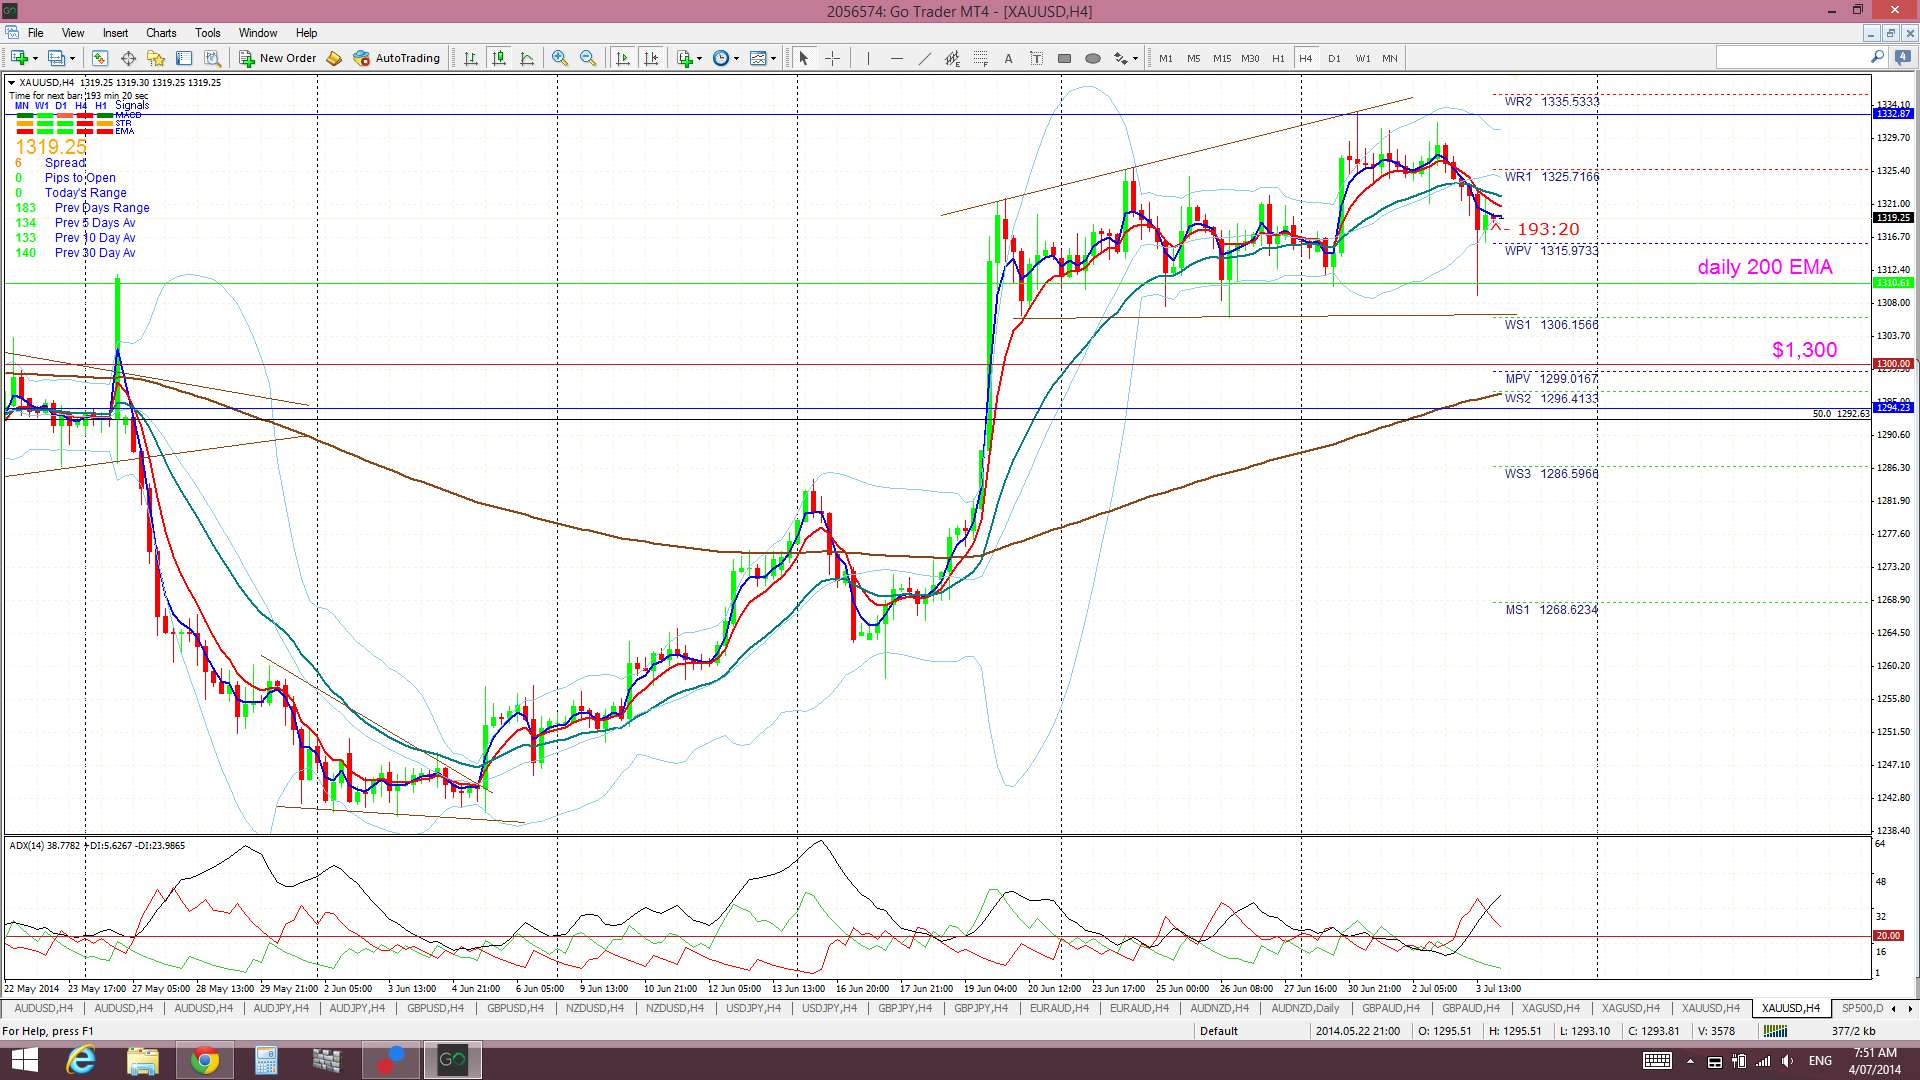
Silver and Gold: of some surprise is the fact that both of these have held up so well given the continued USD strength:
Silver: still channel bound. watch for trend line breaks:
Gold: ditto here:
Hi Mary,
I have just met your website and your account in twitter. I can see that you exert a lot of effort in preparing your suggestion. I will continue following you. Thanks for your effort.
What do you think of the Gold and USDJPY pair. How will they perform. Will Gold go down given the 4 hour graphic?
I will be posting my analysis of these two within my Trade Week Analysis a bit later on today.
Gold: I think this could suffer if the USD keeps rallying so watch for trend line breaks and new momentum.
U/J: a stronger USD should help this pair and so should stronger stocks. The question here though is: if the USD weakens but stocks keep rallying …what then for the U/J? That, I’m not sure about and would simply watch for any new trend to develop and tag along with it.
Excellent Mary. Keep it up.
Thanks Nachiket!
Glad to see some feedback.
Cheers,
Mary