


Tesla (TSLA) has certainly been an interesting stock to monitor this year; check out the large bearish yearly candle in the first chart below. Charting / Technical analysts will be the first to emphasise that charts patterns, regardless of the trading instrument, do not continue in one direction unabated but, rather, they ebb and flow their way along even if in an overall uptrend. They will also emphasize that traders should look for any obvious reason for a marked change in share price direction and whether this is more technical in nature or due to some fundamental change in the underlying business of the stock or entity.
Technical reasons for a decline in a share price may simply be due to trend exhaustion; where buyers of the particular stock or entity pause in their activity after a lengthy purchasing run or where the entire stock market pauses for much the same reason. It may be that nothing has changed with the success story of the core business of the individual stock or entity but that momentum has just temporarily waned.
Fundamental reasons for a decline in a share price can be more challenging and more difficult to recover from. Reasons can be many and varied and include examples where the core business of the stock or entity may lose market appeal for whatever reason (one example given here) or where a competitor enters the market (think Apple versus Android) and impacts market share or where a significant management decision results in a drop of product sales (one example here) that, if left unchecked, may go on to negatively impact the underlying share price.
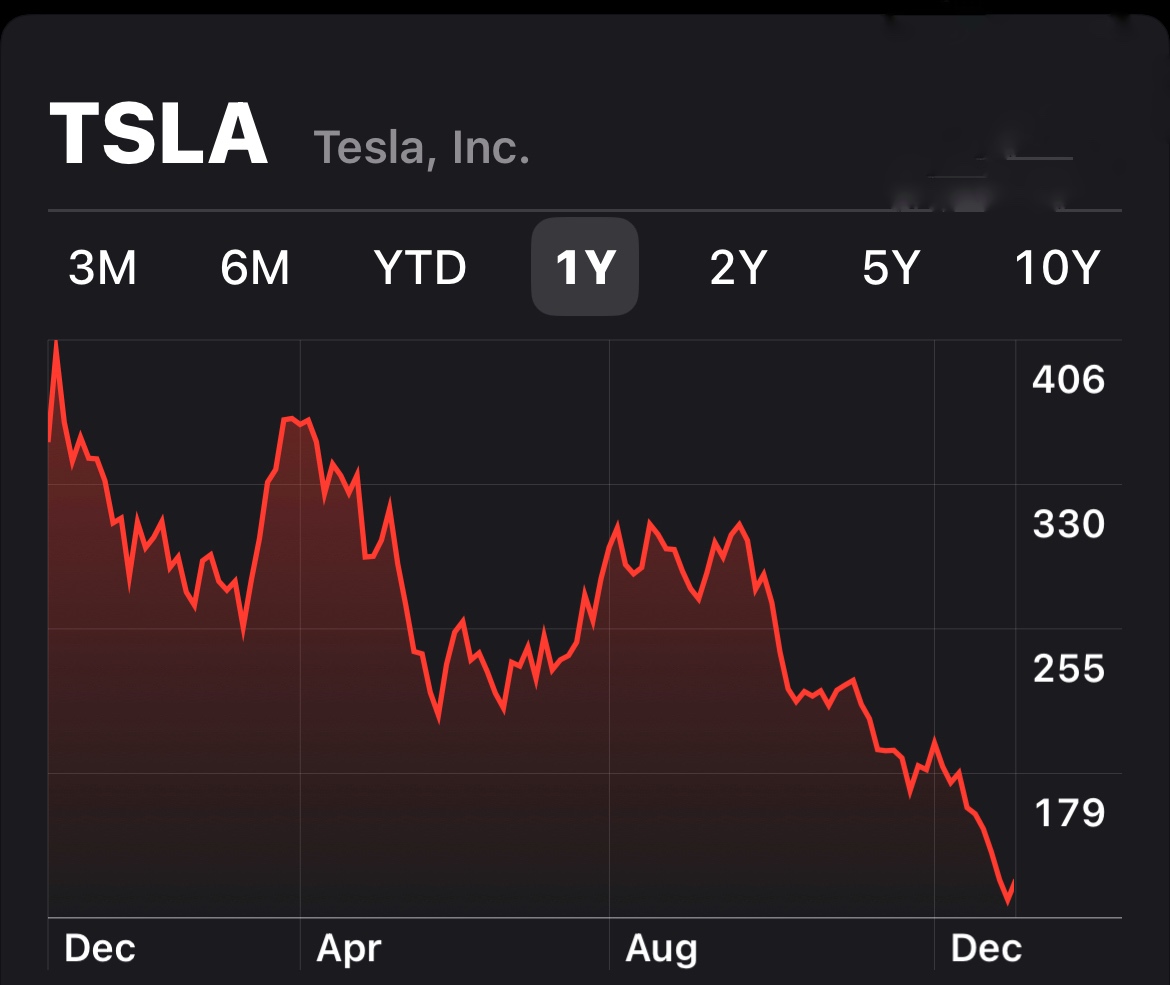
For Tesla, the share price declined 69% in 2022 with the stock having its ‘worst month, quarter and year on record‘. The CEO of Tesla, Elon Musk, blamed macroeconomic factors for this sharp decline however the NASDAQ tech index, whilst closing lower for the year as well, only declined 33.1%. Reasons for the Tesla shar price decline are quoted as ranging from CEO distraction triggered by Musk’s takeover of Twitter to increased competition in the Electric Vehicle (EV) market. Either way, both of these causes tend to fall under the umbrella of Fundamental reasons for the share price decline and may make it more challenging for Technical Analysts to adequately map the TSLA chart. I am going to give it a go however so read on, if interested, to see how I am assessing TSLA price action.
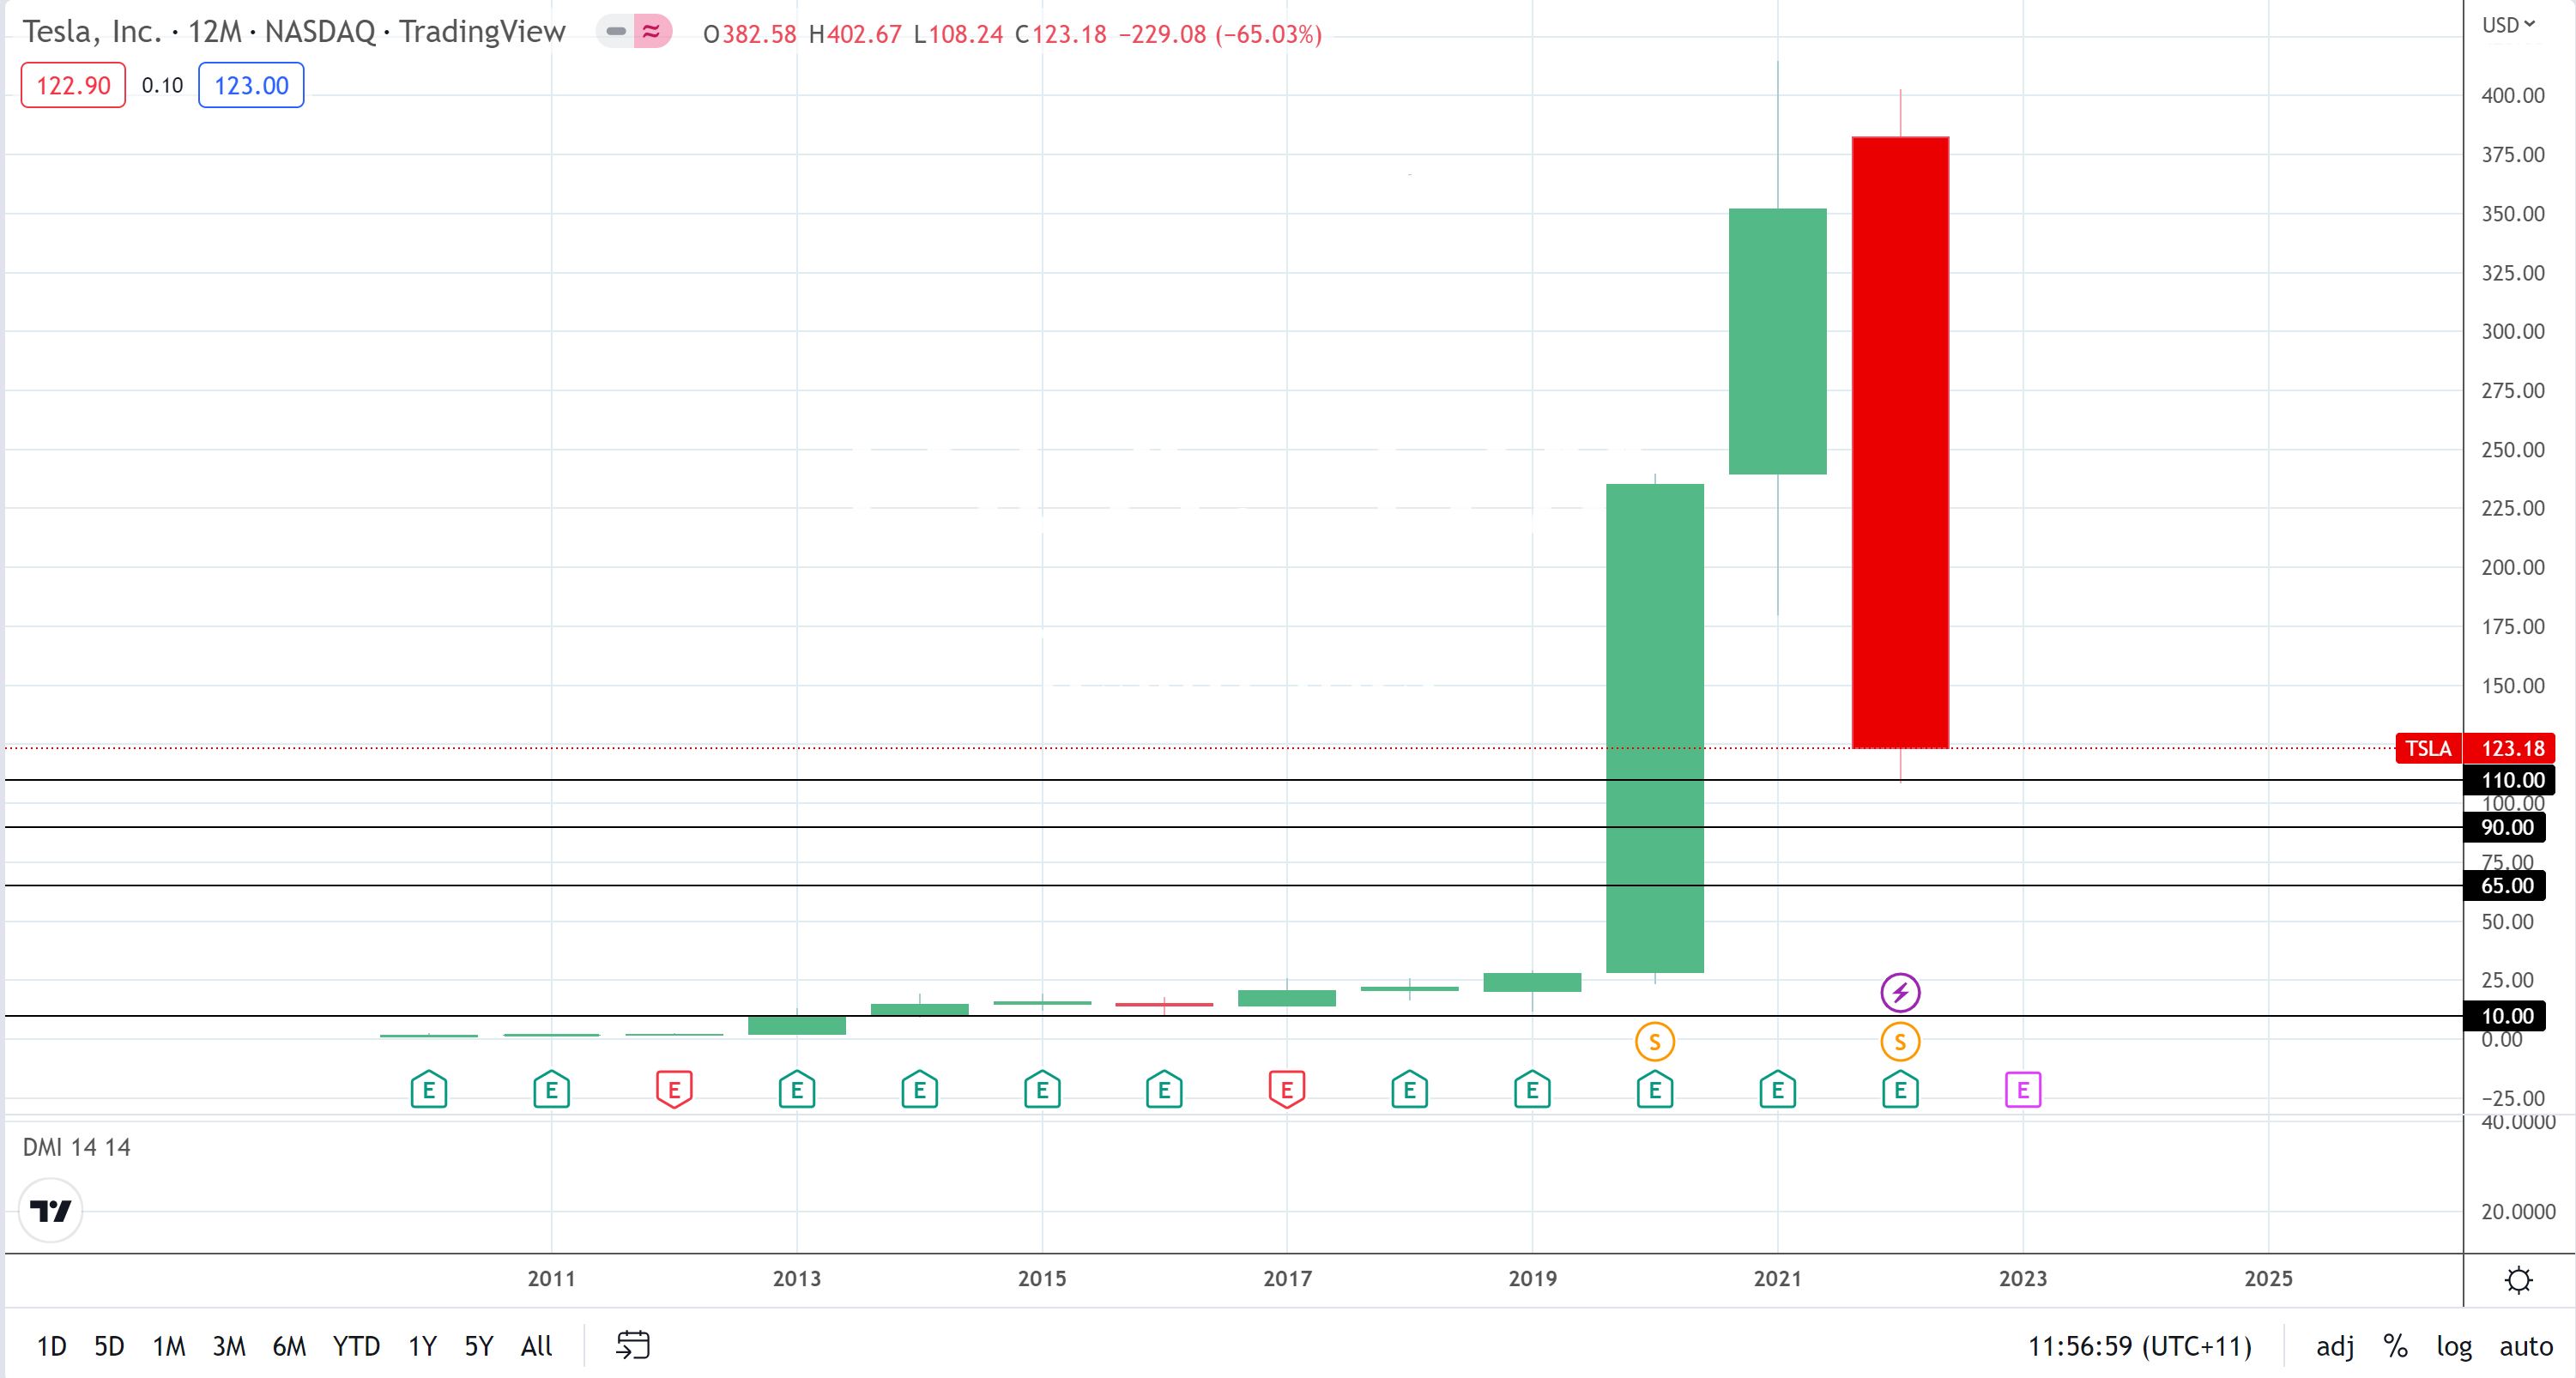
TSLA yearly: TSLA closed 2022 with a large and bearish, almost engulfing, yearly candle. The share price did manage to close above the 2022 low, of circa $110, though.
(NB: I have horizontal lower Support trend lines drawn in that will make more sense when viewed on the weekly time frame charts).
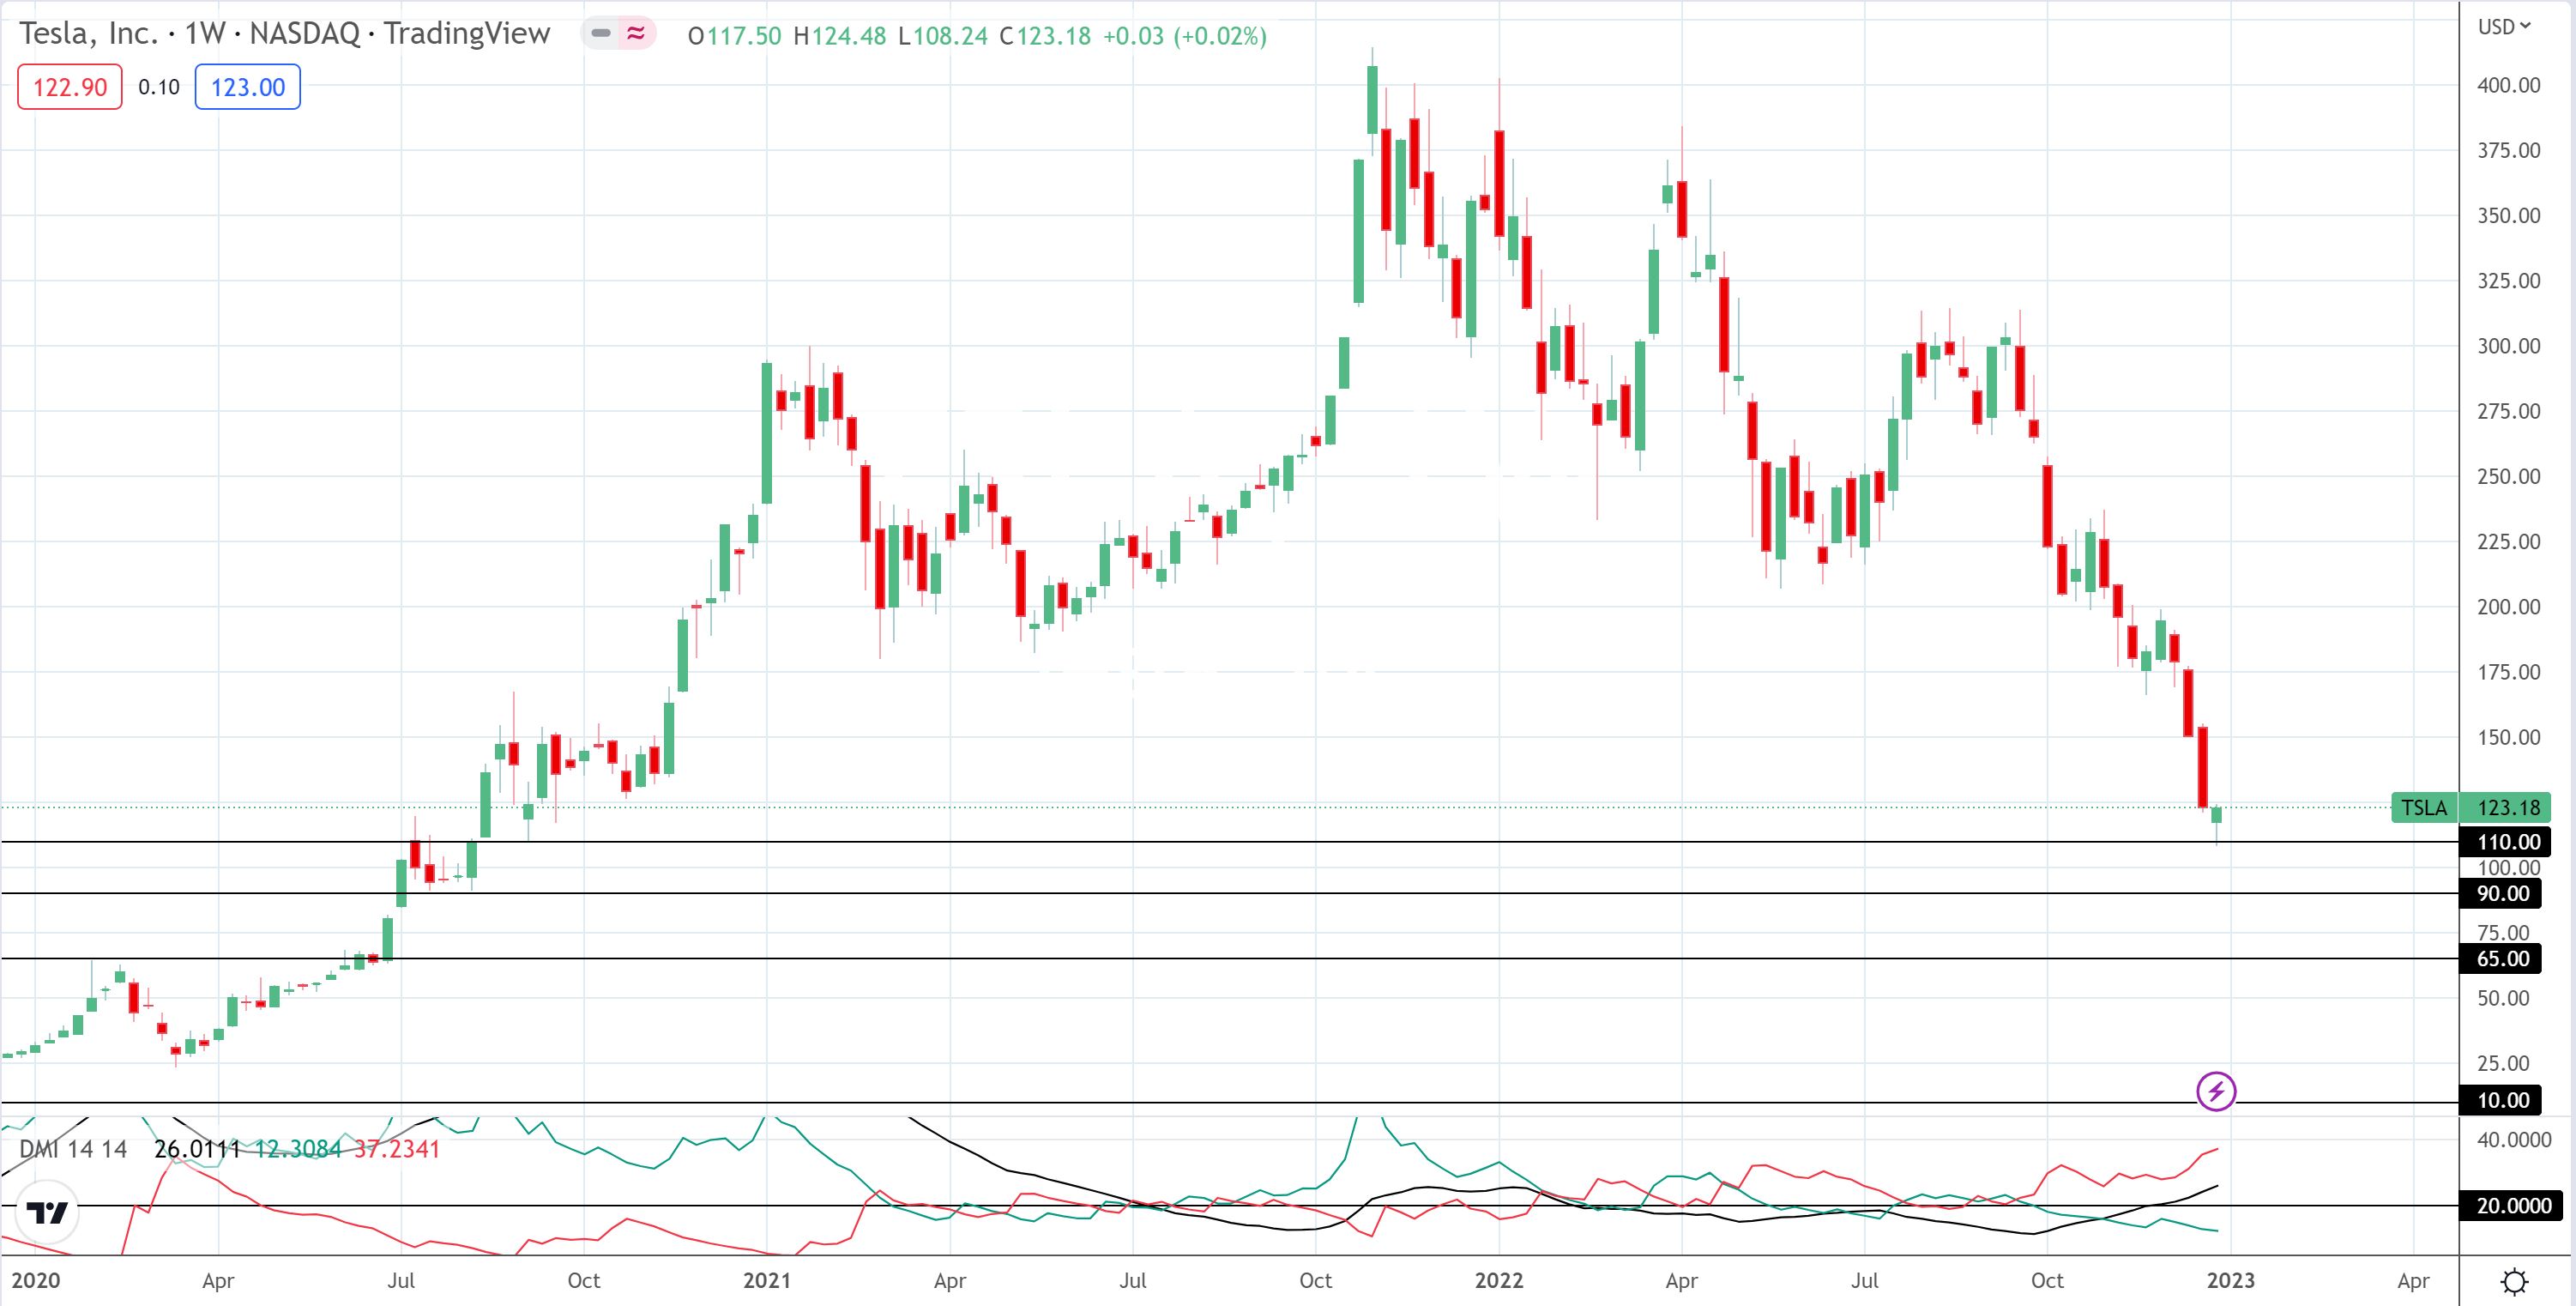
TSLA weekly: the weekly chart below has support trend lines drawn in for levels below current price. There seems to be support, by way of evident price reaction, at around the $110, $90 and $65 levels. Interestingly, the last weekly candle for the year bounced up from the $110 support level and closed with a bullish-reversal Hammer candle. The ADX indicator, in the pane at the bottom of the chart, shows that bearish, or selling, momentum is on the rise on the weekly time frame so this $110 threshold would be the first ‘line in the sand’ level to watch as trading resumes in the New Year. Any movement below $110 would then bring the $90 and $65 levels into focus as these have been previous reaction zones.
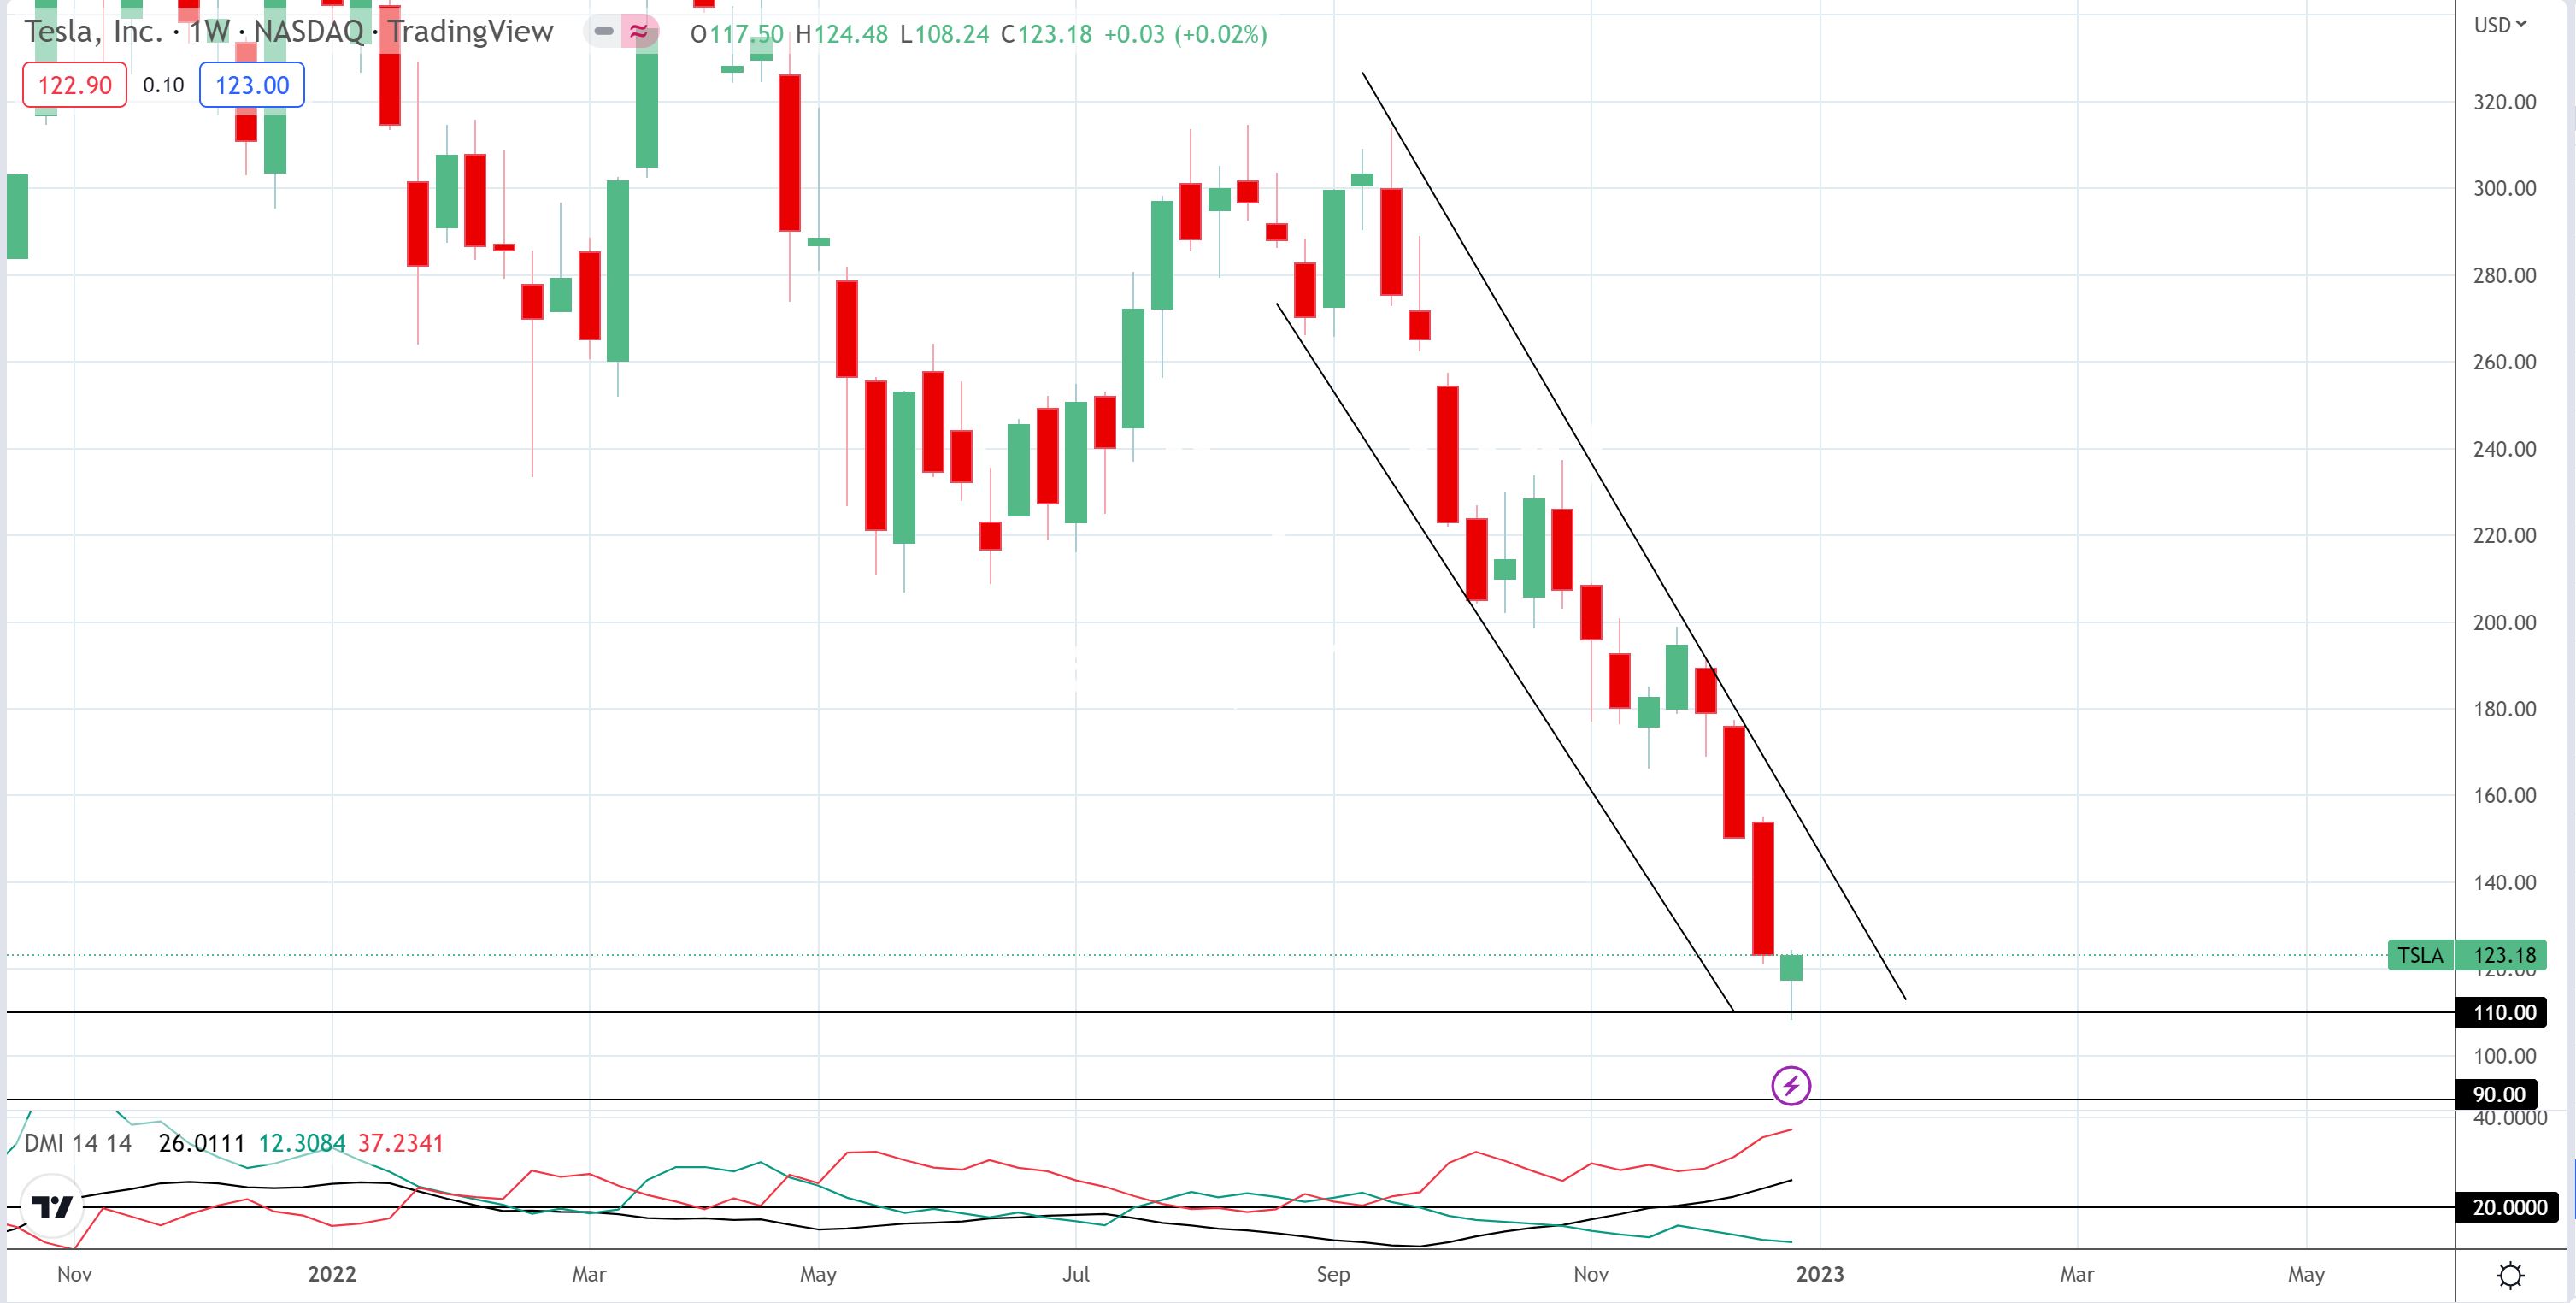
TSLA weekly 2: the chart below is just an expanded version of the weekly chart above but I have included channel trend lines on the most recent down trend. These trend lines would also be worth watching for any breakout, either up or down, as well as the $110 support level.
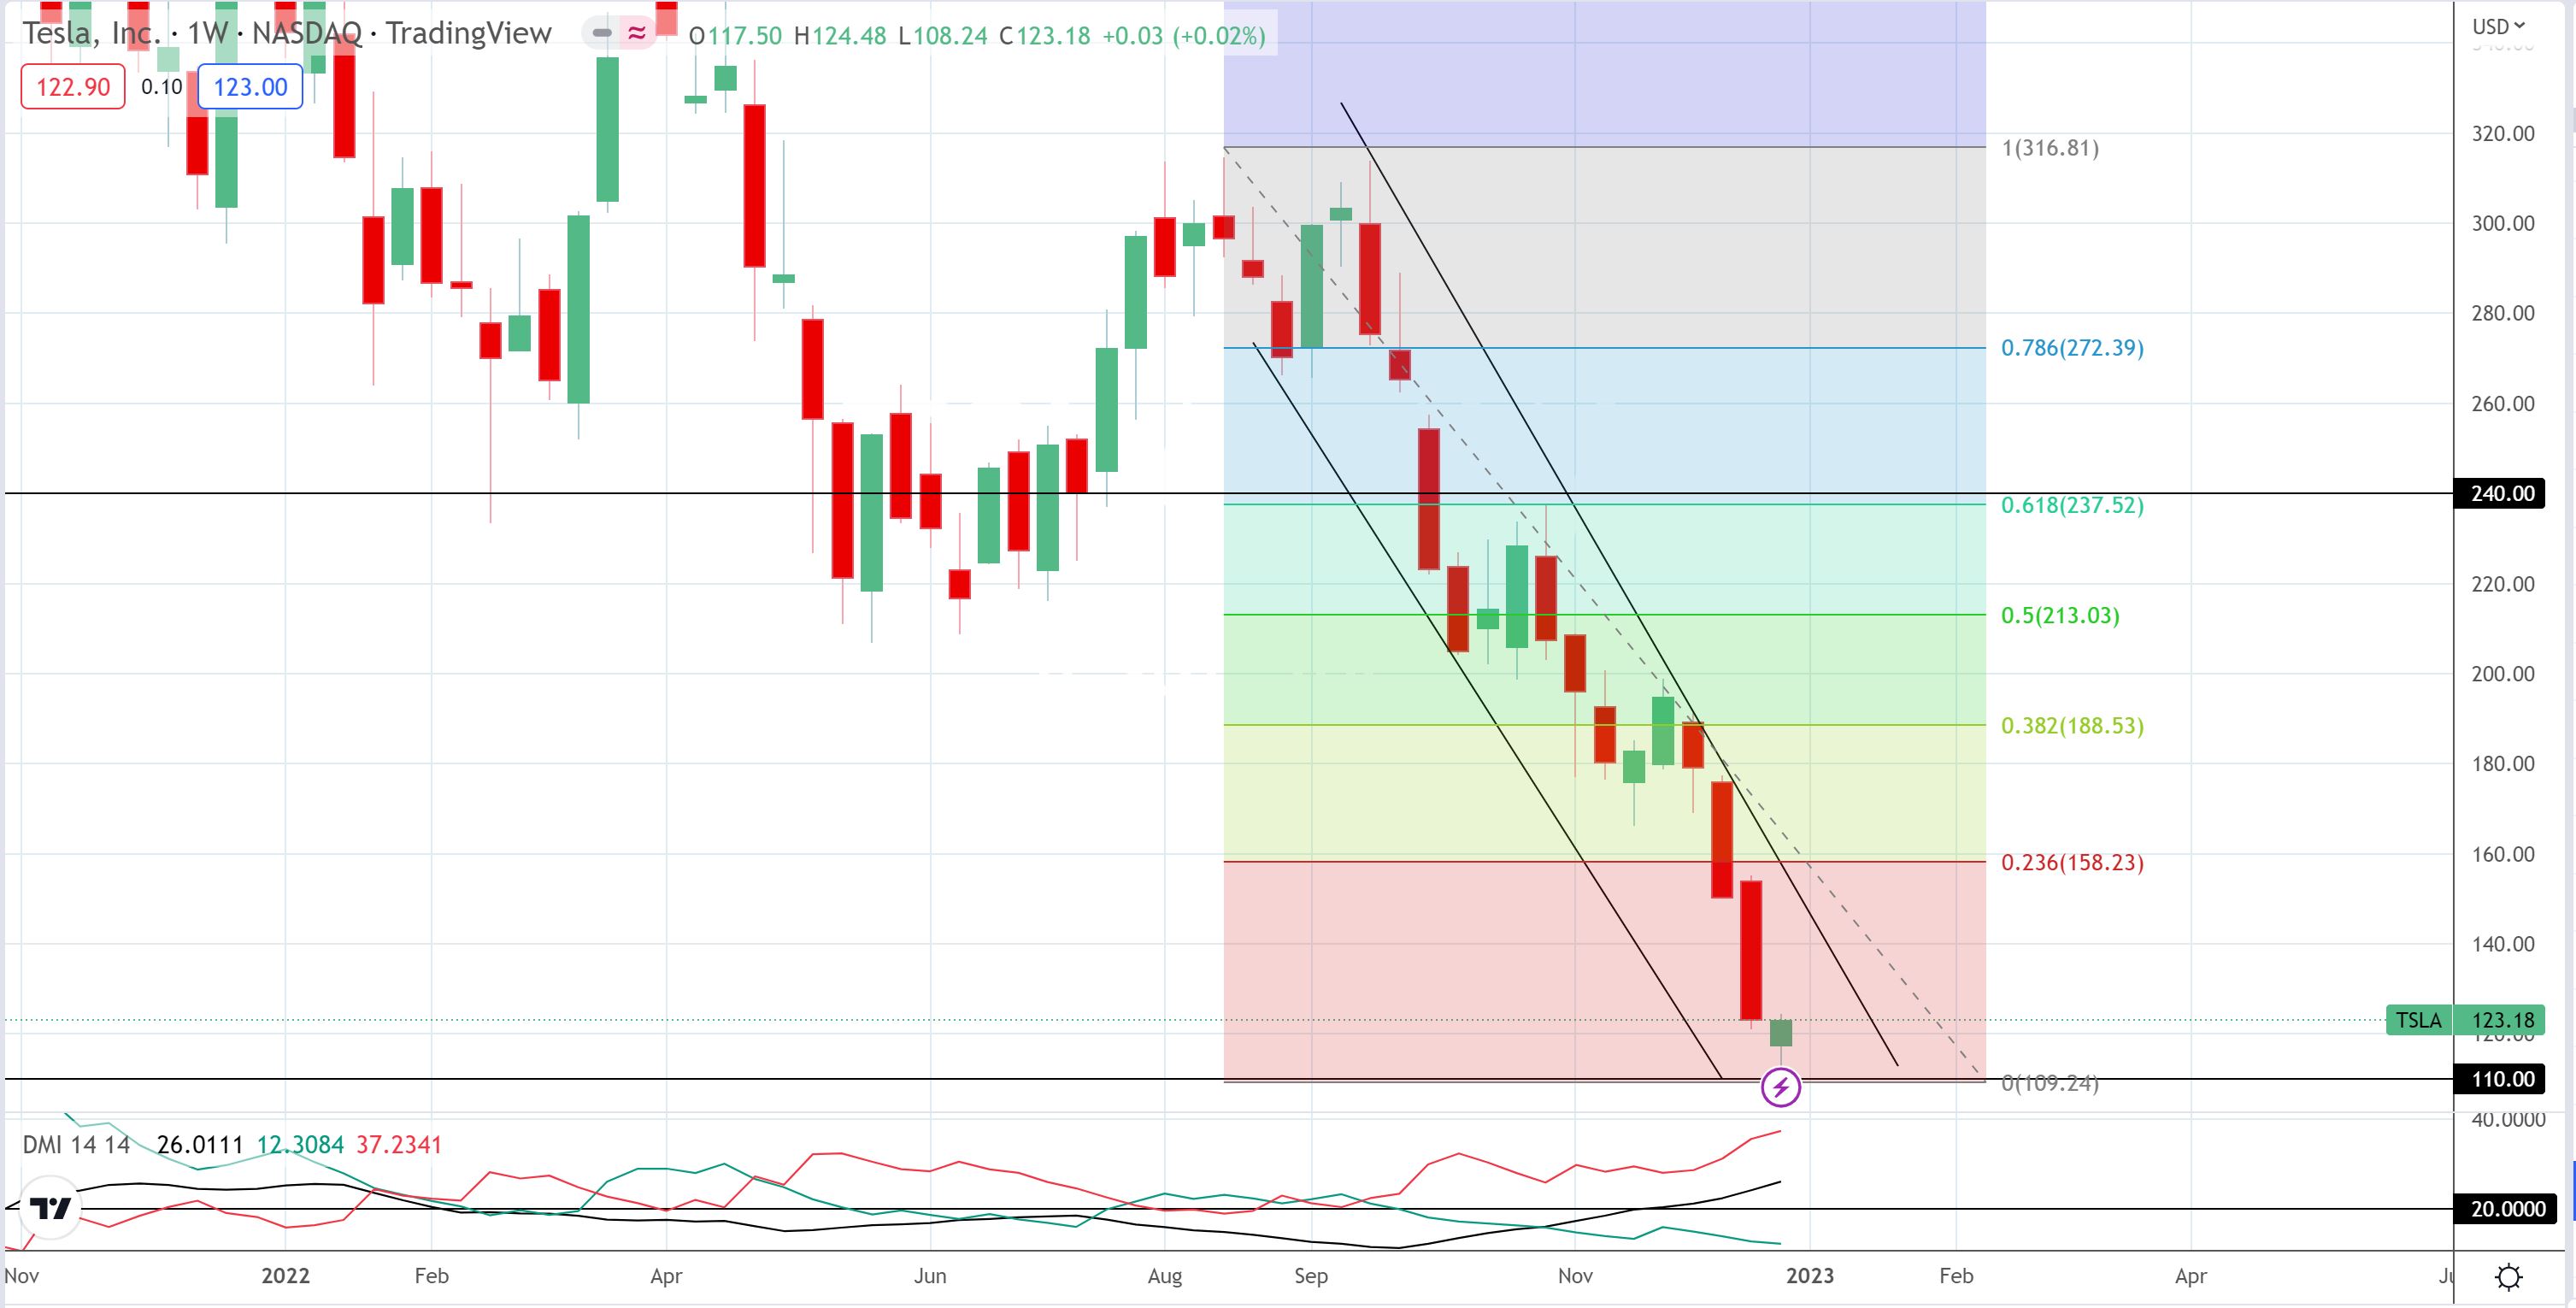
TSLA weekly 3: the chart below shows much the same weekly chart as above but with the addition of a Fibonacci retracement tool mapping the recent downtrend. The Fibonacci retracement tool can be useful to help with identifying targets for any bullish breakout and recovery. The 61.8% level is a popular level mapped by technical analysts and it is uncanny how many times this level is reached in bullish price breakouts; some examples of this can be found here. The 61.8% Fibonacci level for this downtrend is up near the $240 level and would be one longer-term target to monitor IF price action continued to bounce up from $110 AND made a bullish breakout from the descending trading channel. Any continued bullish move above $240 would then bring the recent high, of circa $320, back into focus followed by the previous all time high of circa $400. The $200 is a whole number and psychological resistance level that would need monitoring as well.
Concluding comments:
Tesla’s share price suffered a serious decline throughout 2022 and closed the year just above $110 support. No one can predict with any certainty how price action will move from this point. The best one can do is to monitor key support levels for any momentum based new movement; whether that be up or down. In my opinion, the $110 value is the ‘line in the sand’ level to monitor for the start of 2023:
- Any bullish recovery above $110 would bring the upper bear trading channel trend line into focus followed by $200, $240, then $320 and followed by $400.
- Any failure to hold $110 would bring the $90 and $65 levels into focus.