


Tesla stock and Elon Musk often make the headlines but this latest TSLA news caught my attention. This being the bearish bet on TSLA stock taken by the Big Short’s Michael Burry. With this in mind, I thought I would assess the charts of TSLA to identify potential Support levels and Targets for any bearish pullback.
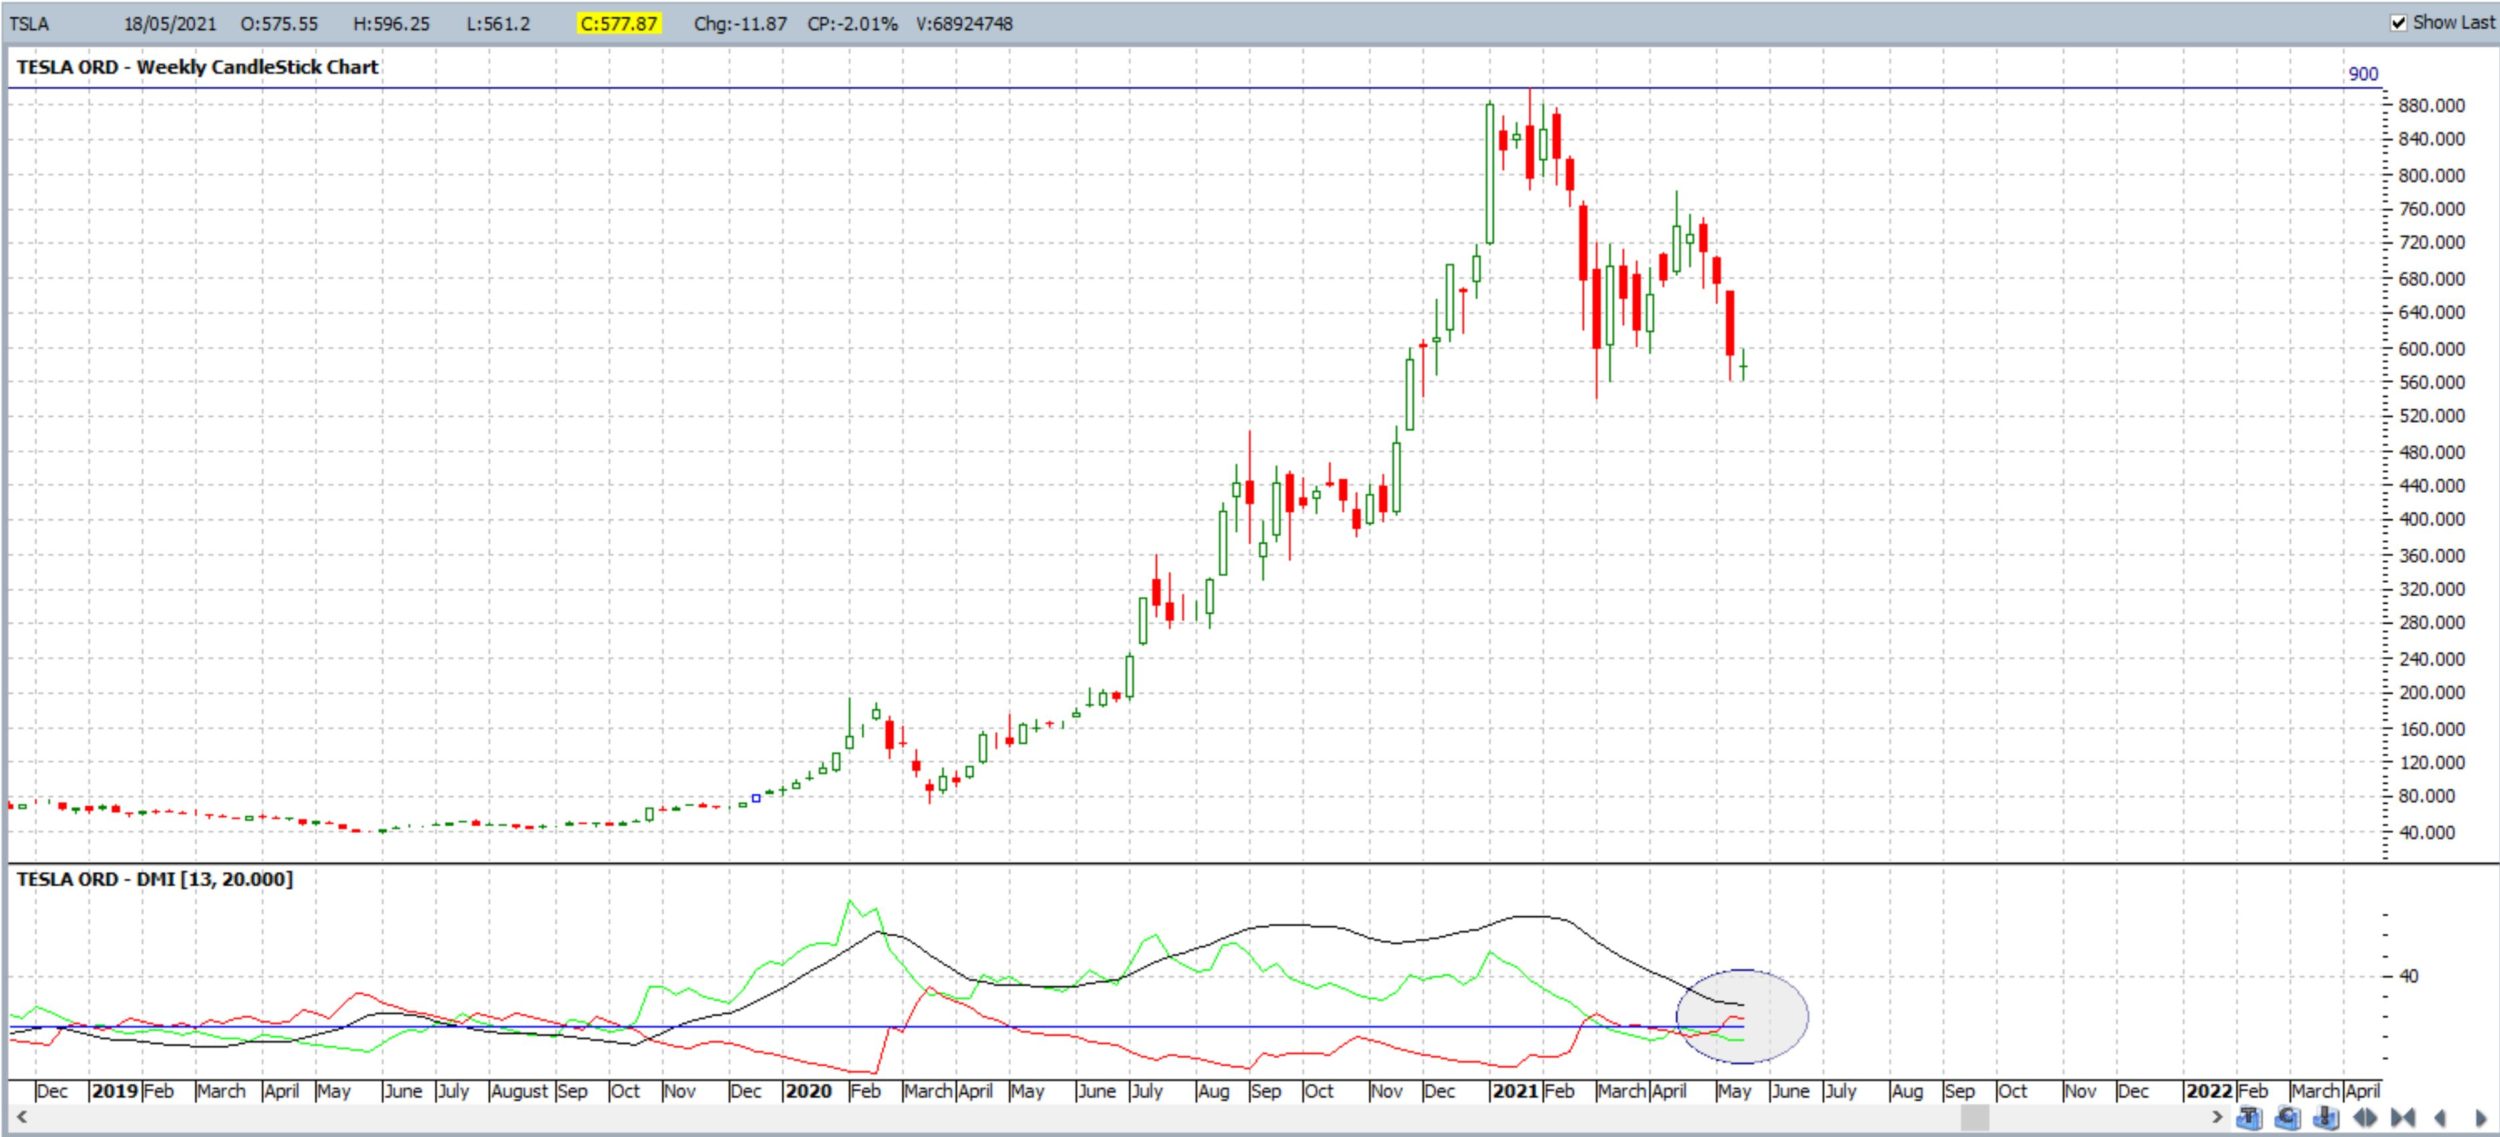
TSLA weekly: the weekly chart below reveals that price action peaked near $900 in January this year. Bullish momentum (+ DMI) has been in decline since then and remains below the 20 threshold whilst bearish momentum (-DMI) is now above 20:
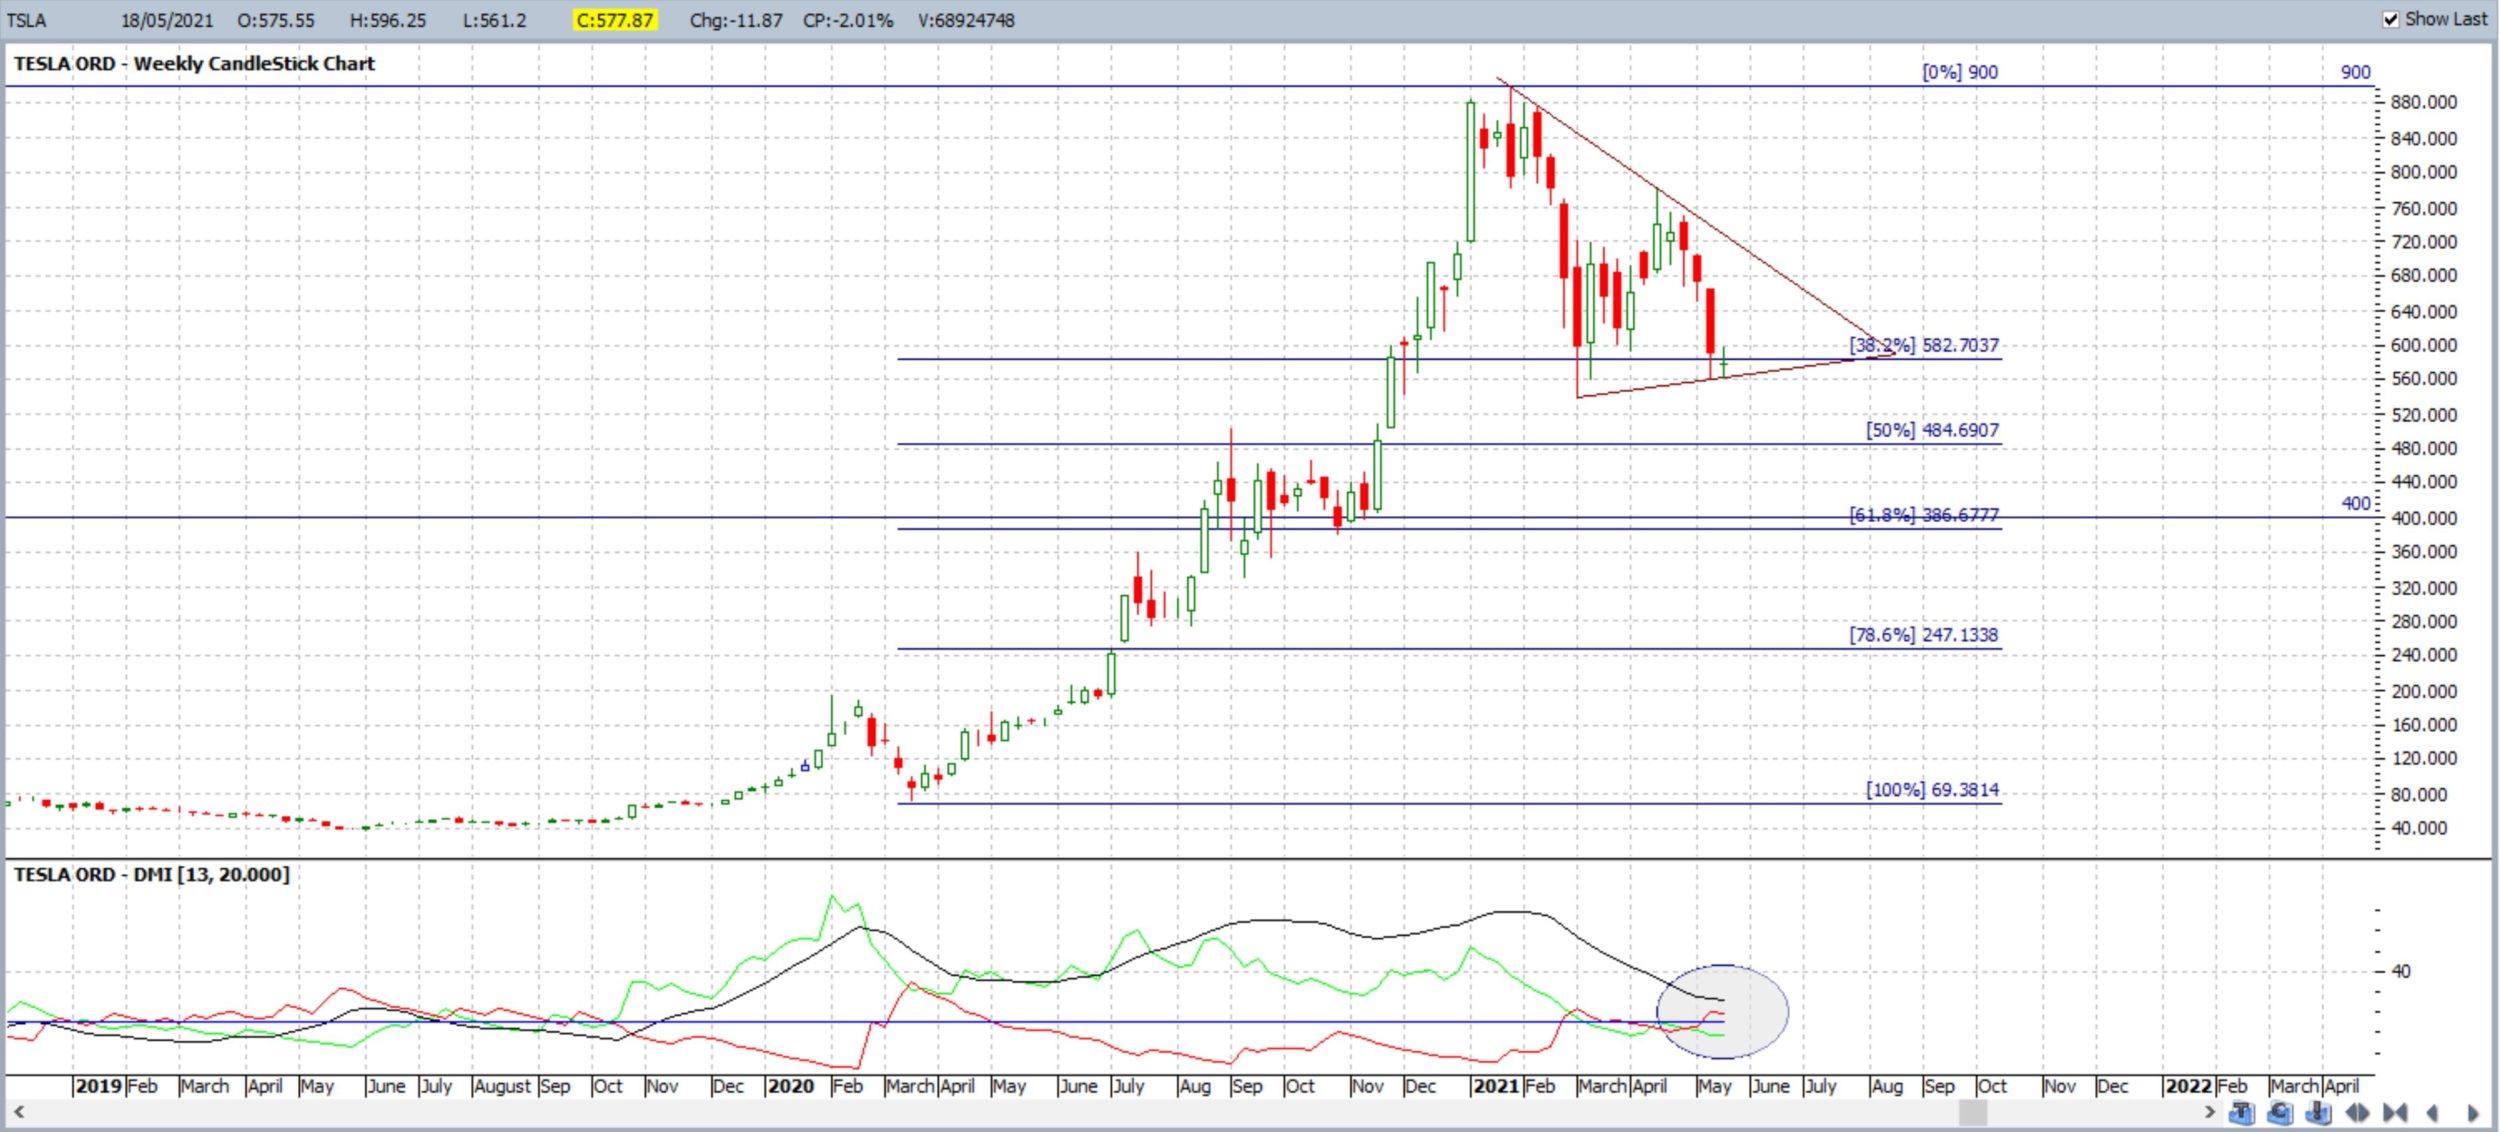
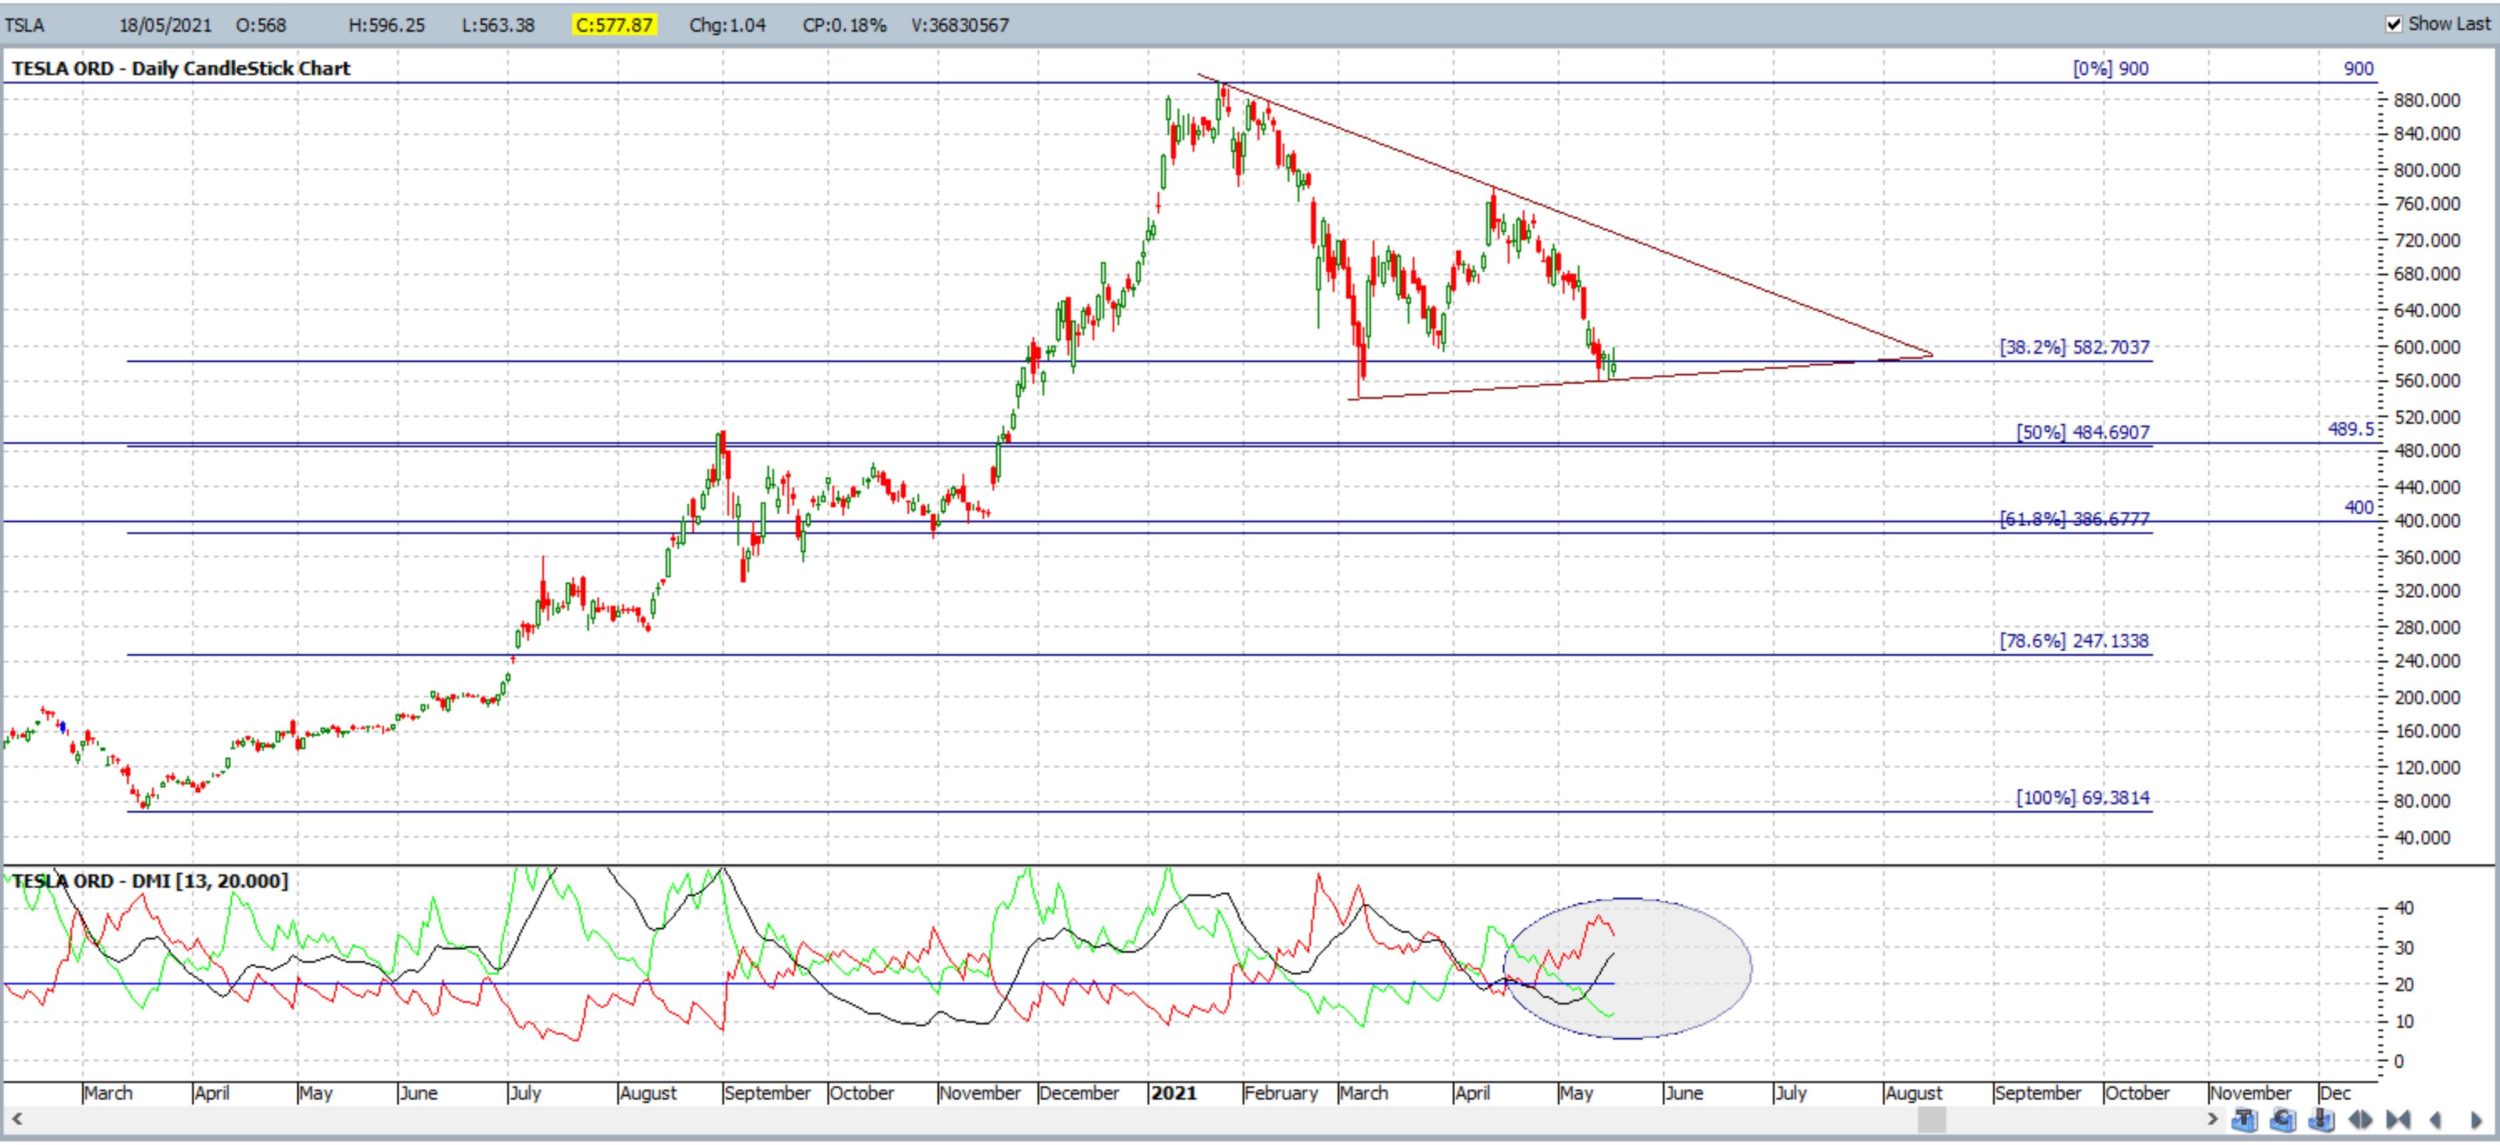
TSLA weekly + Fib retracement: applying trend lines to the chart shows that price action is trading with a congestion-style triangle. The popular 61.8% Fibonacci retracement level of the March 2020-Jan 2021 swing High move is down near $400 and this is also a reaction zone for the stock. Any momentum-based bearish trend line breakout would bring $400 into focus as one target:
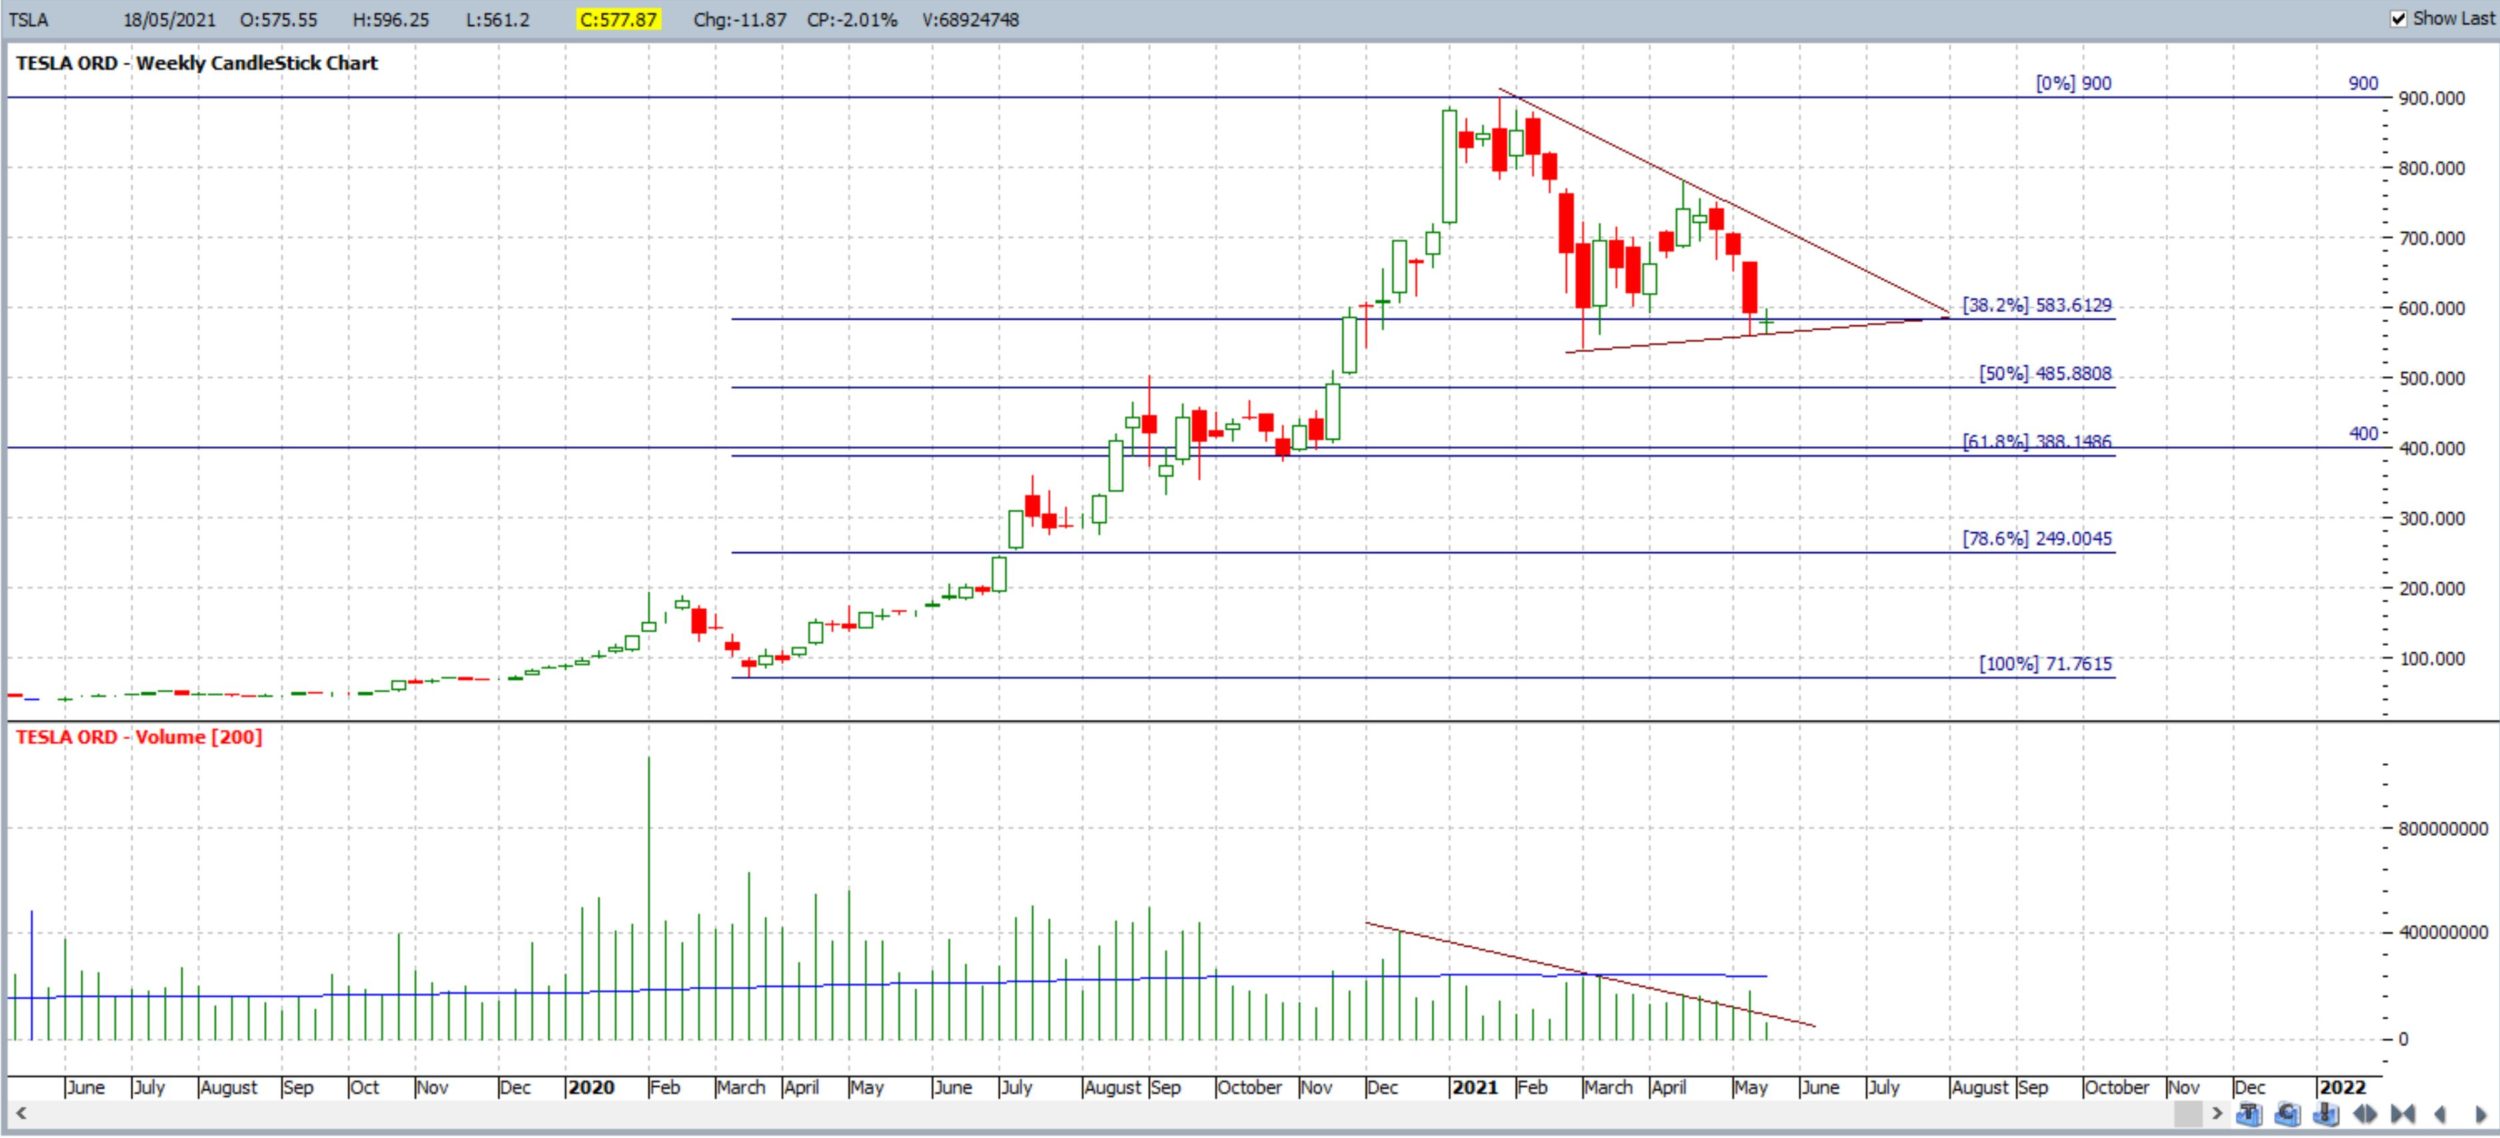
TSLA weekly + Volume: note how volume spiked higher last week so watch for any follow-through:
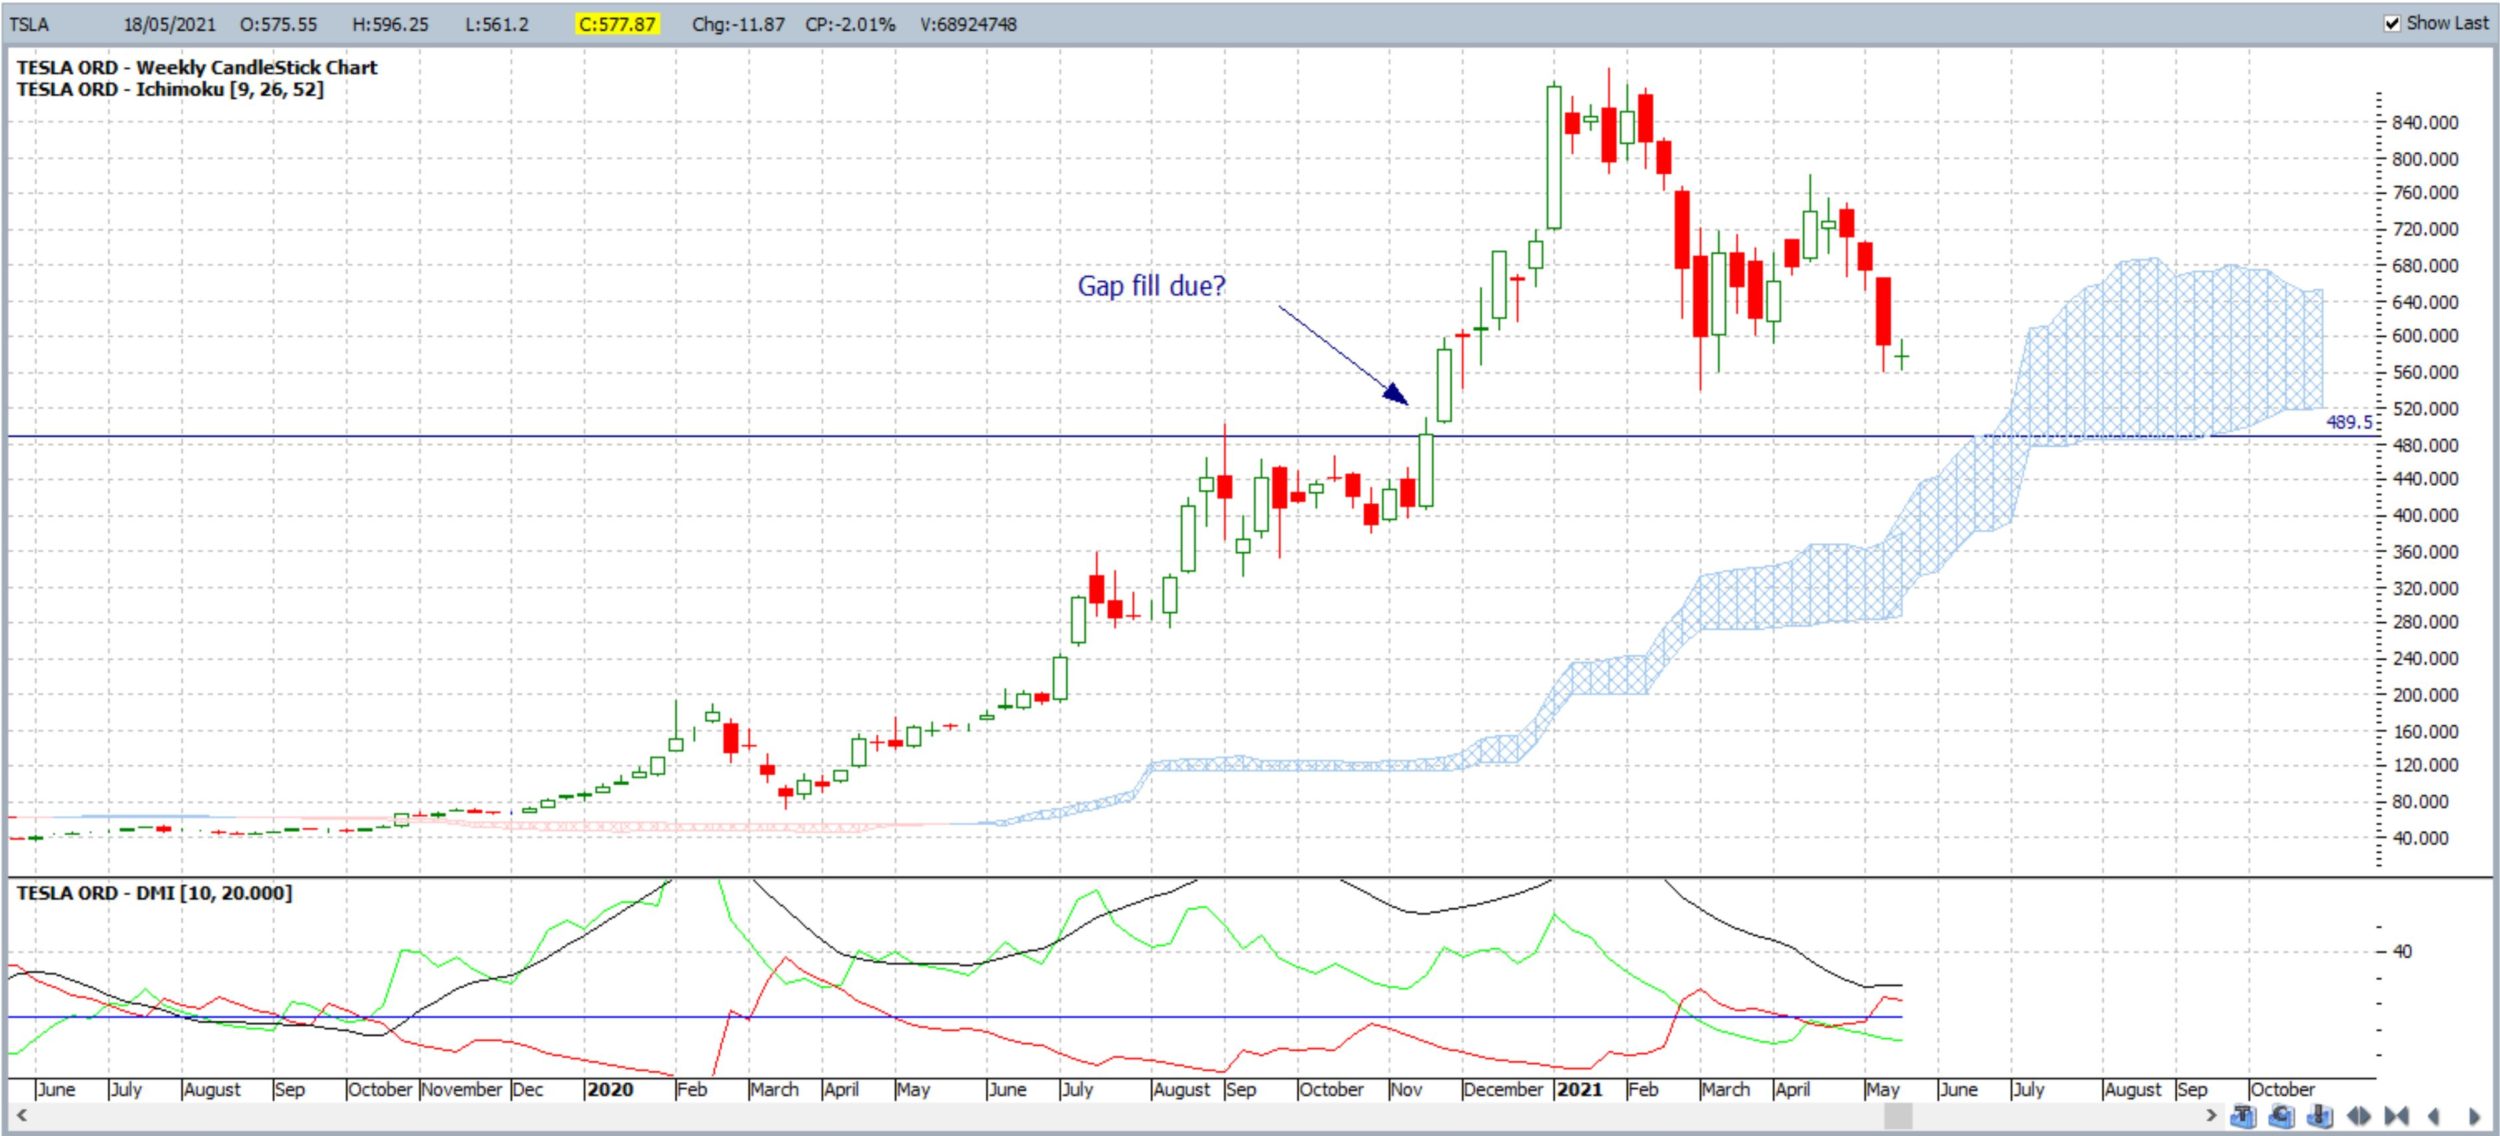
TSLA weekly + Ichimoku: price action is holding above the Weekly Ichimoku Cloud. Note, also, the potential gap-fill level near $489.50. This would also be a potential target if price action continues to recede:
TSLA daily: note how this gap fill level of $489.50 lies near the 50% Fibonacci level; confluence!
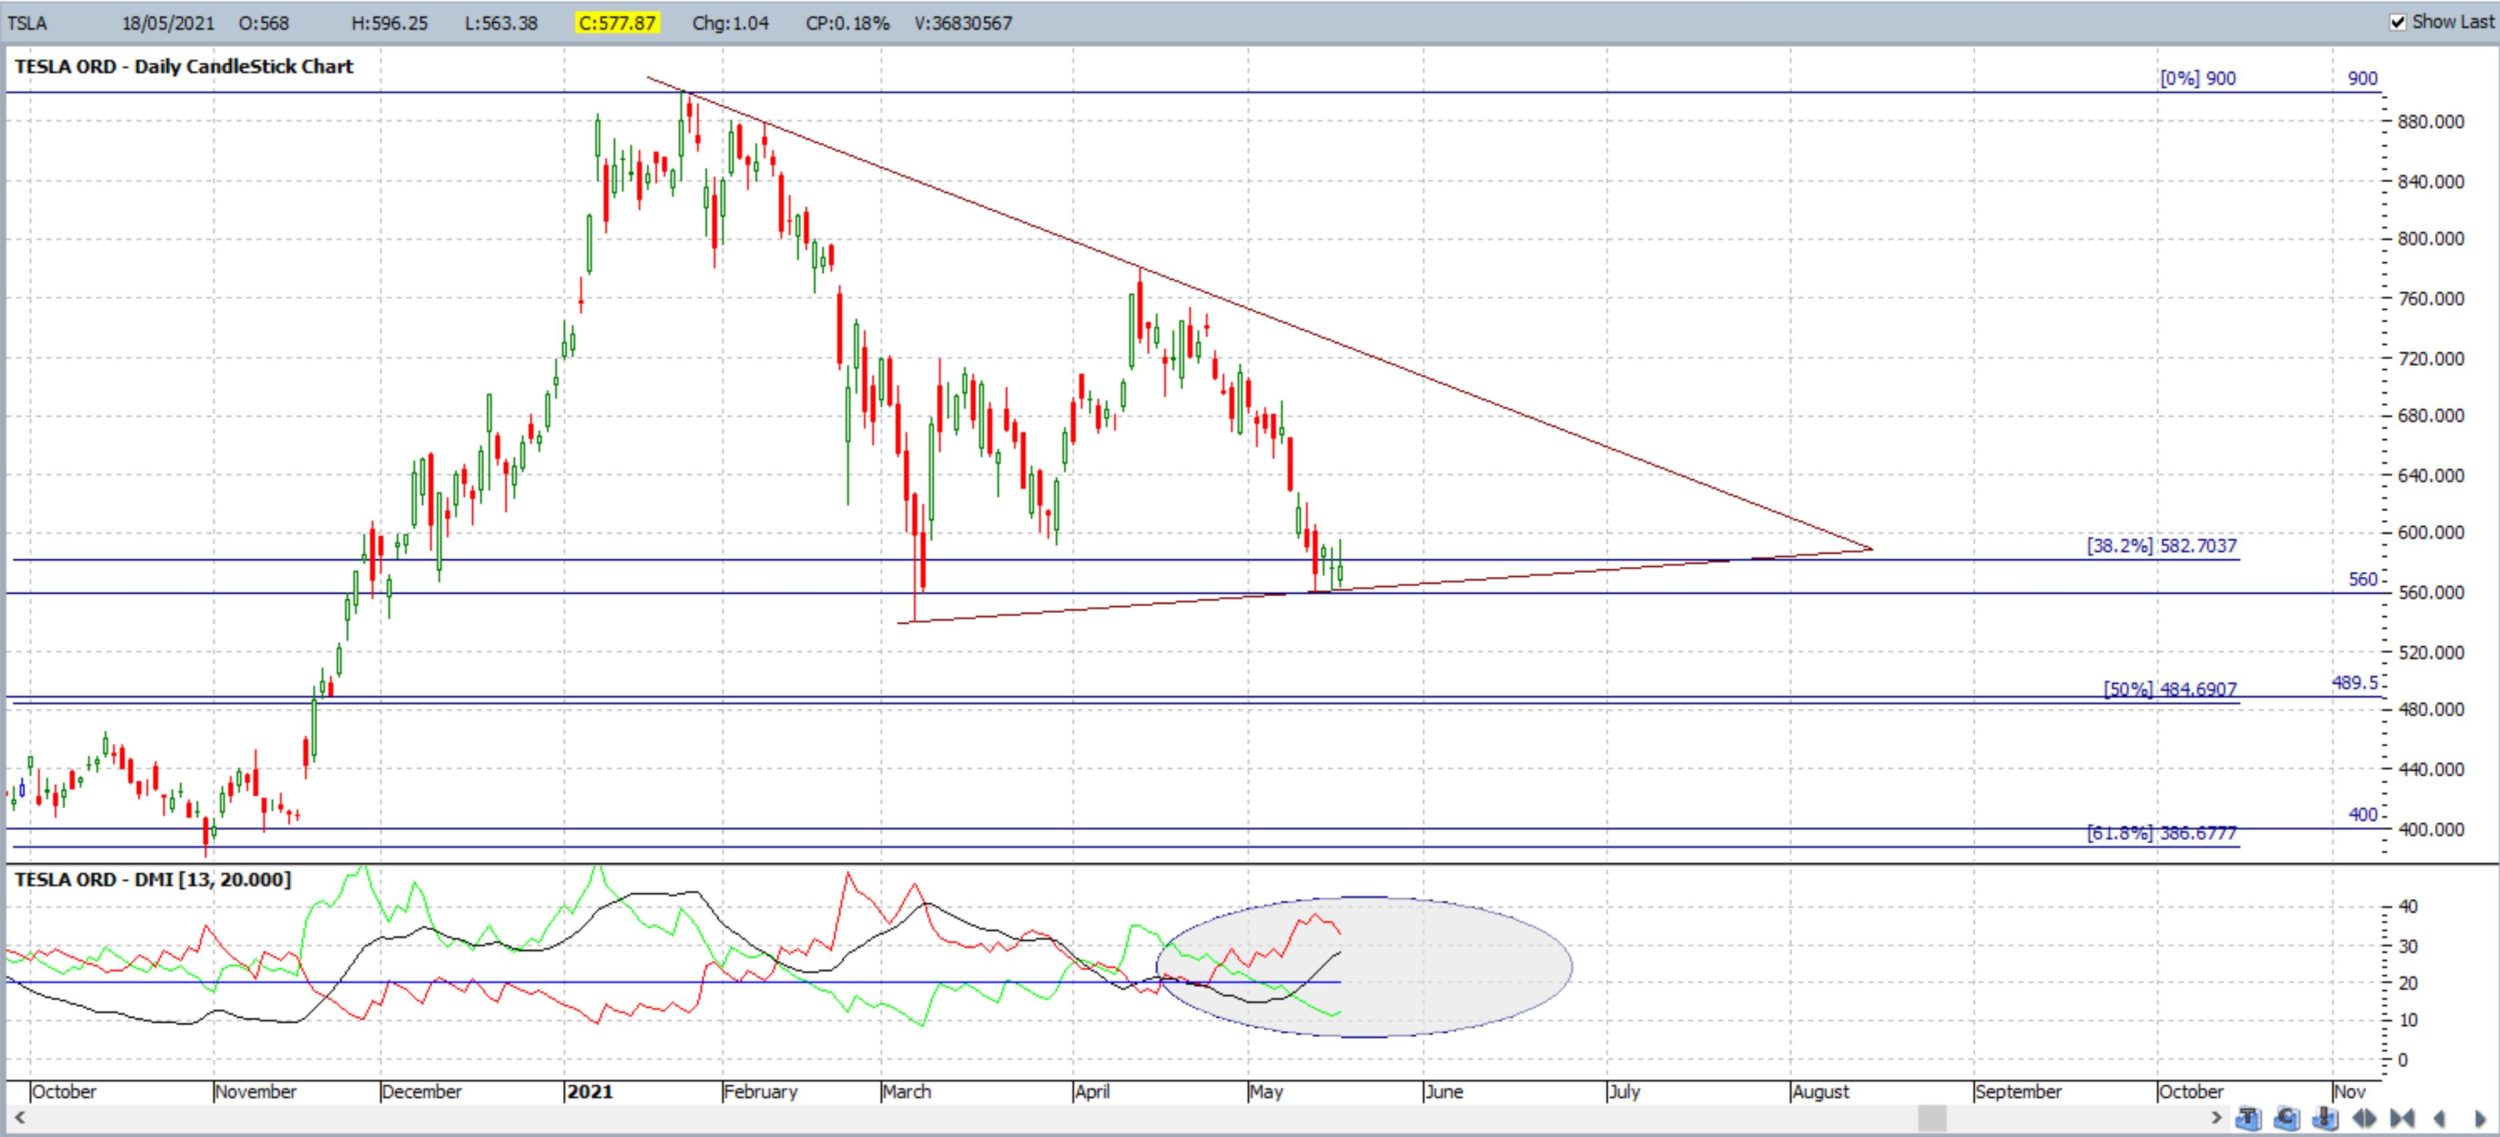
TSLA daily (expanded): an expanded view of the daily chart shows how the $560 level has acted as decent Support since November 2020.
Concluding comments: Micheal Burry has taken a bearish bet on TSLA but, for the time being, price action is consolidating sideways in a congestion-style triangle pattern.
Any break of this bottom support trend line would bring the following bearish targets into greater focus:
- $560: a horizontal Support region since November 2020.
- $489.50: the 50% Fibonacci retracement level and also a potential Gap Fill region.
- $400: the 61.8% Fibonacci level and a recent area of reaction.