Thurs 25th Sept
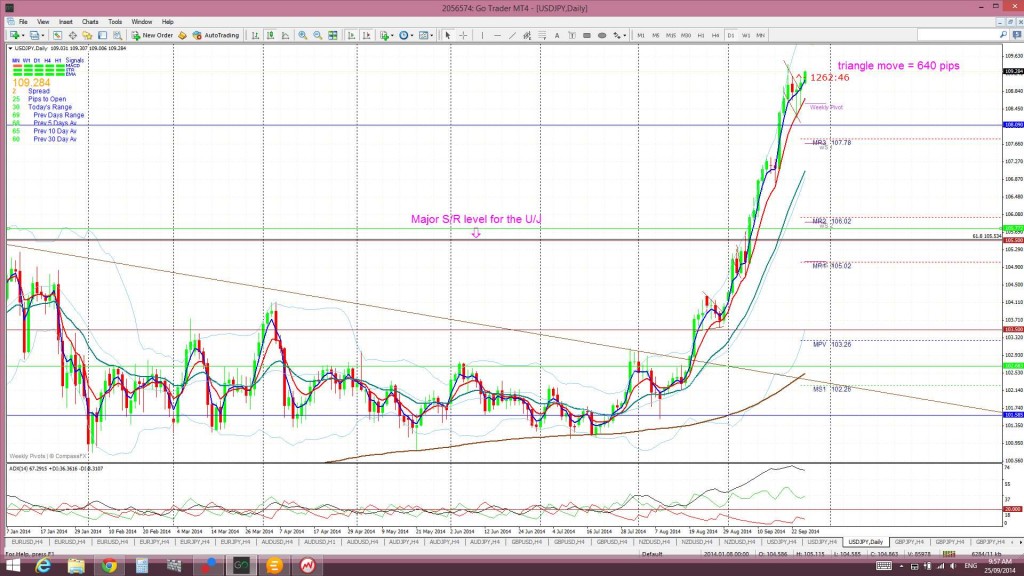
My TC analysis had been tracking the U/J for weeks as it consolidated within a descending triangle pattern. Traders had been urged to watch for any trend line break to signal a triangle breakout. This breakout came through back in late Aug and was noted in a separate blog post that can be found through this link. The triangle breakout has gone on to deliver up to 640 pips!
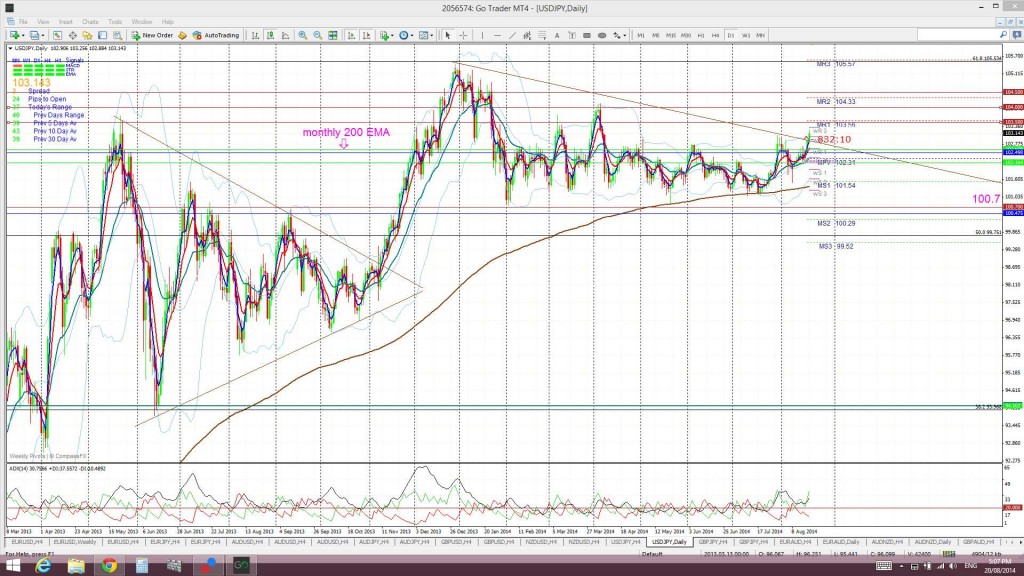
U/J daily condensed as on Wed 20th Aug: This chart shows the lengthy period of consolidation of the U/J within this triangle pattern. It usually flows that the longer the consolidation then the greater the breakout and this is what has evolved on this U/J triangle breakout:
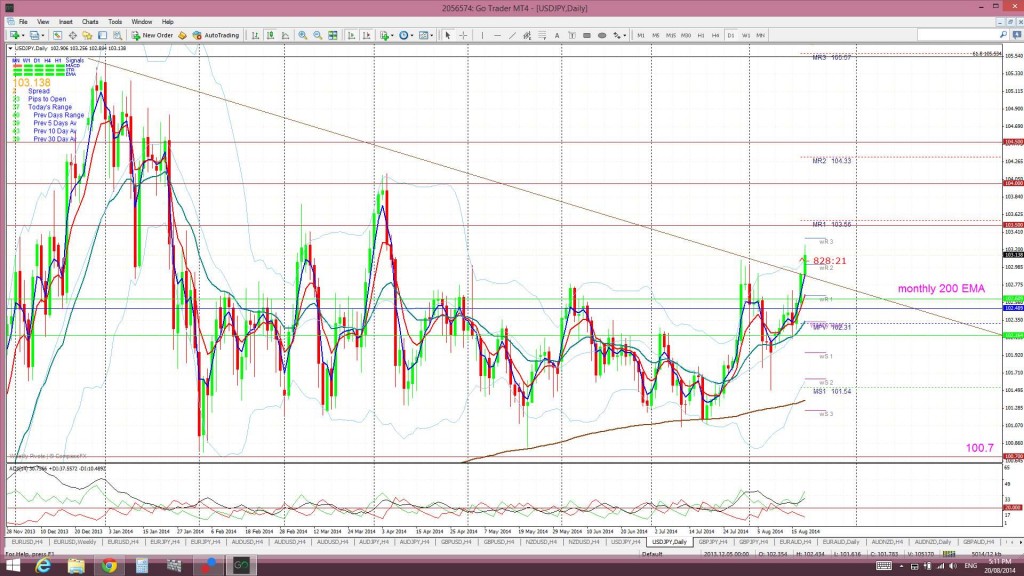
This was the explanation that came with this chart: “Today is the first day to see a bullish candle trade up and out of the recent weekly triangle pattern. This is a significant bullish development in itself BUT a weekly candle close above this triangle trend line needs to be printed here to confirm any longer term bullish triangle breakout”.
U/J daily chart as of Wed 20th Aug:
A bullish weekly candle did eventually confirm this breakout and long trade idea and there were many subsequent blog posts about this trade idea. The triangle breakout went on to deliver up to 640 pips as seen in the updated chart below!
U/J daily as of Thurs 25th Sept:


