Triangle patterns can be seen quite regularly across charts of various trading instruments and they represent different forms of consolidation. There are different types of triangle patterns including Symmetrical, Descending and Ascending triangles. Traders can benefit from monitoring such patterns for clues about either bullish or bearish breakouts but the three noted patterns are usually classified with the following bias:
- Symmetrical: breakouts can be either bullish or bearish.
- Ascending: breakouts are more often bullish.
- Descending: breakouts are more often bearish.
This page contains a real-life chart example of each type of triangle, with a subsequent breakout, and shows how the Height of the triangle can be useful for assessing potential areas of where to take profit.
Symmetrical Triangle:
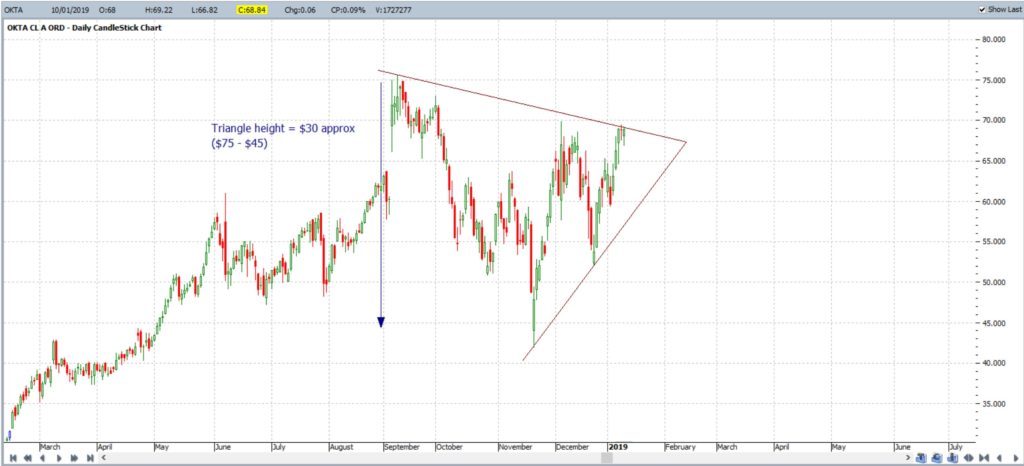
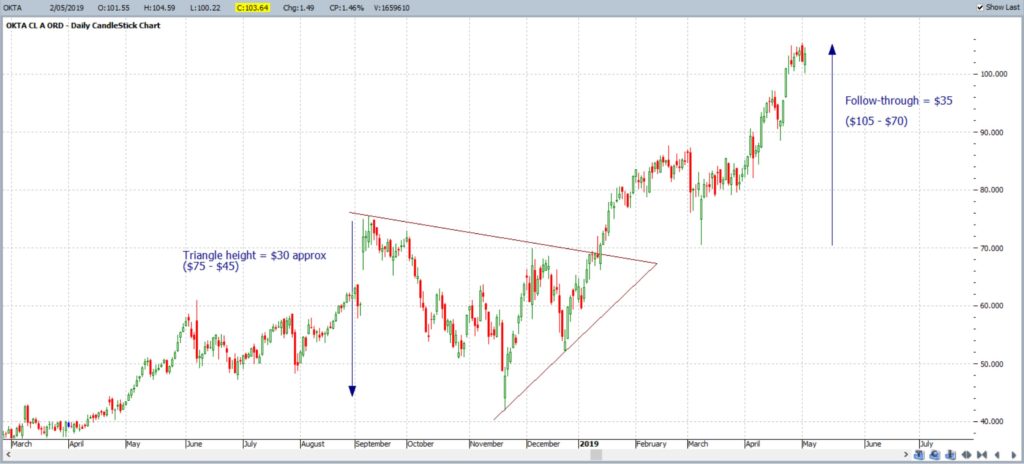
Symmetrical triangles are patterns that capture a period of sideways consolidation and the breakout can generally be either to the upside or downside. Price action tends to move in a decreasing range of lower Highs and higher Lows towards the apex of a triangle. It is useful to use a confirming momentum or volume indicator, such as the ADX, to help confirm any breakout. The example below shows OKTA chopping sideways for a period with a range of about $30.
Note how the breakout triggered and price action actually moved on for that target of $30 and then some!
Descending Triangle:
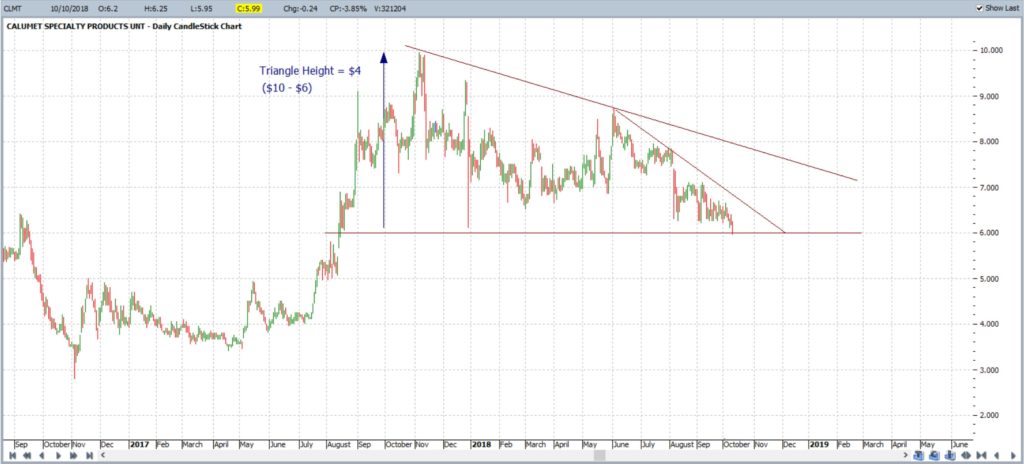
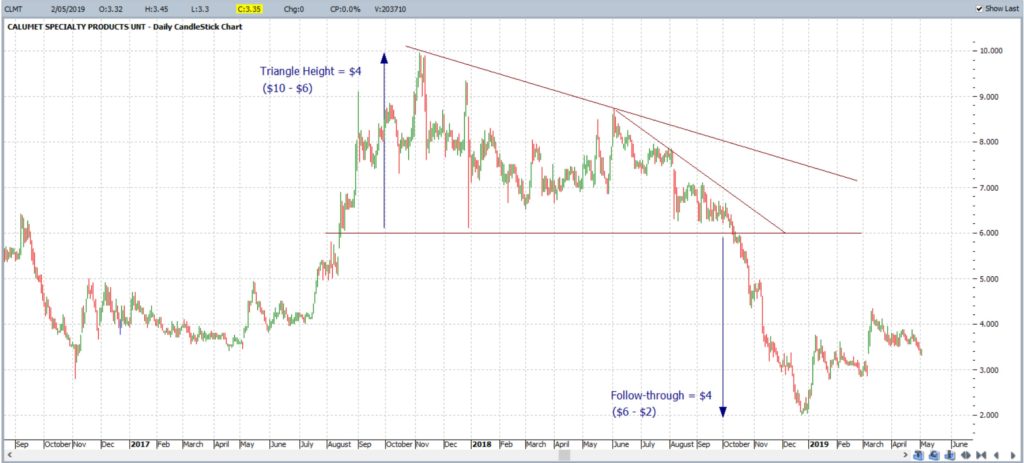
The Descending triangle is usually considered a bearish continuation pattern. Prior price action is range bound with a series of lower Highs progressing down to a horizontal support level. The chart below shows this clearly with a triangle having a height of about $4:
Note how the breakout triggered and actually moved on for the target value of $4 exactly!
Ascending Triangle:
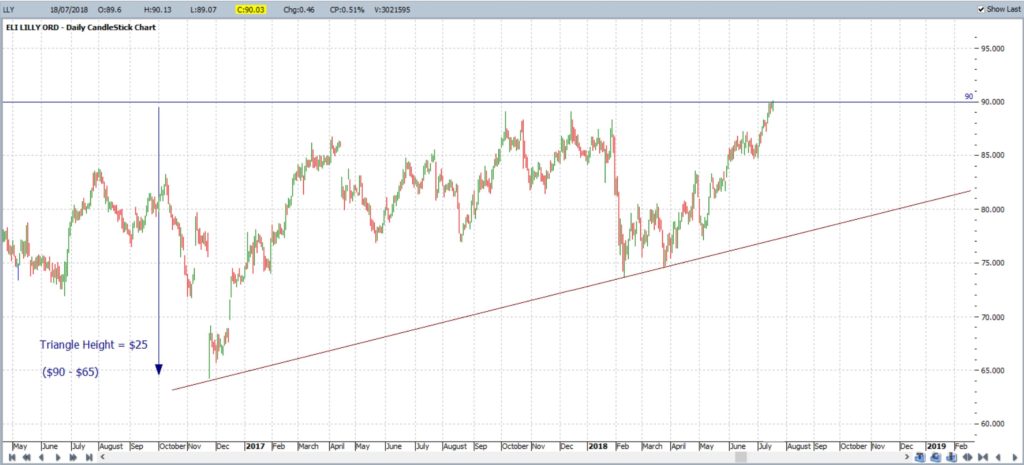
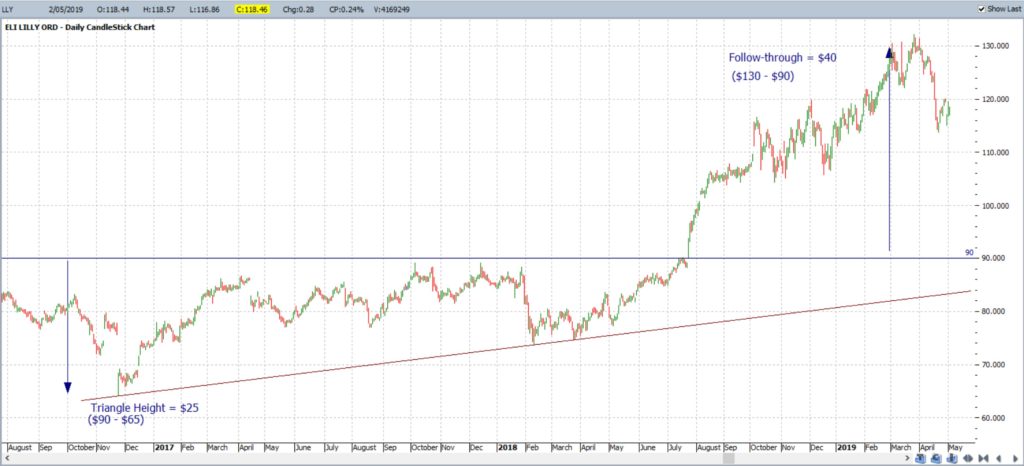
The Ascending triangle is usually considered a bullish continuation pattern. Prior price action is range bound by a series of higher Lows progressing up to a horizontal resistance level. The chart below shows this clearly with a triangle having a height of about $25:
Note how the breakout triggered and has actually moved on for that target of $25 and then some!
Conclusion:
Triangle patterns are useful technical patterns to monitor to help assess any breakout price action. Different types of triangle are often highly predictive of a certain type of breakout but there are no guarantees with any technical patterns and careful risk management needs to be exercised. The drawing of trend lines is rather subjective and so trend line breakouts are best confirmed with a momentum or volume indicator for added confluence.
The purpose of this article was to highlight the difference between the three types of triangle patterns: Symmetrical, Descending and Ascending triangle.


