The focus for this article is on the concepts of Volume and Momentum and the merits of both in informing on any trend line breakout move. There are some that claim that you only need to analyse Price Action and Volume to be able to identify breakout moves and trade successfully. However, my experience has been that an analysis of Momentum is a very valid tool as well and is sometimes of better use than Volume!
The rest of this article goes through two examples, one using the large / mega market capitalisation US-based Apple stock (AAPL) and the other using a small / micro cap Aussie stock, Class Ltd (CL1).
The market capitalisation of Apple is 1.39 T USD and that of Class is 222 million AUD. Information about the different categories of market capitalisation can be found through this link. Comparison is easier when both are placed in the same currency:
-
-
-
-
-
-
- Apple market cap in USD: $1,390,000,000,000.00
- Class market cap in USD: $151,592,700.00
-
-
-
-
-
As you follow through the charts in this article you will see that Volume was a good indicator to use in conjunction with a trend line breakout for large cap Apple but that Momentum was a better tool to use and this was especially the cased on the smaller cap stock Class Ltd.
The Momentum indicator of choice for me is the ADX, Average Directional Index, and you can read more about this indicator in my article available via this link.
Example 1: AAPL
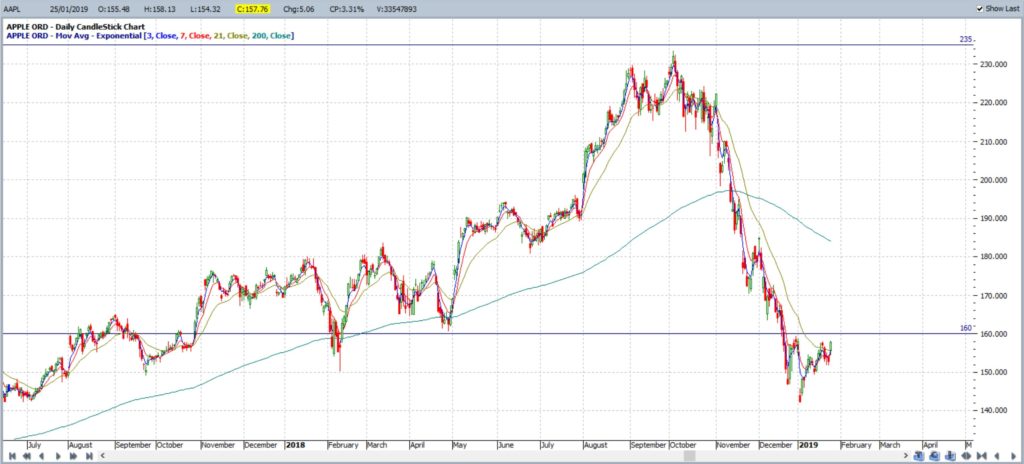
1 AAPL: Prior to trend line breakout:
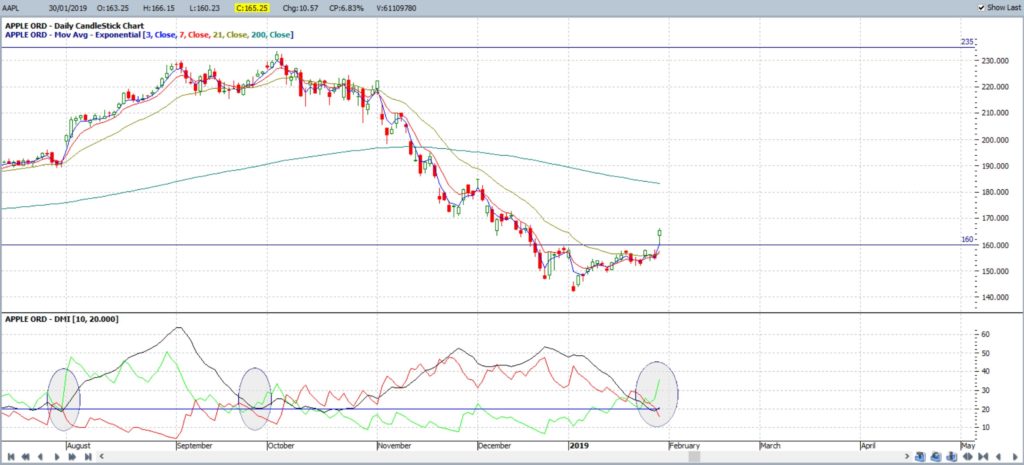
This chart shows APPL stock price consolidating under the $160 level after a period of considerable decline. You can see that $160 was a significant level of horizontal Support and Resistance. This would be an obvious level to monitor for any new make or break activity.
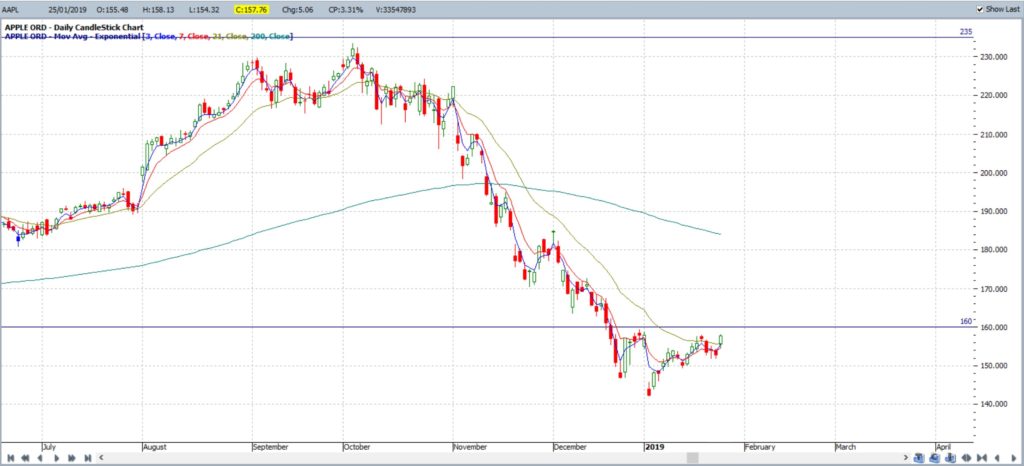
2 Expanded AAPL chart prior to trend line breakout:
The chart has been expanded now that $160 has been identified as the level to monitor.
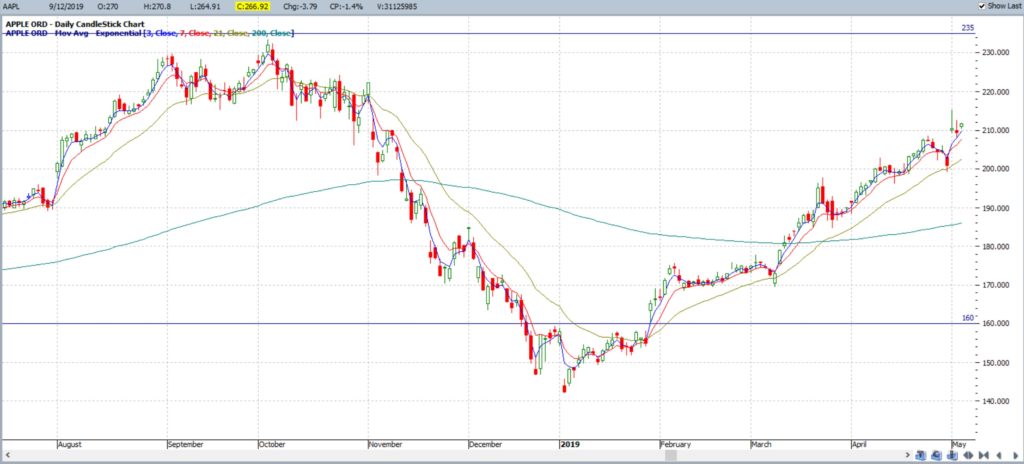
3 AAPL Trend line breakout and follow-through:
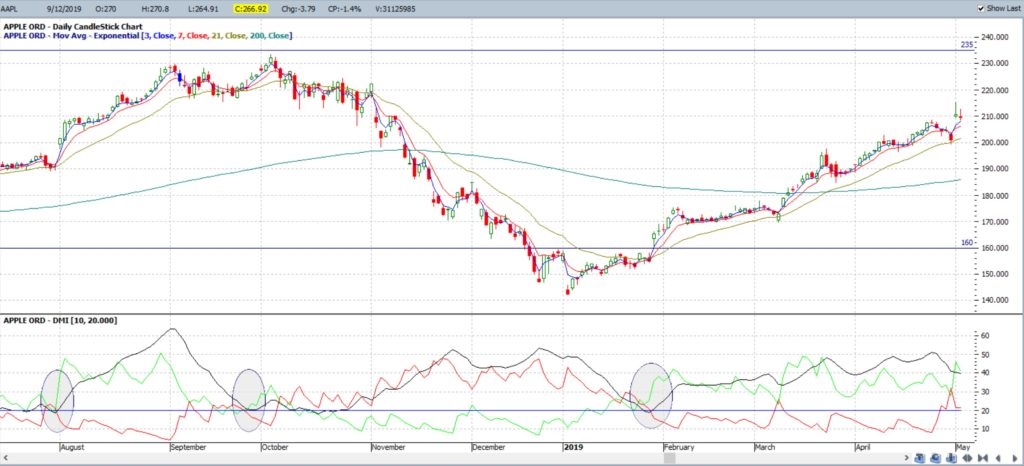
This chart reveals how there was, indeed, a successful breakout and bullish follow-through after the move up through $160. In the following charts we will explore if either Volume or Momentum was better help in verifying this breakout.
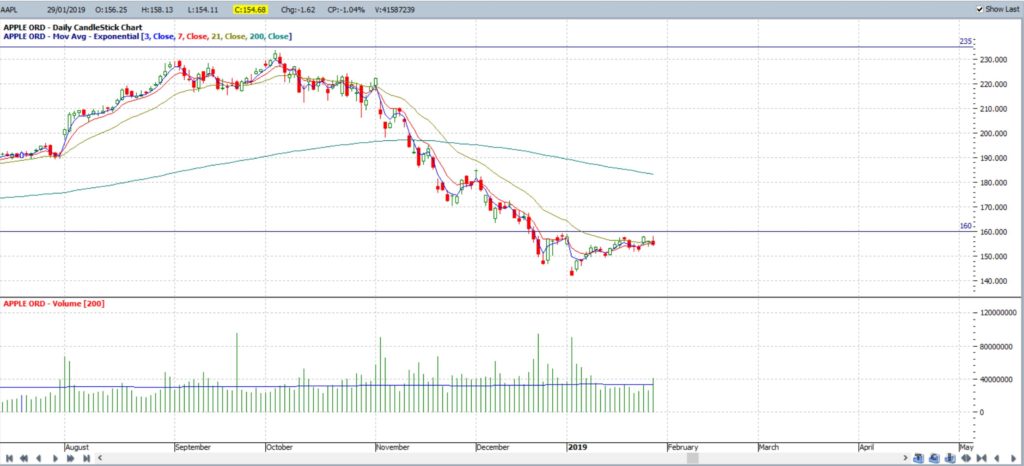
4 Volume and AAPL:
This charts shows that Volume was fairly steady in the days prior to the $160 breakout:
5 APPL: Volume with breakout:
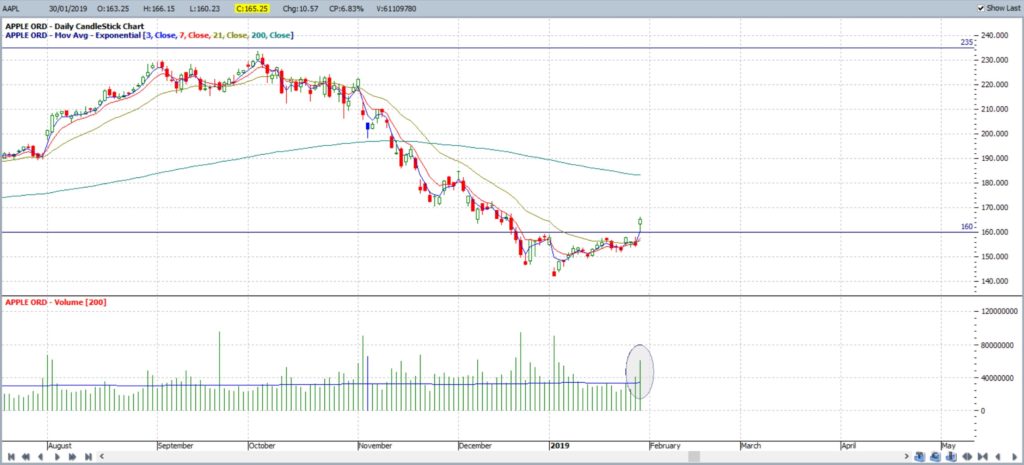
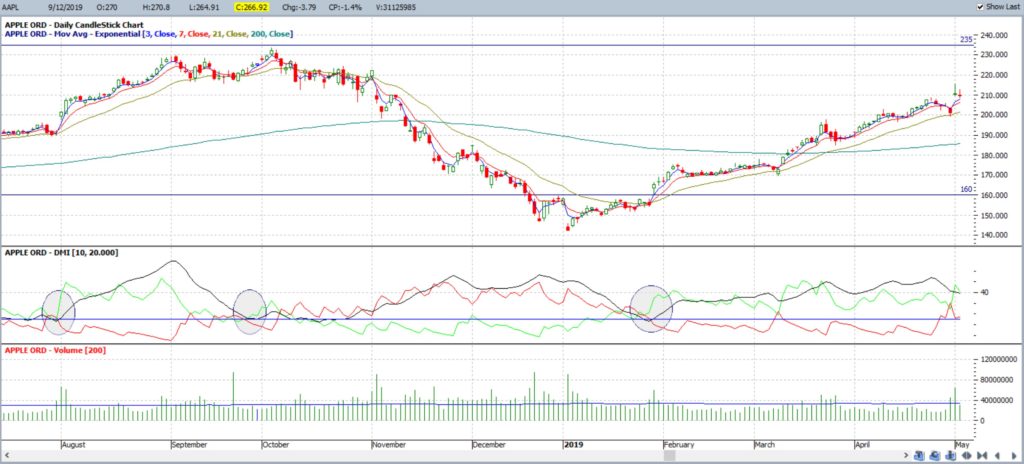
This charts shows that Volume did spike a bit following the $160 breakout. However, the spike was not a huge one but it was a clue that the breakout had some Volume behind the move:
6 AAPL: Volume and breakout follow-through:
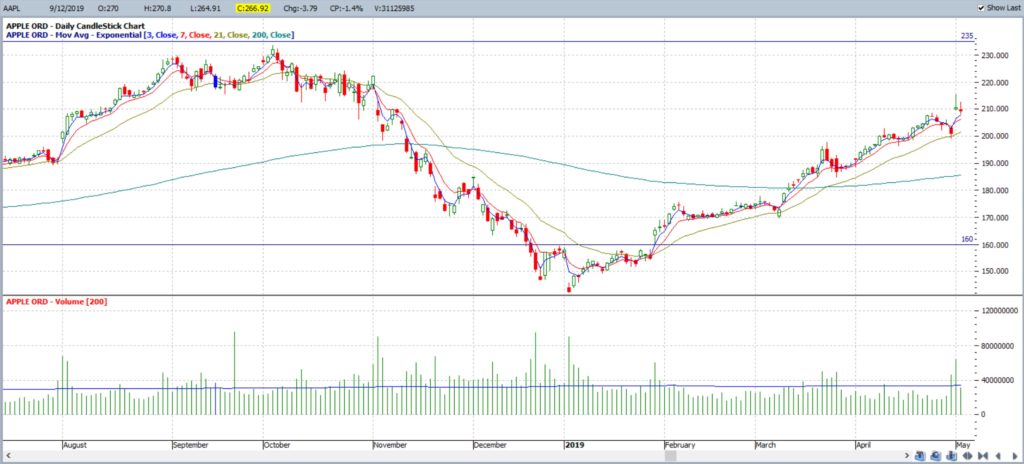
This charts shows the trend with Volume following the breakout above $160. Notice how after the initial spike, Volume went back to fairly normal levels afterwards that and so may not have been the most encouraging signal:
7 Momentum and AAPL:
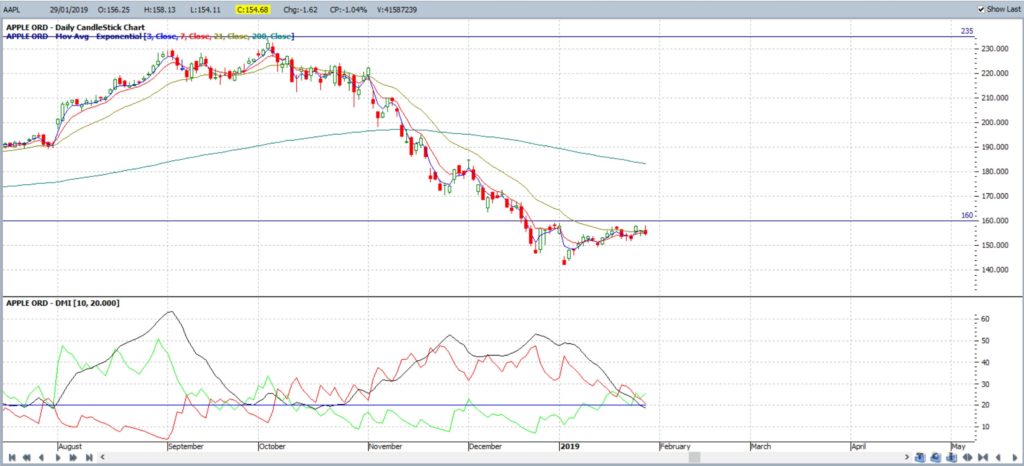
This charts shows AAPL prior to the breakout and with a Momentum indicator included. The momentum indicator of choice for me is the ADX Indicator. Anyone interested in learning more about this indicator is advised to read a book on this topic by Dr Charles B Schaap: ADXcellence.
The ADX indicator on my software is made up of 3 parts:
- ADX (Average Directional Index: black line)
- +DMI (Bullish Directional Movement Index: green line)
- -DMI (Bearish Directional Movement Index: red line)
The ADX line, the overall momentum indicator, was in decline and below the 20 threshold prior to the move above $160. Bearish -DMI momentum was on the decline and bullish +DMI momentum was on the incline. The fact that the ADX was on a decline is useful as it is then relatively easy to identify when and it swings around to trend upwards:
8 AAPL: Momentum with breakout:
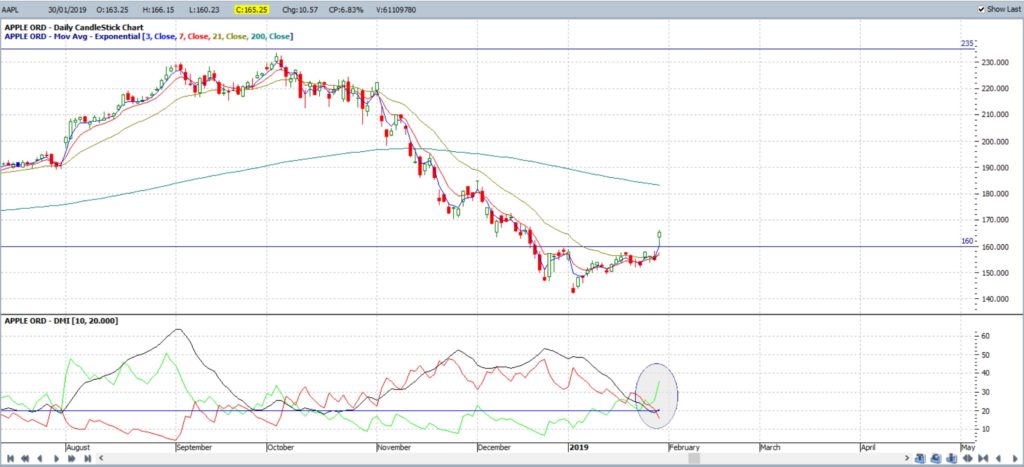
This charts shows that Momentum, by way of the ADX line, broke above the 20 threshold following the $160 breakout. Notice how this was an easy signal to identify; the ADX and +DMI above 20 and trending upwards and the -DMI below 20 and trending downward:
9 AAPL: Momentum is a good clue:
I have circled two other times when there were similar conditions of the ADX and +DMI above 20 and the -DMI below 20 and both times gave a decent clue about the following directional move higher:
10 AAPL: Momentum with breakout:
Notice how the ADX and +DMI stay above 20 throughout the duration of the bullish move following the break above $160:
11 AAPL: Volume and Momentum compared:
On this chart I have included both Volume and ADX Momentum to AAPL’s $160 breakout move. The small spike in Volume was an accurate clue but I still find great appeal in the visual signal offered by the ADX.
12 Thoughts on AAPL breakout:
Volume and Momentum were both useful for validating the breakout move of AAPL above the $160 level. Both are useful metrics to use when trying to evaluate the merits of a breakout move. However, I find the ADX indicator to be a better visual tool to use for such breakout situations.
Example 2: Class Ltd
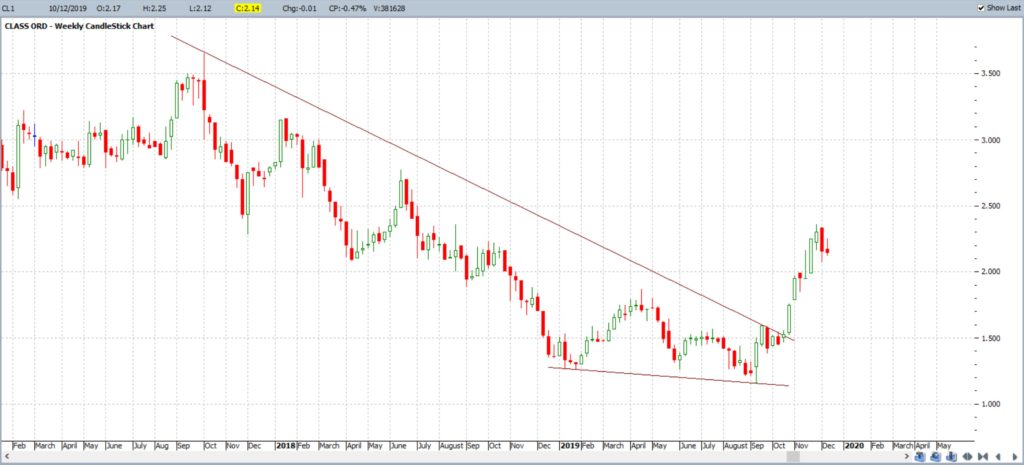
1 CL1 setting up with descending wedge on weekly:
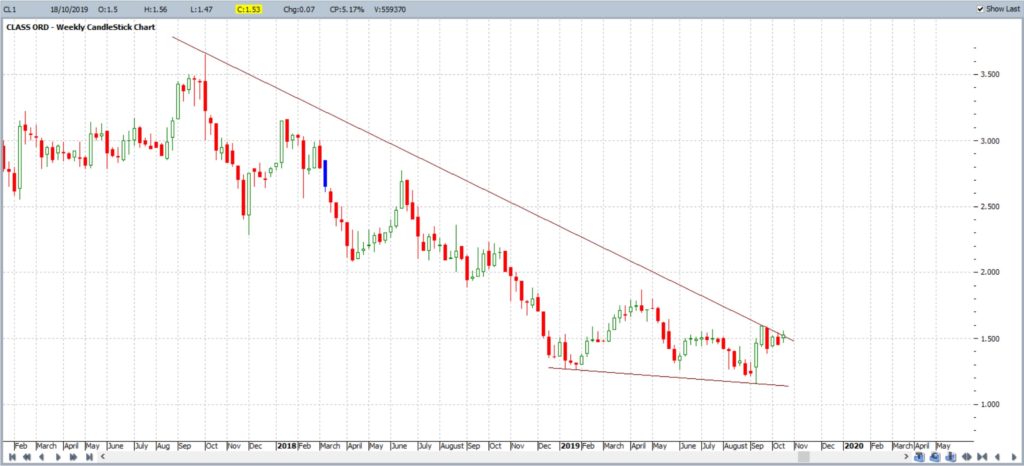
This chart shows CL1 stock price setting up in a descending wedge pattern. These types of wedges are classified as bullish-reversal patterns and so the idea is to monitor for any trend line breakout to the upside:
2 CL1 breaks out from descending wedge:
This chart reveals that there was, indeed, some bullish follow-through following a trend line breakout to the upside:
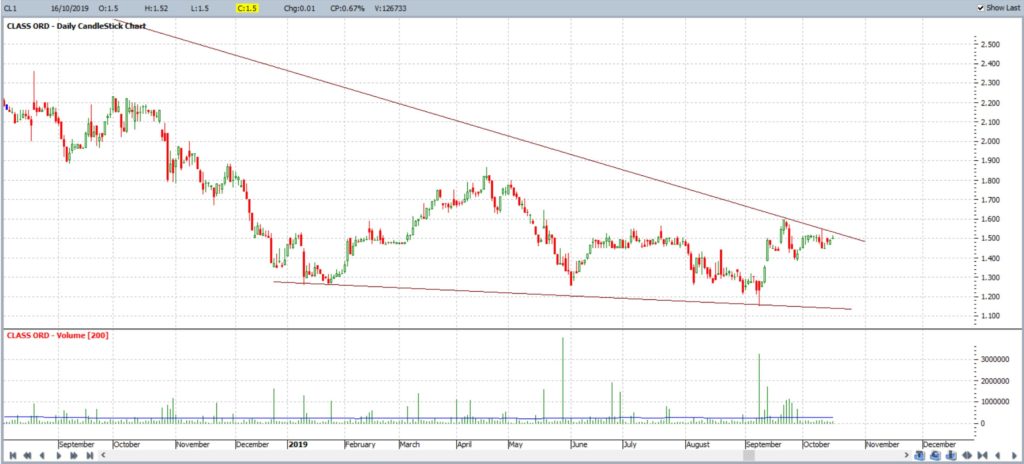
3 CL1: Volume and descending wedge on the daily chart:
This cart shows the Volume profile prior to the bullish breakout. Volume was below average in the days leading up to the breakout:
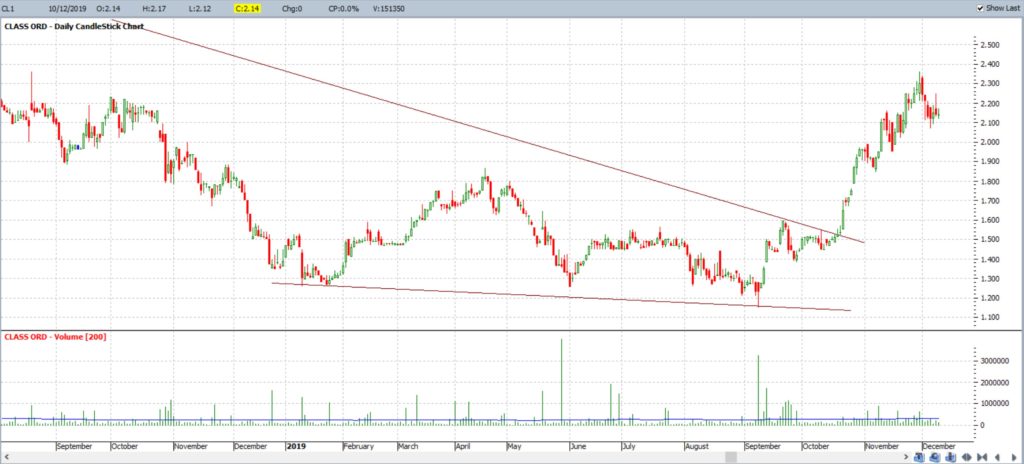
4 CL1: Volume with wedge breakout on the daily chart:
This chart shows that, whilst Volume picked up a little bit, there wasn’t any obvious spike higher to give great confidence trading this breakout move:
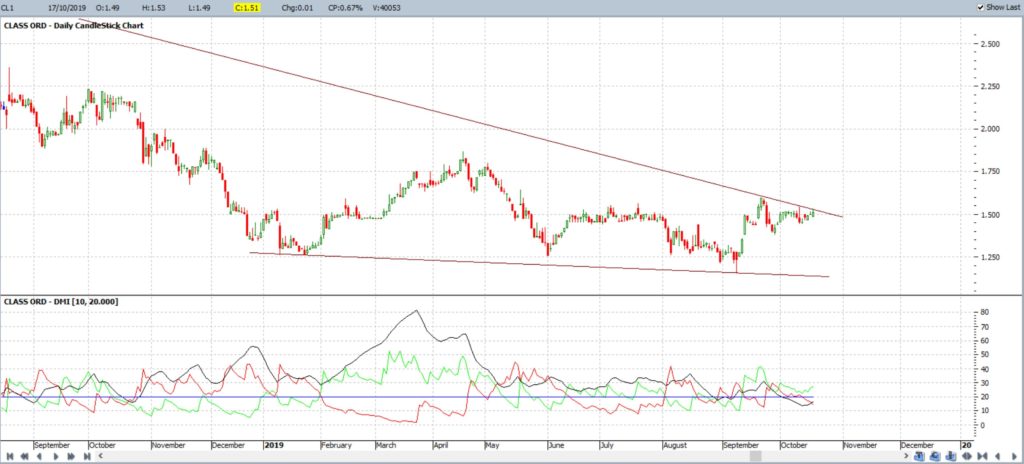
5 CL1: Momentum and descending wedge on the daily chart:
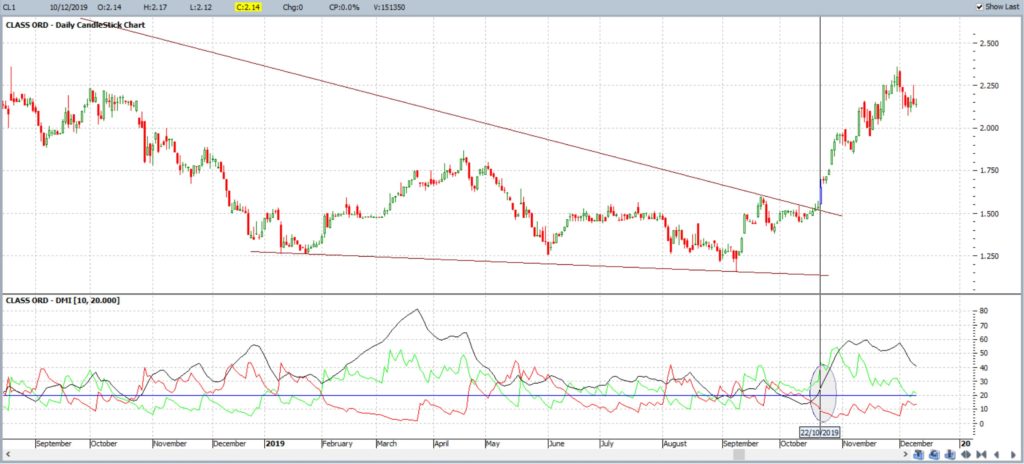
This chart shows momentum prior to the wedge breakout. Note how the ADX was below 20:
6 CL1: Momentum and wedge breakout on the daily chart:
I have drawn a line through one of the candles just after the breakout. Note how this candle aligns with a move on the ADX to be back above 20 and with both the ADX and +DMI trending higher and the -DMI trending lower. In this example, the ADX is a much better visual tool to verify the trend line breakout. I do suspect this is because Volume might be a trickier tool to use on smaller cap stocks.
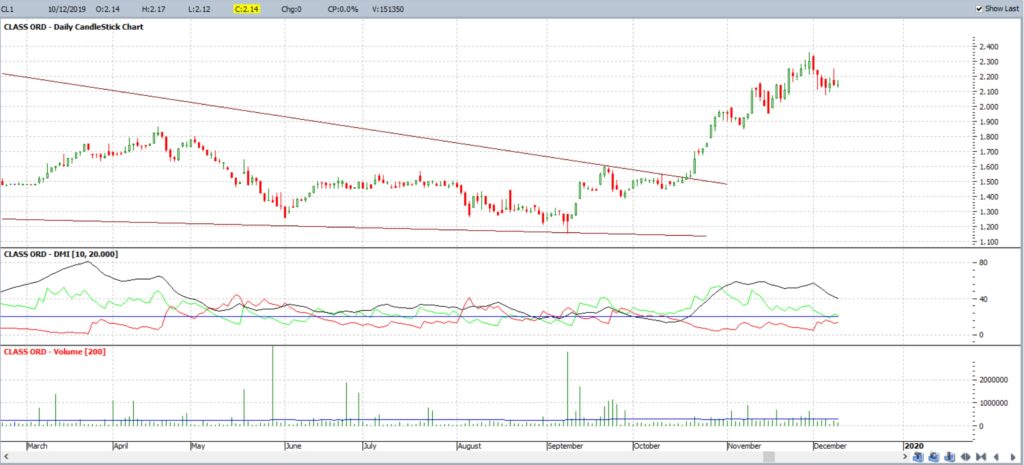
5 CL1: Momentum and Volume with wedge breakout on the daily chart:
This chart shows both Volume and Momentum on the CL1 breakout move. In this instance, the ADX was a better visual tool to use than Volume for verifying the trend line breakout.
6 Thoughts on CL1 breakout:
ADX Momentum was a better visual indicator for validating the wedge breakout move on Cl1 compared to Volume. This may be due to the smaller capitalisation of this stock and that is something to keep in mind when assessing trend line breakout moves. In such cases, Momentum would definitely be advised to be used in conjunction with Volume.
Summing Up:
Volume and Momentum are both useful indicators for validating any trend line breakout. Both seem to be of equal use when monitoring large cap stocks but Momentum seems to be more useful with smaller-cap stocks. This is something that traders should keep in mind and, rather than relying on one or the other, perhaps templates with both indicators should be included in trading.


