I was recently asked about how to catch and manage trend line breakout trades and this motivated me to prepare the following article. Not every breakout trade evolves smoothly, or with a low initial risk, and so traders need to exercise appropriate risk management and patience when assessing which trades to take. For this article I have used a breakout trade on Gold that triggered during the last week of March 2020.
Example: Trend line breakout on Gold week of March 22nd 2020
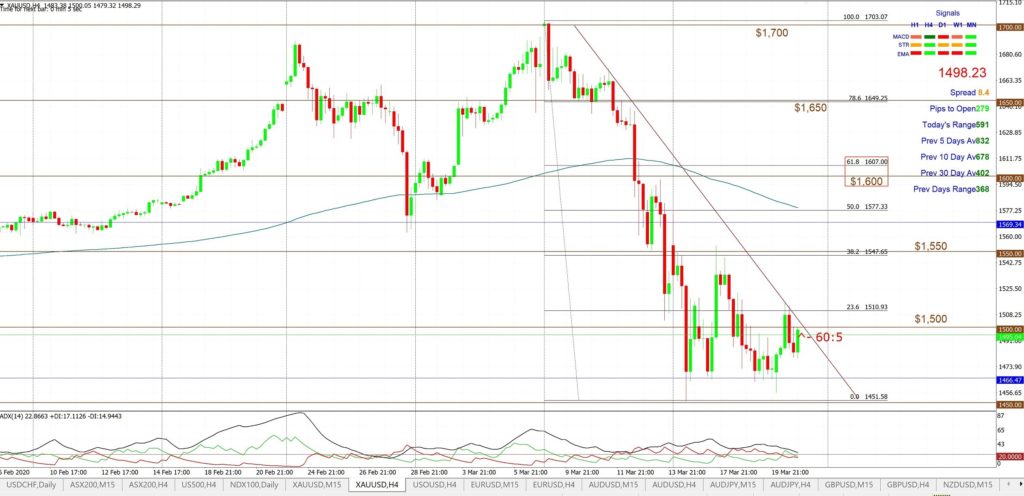
In my analysis for members on the weekend of March 22nd 2020 I noted how Gold was setting up in a triangle pattern, as shown below, and the regime I had suggested in this post was as follows:
Bullish targets: any bullish triangle breakout would bring $1,550 S/R followed by the 4hr chart’s 61.8% fib, near $1.600 S/R, into focus.
Bearish targets: any bearish triangle breakout would bring the weekly support trend line, near $1,400, into focus.
- Watch for any new 4hr chart trend line breakout:
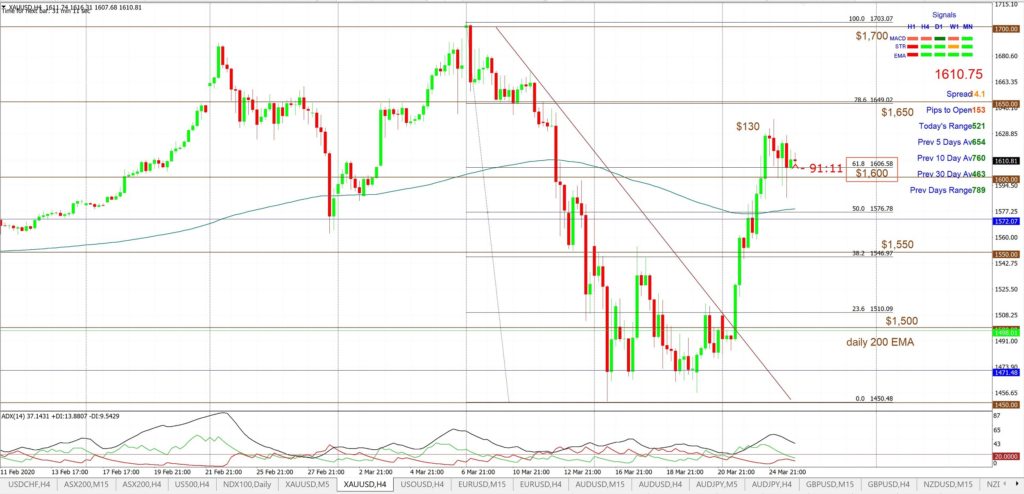
The 4hr chart below shows how the breakout triggered and, then, proceeded during the subsequent trading sessions. There was a trend line breakout to the upside for a maximum move of about $130. Note how price action reverted to test the $1,600 level; this is a long-term S/R level for this metal:
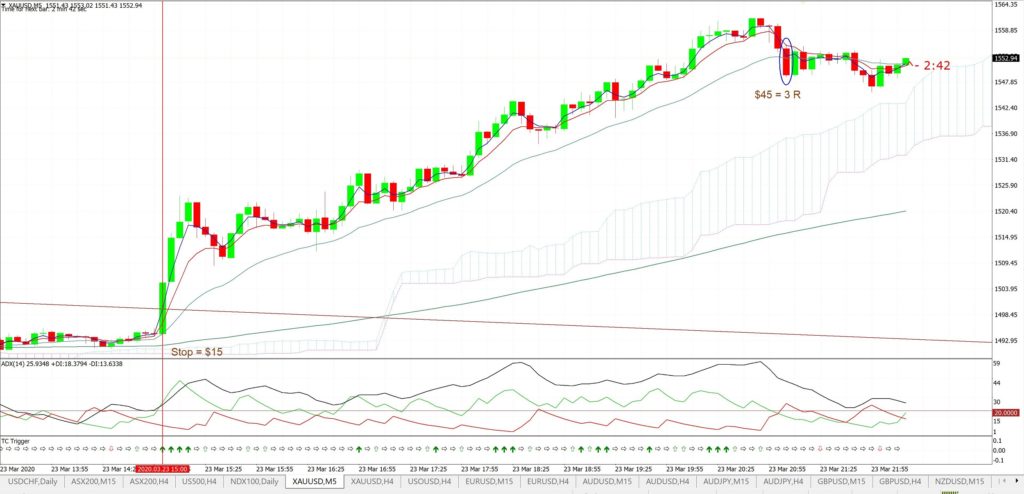
Gold 5 min: The day after this trend line breakout I noted in my daily update post how the Gold 4hr chart breakout also aligned with a new TC signal on the 5 minute chart and this gave up to $45 for a 3 R trade return:
However, I am not in a position where I am allowed to share my TC indicator with the public due to Australian ASIC regulatory requirements. I realise this is frustrating for subscribers and it is frustrating for me as well. So, with this in mind, I offer these suggestions to help traders with trying to catch trend line breakout trades.
Catching Trend line breakout trades
The first step is to have trend lines in place that you can monitor for any momentum breakout trade. I publish a weekend report that contains my analysis of a range of trading instruments but traders should try and develop their own charting skills. The following regime is my suggested approach for budding technical analysts to follow.
- Select charts to assess: Determine which trading instruments you want to trade: this should be one that is best suited to your time zone, your trading plan and your risk profile.
- Identify any chart patterns: Read post on Basic Intro to Technical Analysis.
- Identify Support and resistance levels: Read post on identifying Support and Resistance.
- Gauge current momentum: Read post on the value of Momentum indicators.
- Assess: Assess your chosen trading instrument(s) on the monthly, weekly and daily chart time frames and, if applicable, down to the 4hr chart and note all lines of Support and Resistance and identify any chart patterns.
- Determine: Determine the time frame of trading that best suits your lifestyle. Bear in mind that trading from longer time frame charts will usually involve using a larger STOP size. Traders will need to determine their risk per trade to use in line with these STOP sizes.
- Monitor: Monitor the time frame chart that best suits your trading. In the example below I illustrate how the trend line breakout on the 4hr chart of Gold could also be stalked on the 60 min chart. This scenario might allow for a lower STOP size to be used. The same scenario could be enacted using alternate combinations of time frames: either daily / 4hr chart or weekly / daily chart combinations.
- Note chart patterns on the 4hr chart time frame.
- Drop down to the 60 min chart and monitor for any trend line breakout.
- Trade entry: Wait for a candle close that:
- Breaks across the trend line.
- Breaks to a new side of the Ichimoku Cloud.
- Displays increased ADX and DMI momentum.
- Trade exit: there are different options for exiting the trade. It is up to the individual trader to select a regime that works best for them and one that suits their time frame of trading and their risk tolerance and risk profile. Examples of trade exit include:
- Use a pre-determined price point: identified by either Fibonacci retracement or from a key Support / Resistance level.
- Wait for a candle to close back on the other side of the Ichimoku Cloud.
- Use a pre-determined Risk multiple to exit. For example: Use 3 R: that is when the Profit is 3 x the size of initial Risk.
- Wait for a candle close below an EMA: eg 21 EMA. This was the strategy shown for the 60 minute chart of Gold below.
Gold 60 min chart example:
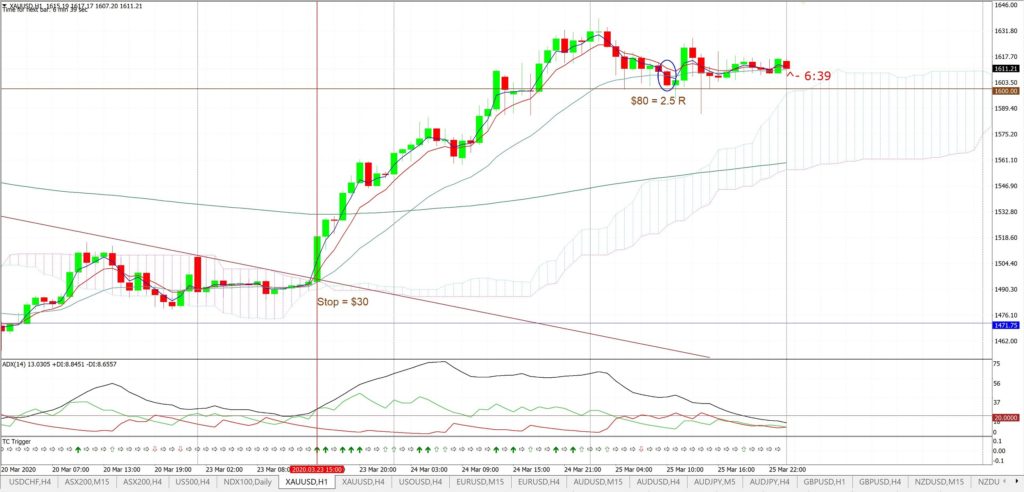
The trend lines were placed on the Gold 4hr chart but the trade could have been monitored on the lower 60 minute chart. Note on the chart below:
- the first 60 min candle close above the trend line also closed above the Ichimoku Cloud.
- the first 60 min candle close above the trend line also closed with increased ADX momentum.
- the first 60 min candle close above the trend line also closed with increased +DMI momentum.
- the method of EXIT here was for the first candle close below the 21 EMA.
- This gave a trade result of 2.5 R.
Concluding comments:
Not all trend line breakout trades work as cleanly as this example on Gold. That is why it is so critical for traders to:
- Only trade with funds you can afford to lose.
- Keep your risk per trade to under 2%.
- Balance / Limit your exposure across trading instruments. For example: a LONG AUD/JPY trade is generally the same risk exposure as a LONG S&P500 trade.
- Keep abreast of news items that are released during the trading day that might impact any open trades.
However, a disciplined and consistent approach to technical analysis can help traders to derive profits from trading.


