This page documents some of the better trend line breakout trades and how they could have been caught off lower time frame charts.
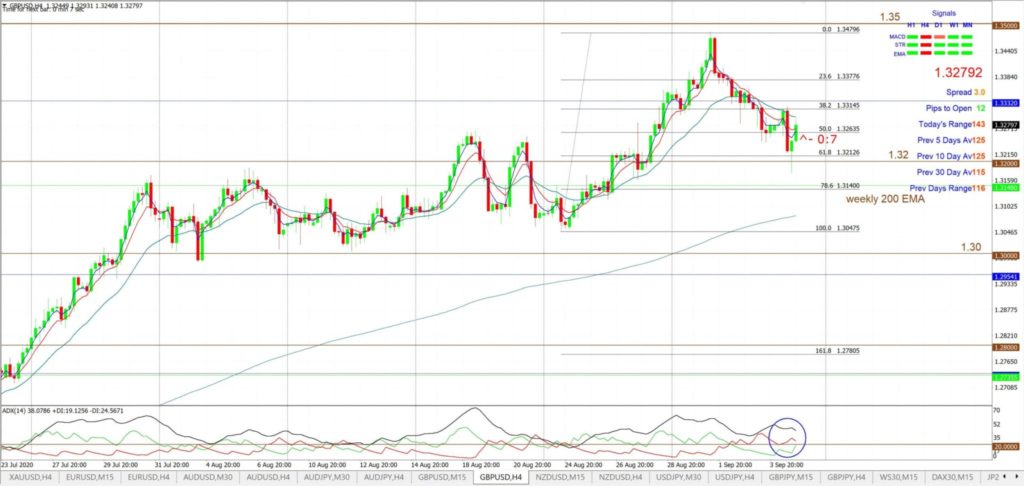
Example GBP/USD September 2020: The 1.32 level was identified as the level to watch for any new make or break in my post form September 2020. This was the chart from that post:
GBP/USD 4hr: chart from September 6th 2020 post:
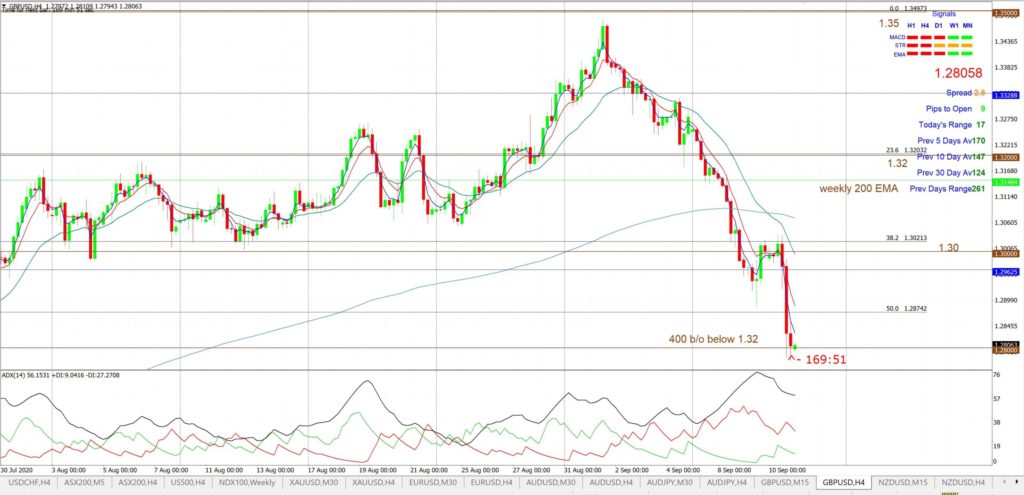
GBP/USD 4hr: chart after the 400 pip break below 1.32:
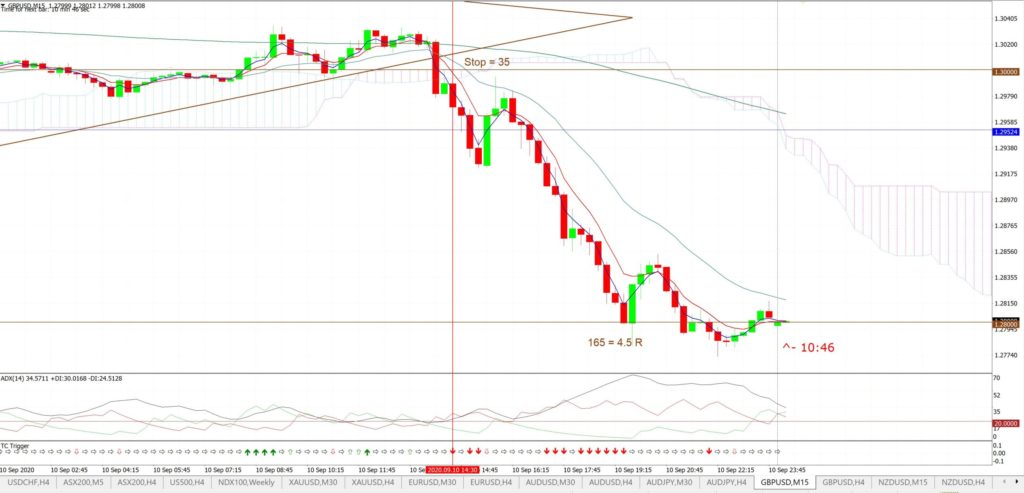
GBP/USD 15 min: chart showing a great short-term b/o move with the break of revised mid week TL:
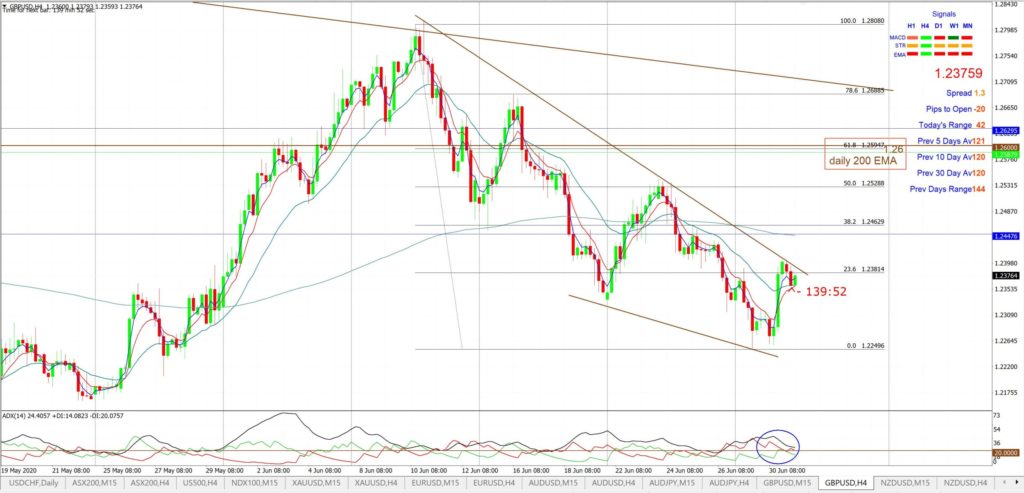
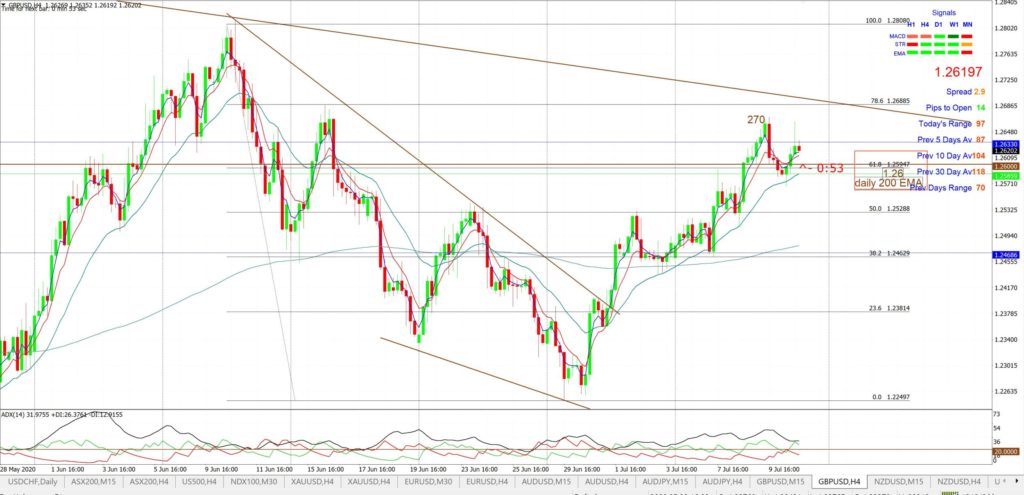
Example GBP/USD June 2020: This Descending Wedge on the GBP/USD was first posted on June 28th 2020. It took a couple of weeks to play out but gave a great trade for up to 270 pips!
GBP/USD 4hr: chart from my June 28th 2020 update:
GBP/USD 4hr: the wedge breakout gave up to 270 pips:
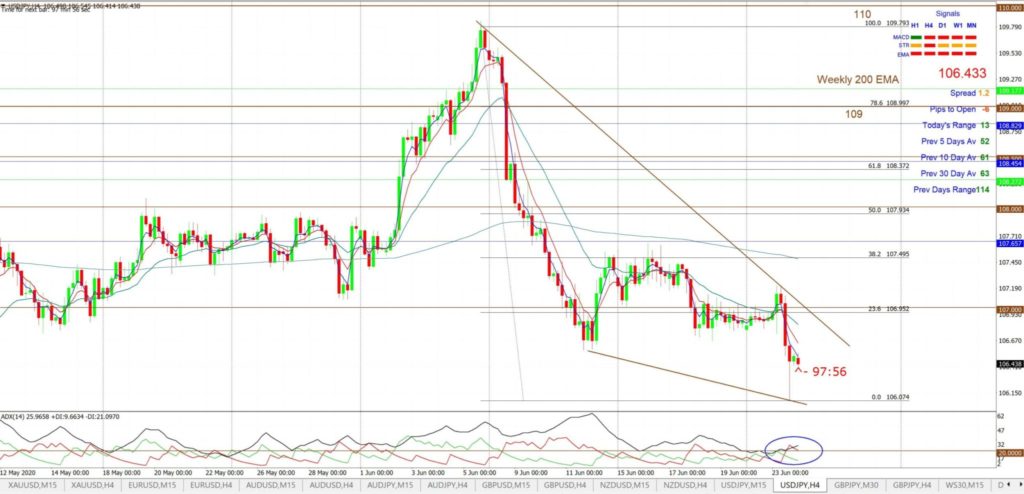
Example USD/JPY: On Wednesday 24th June I noted a bullish-reversal Descending Wedge setting up on the USD/JPY. This was the chart from my morning update that day. The longer-term target for any bullish breakout move would be near 108.5 as this is near the 61.8% Fibonacci:
USD/JPY 4hr: chart from my Wednesday 24th June 2020 update:
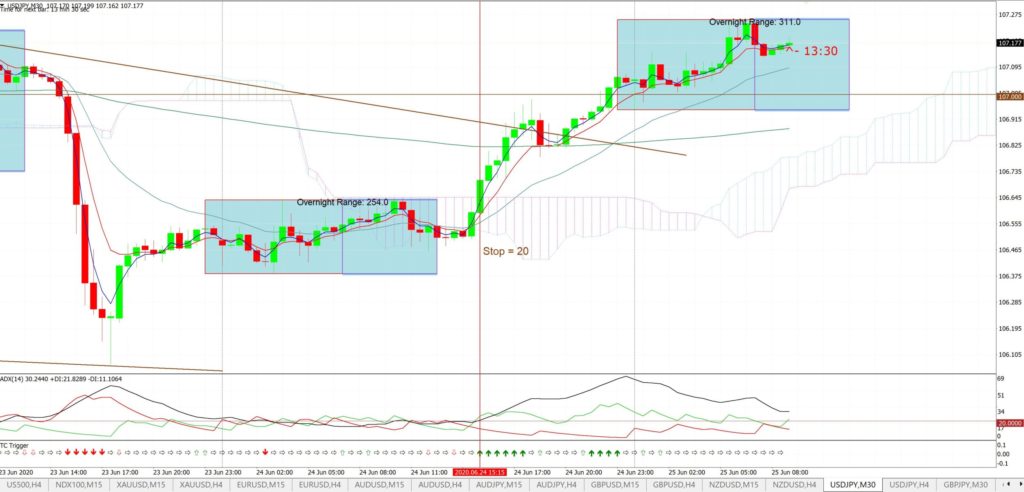
Later that day, in the later Europe session there was a break above the Asian session range, a new move above the 15 min Cloud as well as a TC signal for added confluence. Note how this breakout move came with a low level of risk for just 20 pips!
USD/JPY 30 min: chart from my late Wednesday 24th June 2020:
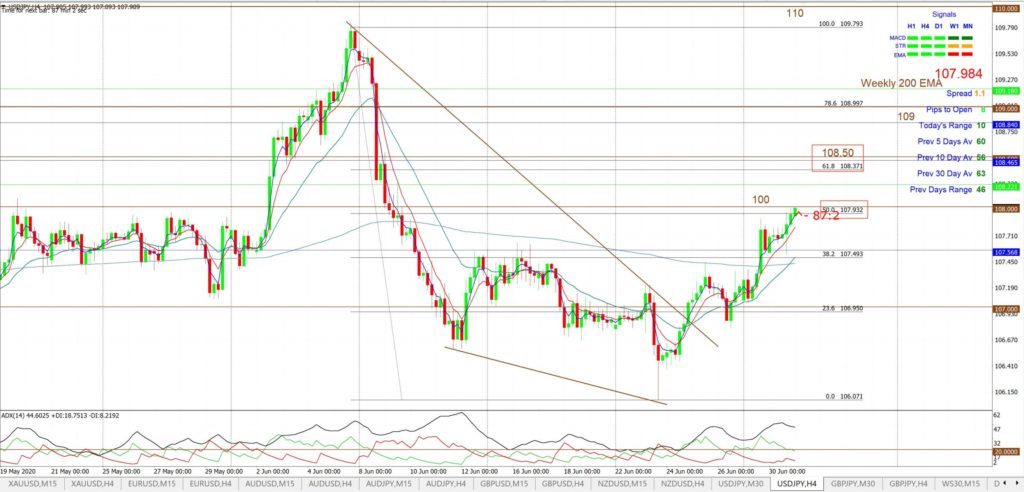
This wedge breakout move ended up yielding 100 pips!
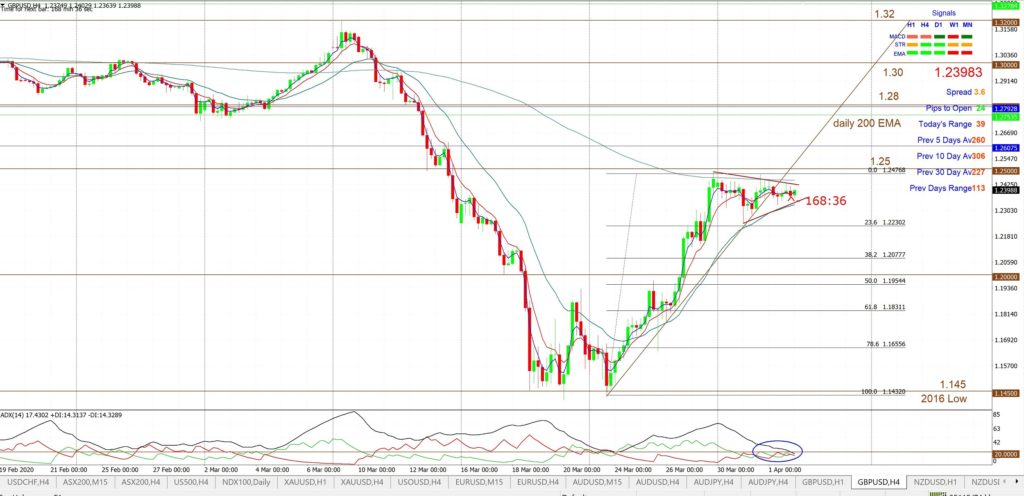
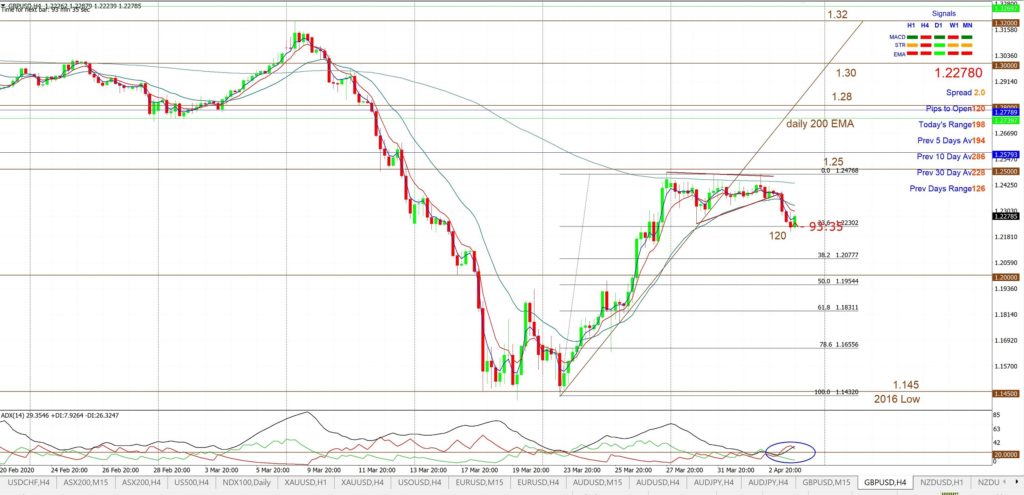
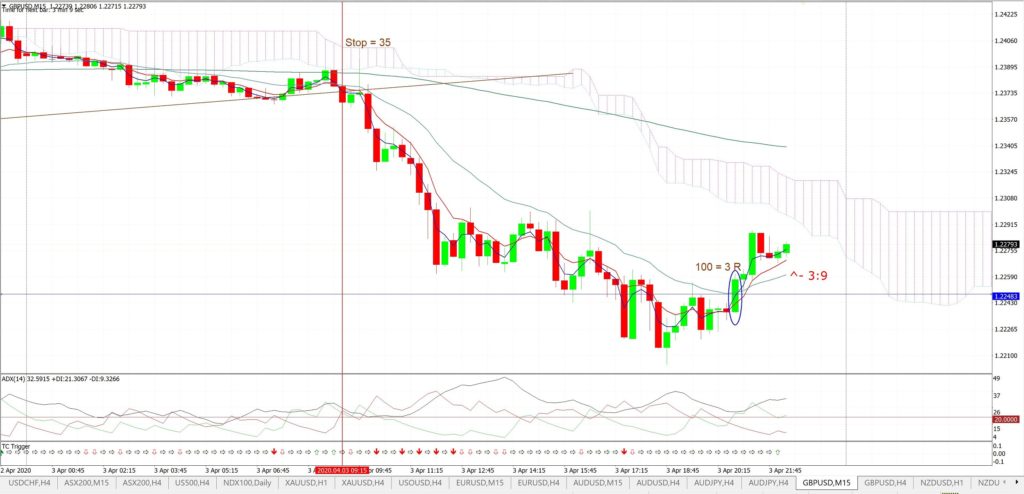
Example GBP/USD: This breakout trade came after the update from Thursday 3rd April. The breakout could have been caught off the lower time frame 15 min chart as shown below. Waiting for a close back above the 21 EMA would have been one way to exit the trade and this would have yielded a 3 R return.
GBP/USD 4hr: chart from April 3rd analysis:
GBP/USD 4hr: chart following a 120 pip b/o:
GBP/USD 15 min: this move could have been caught with a TL b/o for a 3 R trade:
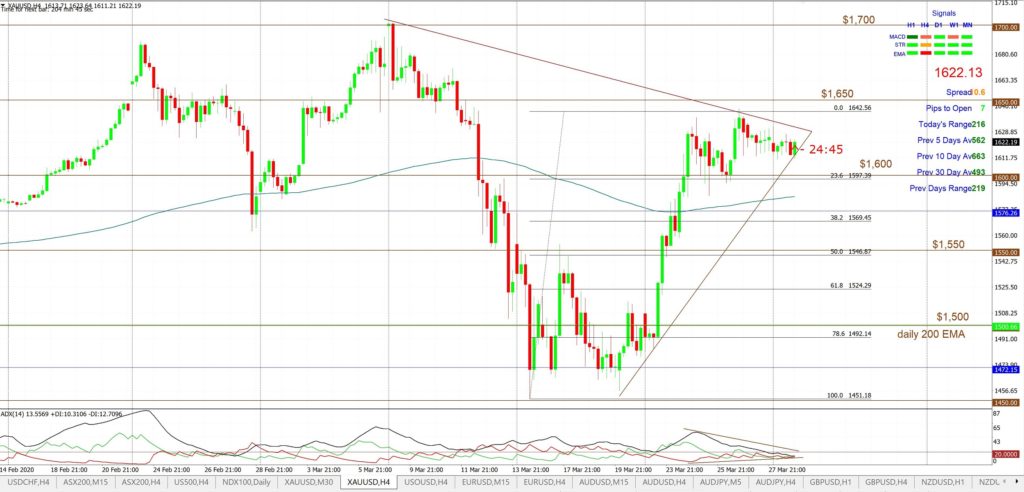
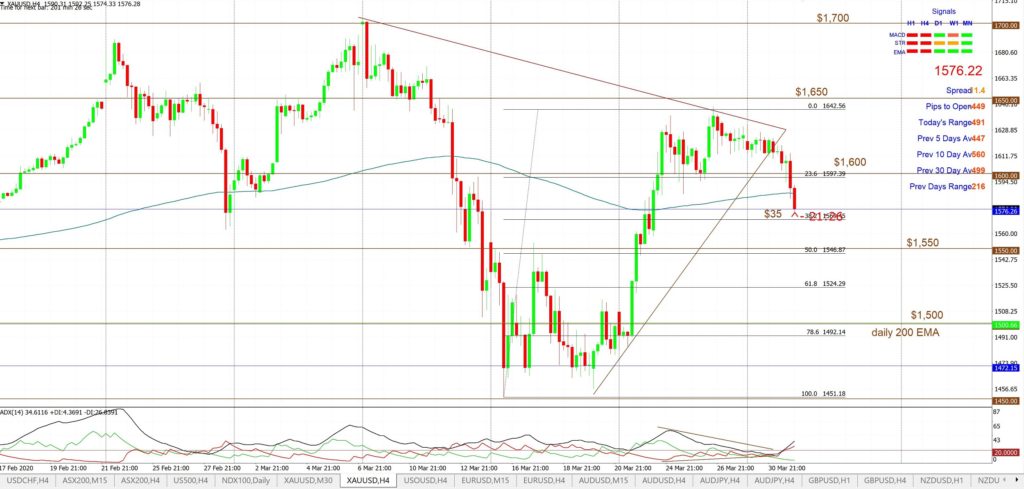
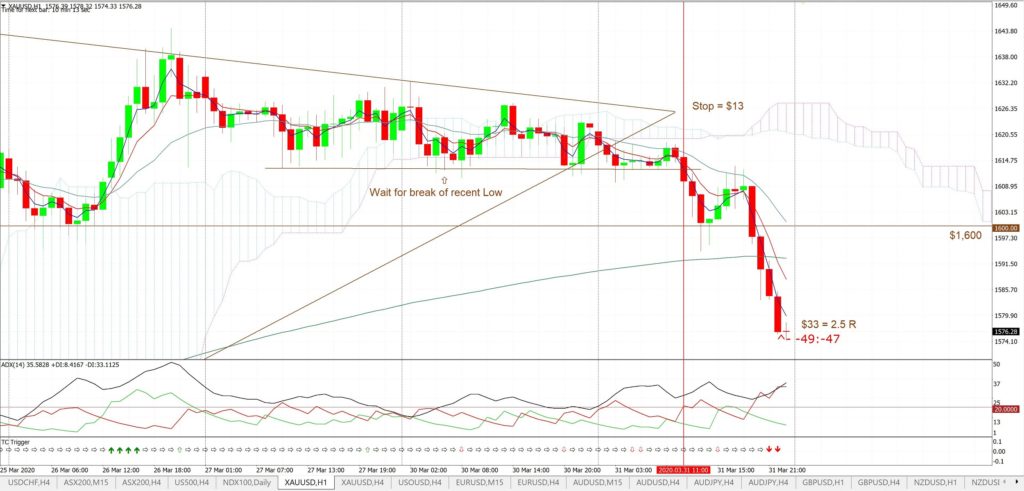
Example: Gold: This breakout trade came from the chart profiled in the weekend analysis posted on Sunday March 29th. The trade delivered up to $33 for a 2.5 R trade off the 60 min chart:
Gold 4hr: chart from March 29th 2020 analysis:
Gold 4hr: chart from April 1st after a trend line breakout:
Gold 60 min: this TL b/o was easily caught following the triangle b/o and break of the recent Low:
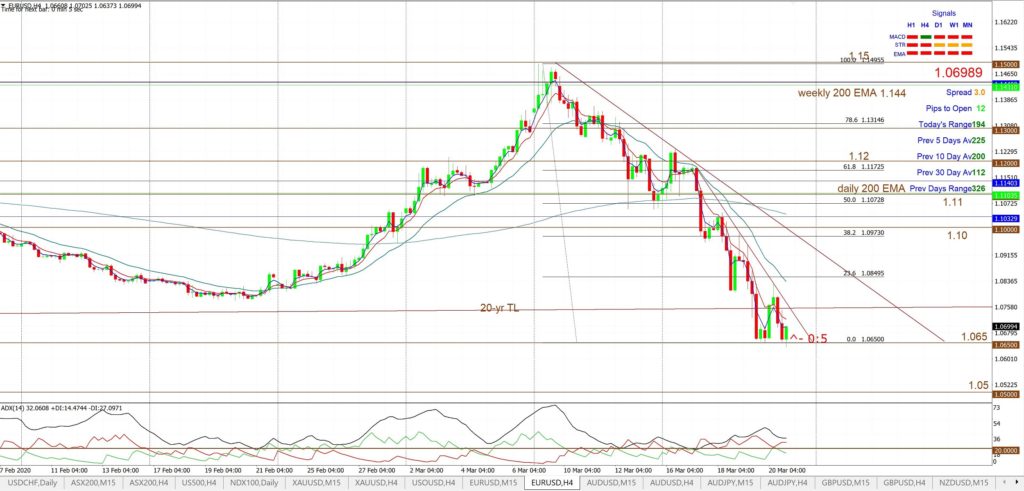
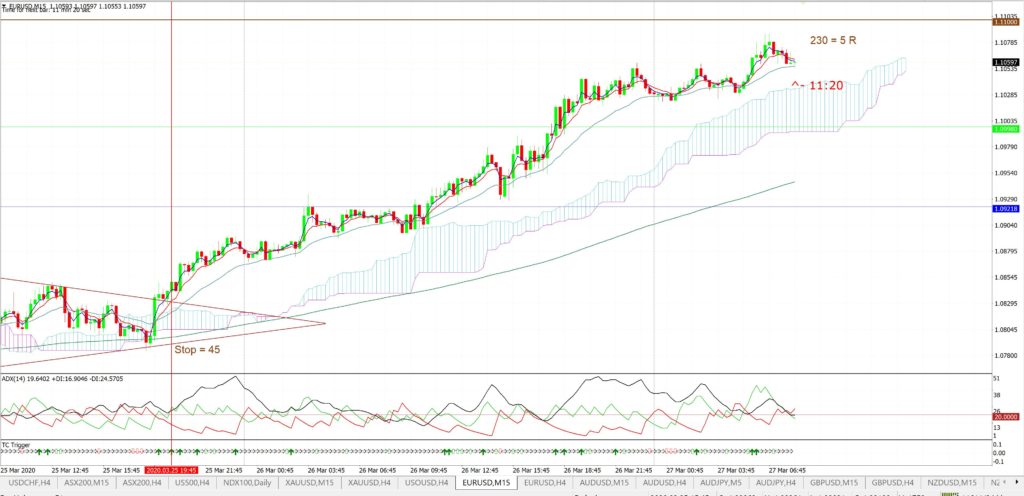
Example: EUR/USD: The following breakout trade triggered after the chart analysis that was posted on March 22nd 2020.
EUR/USD 4hr: chart from March 22nd 2020 analysis:
EUR/USD 4hr: chart after the 280 pip breakout move:
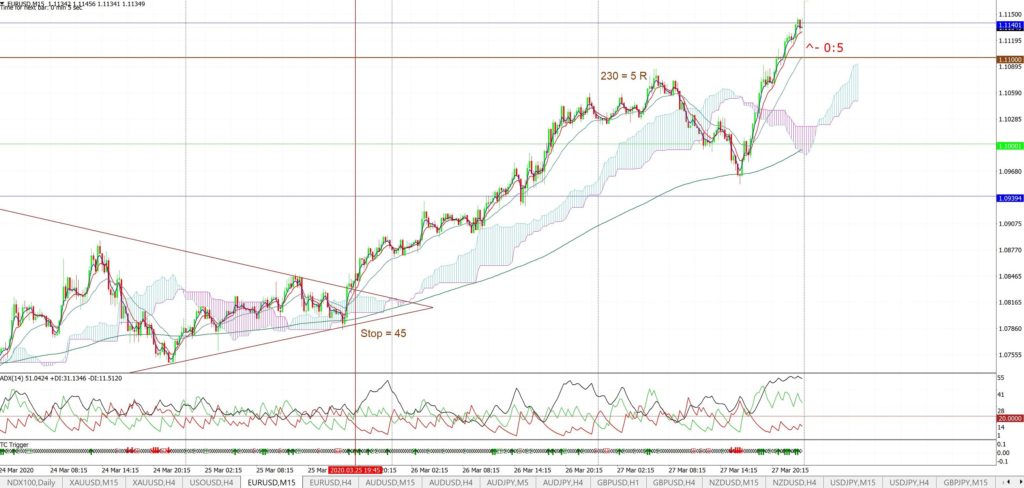
EUR/USD 15 min: this upper trend line breakout was visible on the 15 min chart. This also evolved with a new move above the Ichimoku Cloud. The risk was rather high for the EUR/USD but these have been more volatile markets and so this was to be expected. The target would have been best placed near the 1.10 level BUT note how price hovered just below this level. This is why it is probably better to place any Take Profit levels a bit before any major S/R level. In this case, price action ened up retreating quite significantly before eventually marching on and above the 1.10 level; as the second 15 min chart reveals.
Example: USD/JPY: The following breakout trade triggered after the chart analysis that was posted on March 22nd 2020.
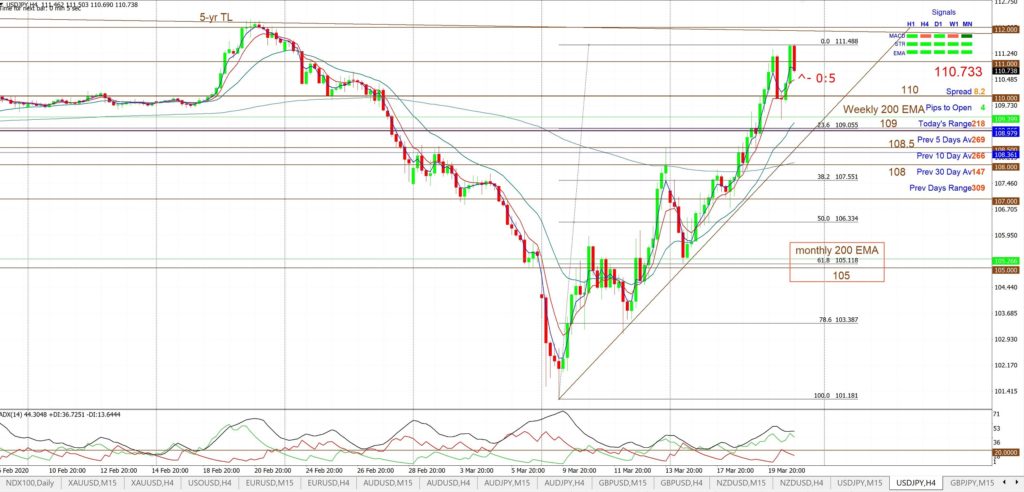
USD/JPY 4hr: chart from March 22nd 2020 analysis:
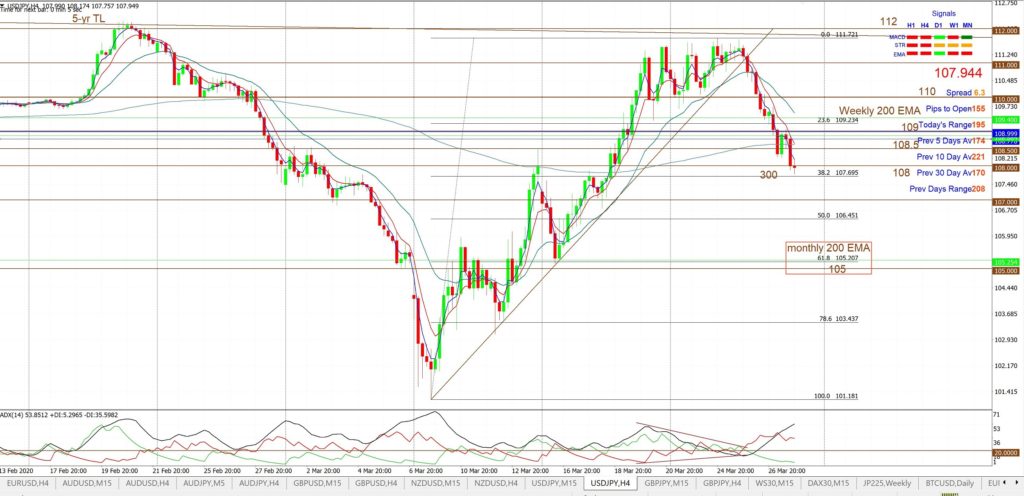
USD/JPY 4hr: chart after the 300 pip breakout move:
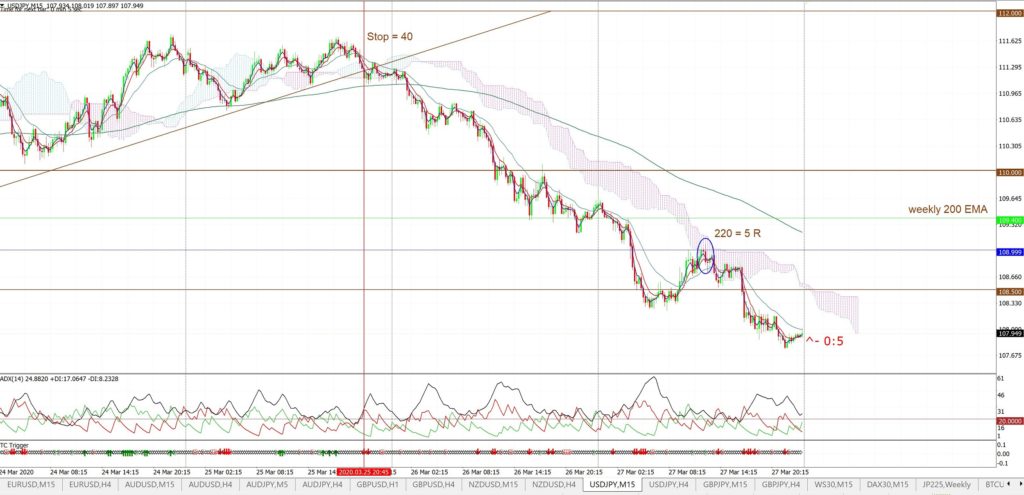
USD/JPY 15 min: This trade also triggered with a larger than desirable initial Stop but, as with the earlier EUR/USD example, market volatility would not have helped. This trade would have required some courage to stick with though as price action retreated into the Cloud shortly after the trend line break. Patience and discipline would have been rewarded though as waiting for either 108.50 or a move back into the Cloud would have given a great profit multiple:
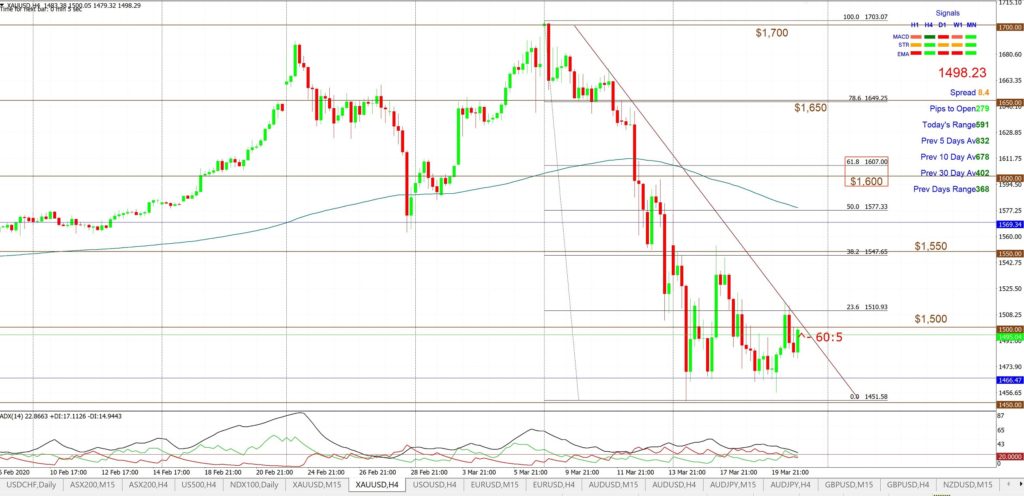
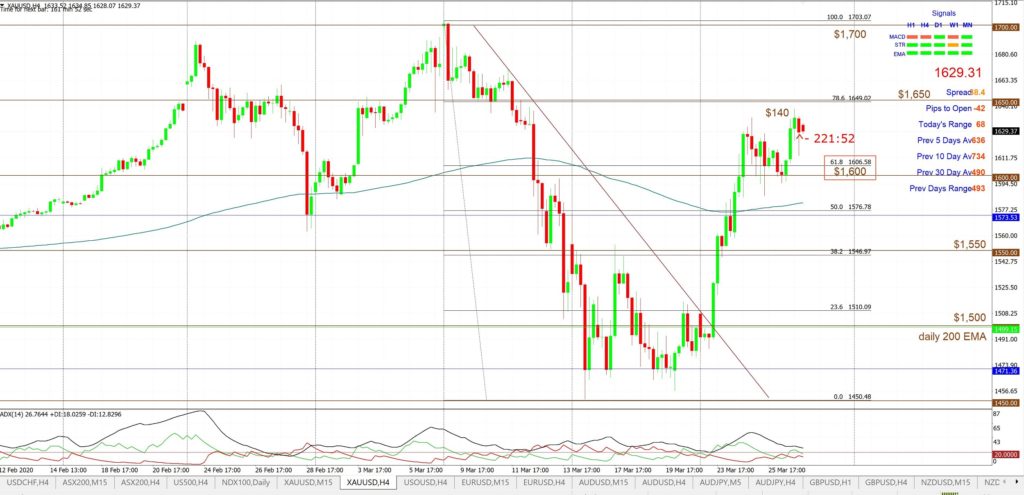
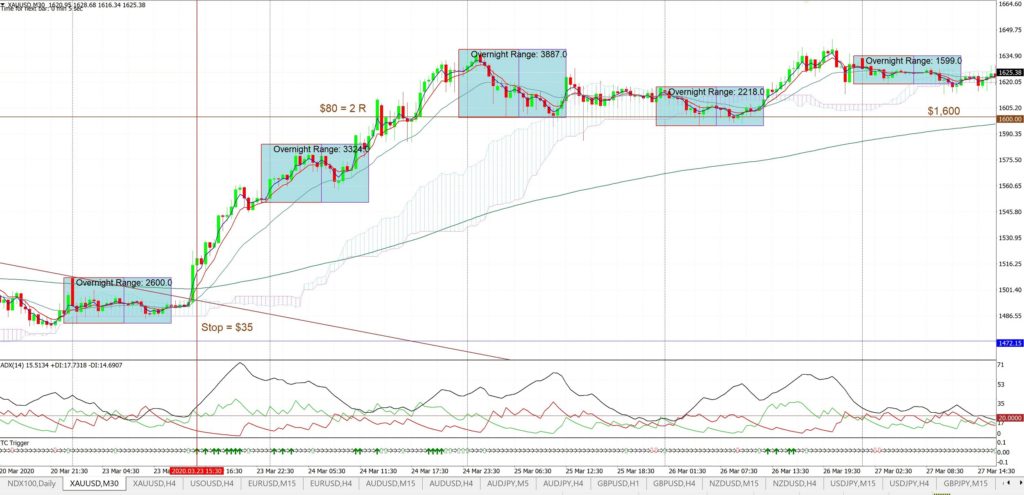
Example: Gold: The following breakout trade triggered after the chart analysis that was posted on March 22nd 2020.
Gold 4hr: chart from last week’s analysis:
Gold 4hr: chart following the 230 point breakout:
Gold 30 min: note how the trend line breakout here also evolved with a move up and out of the Ichimoku Cloud. The obvious target would have been the $1,600 level as this has been a strong S/R level for the precious metal.
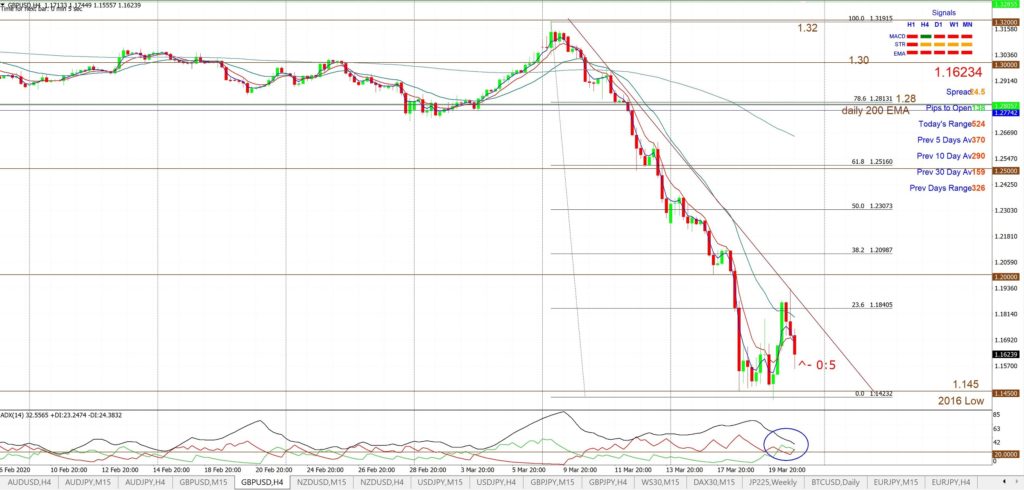
GBP/USD: The following breakout trade triggered after the chart analysis that was posted on March 22nd 2020.
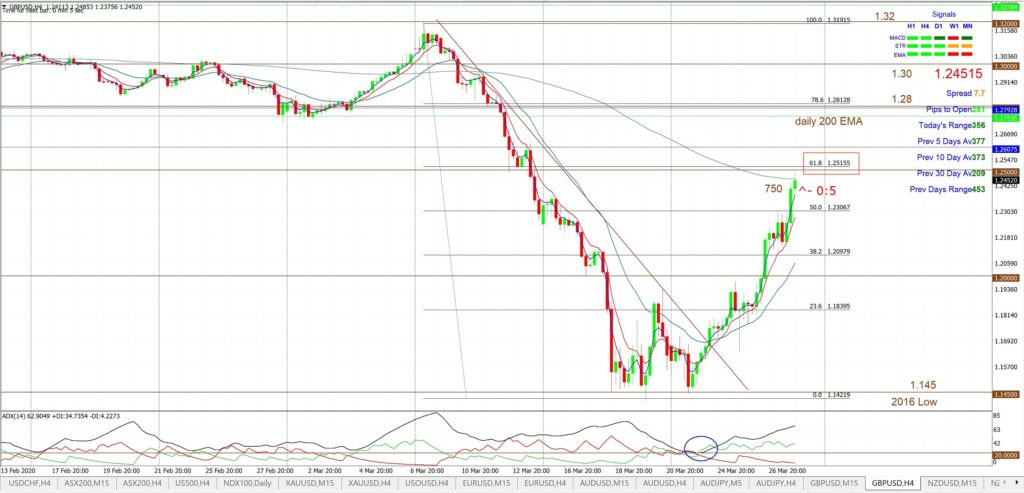
GBP/USD 4hr: chart from March 22nd 2020 analysis:
GBP/USD 4hr: chart after the 750 pip breakout move:
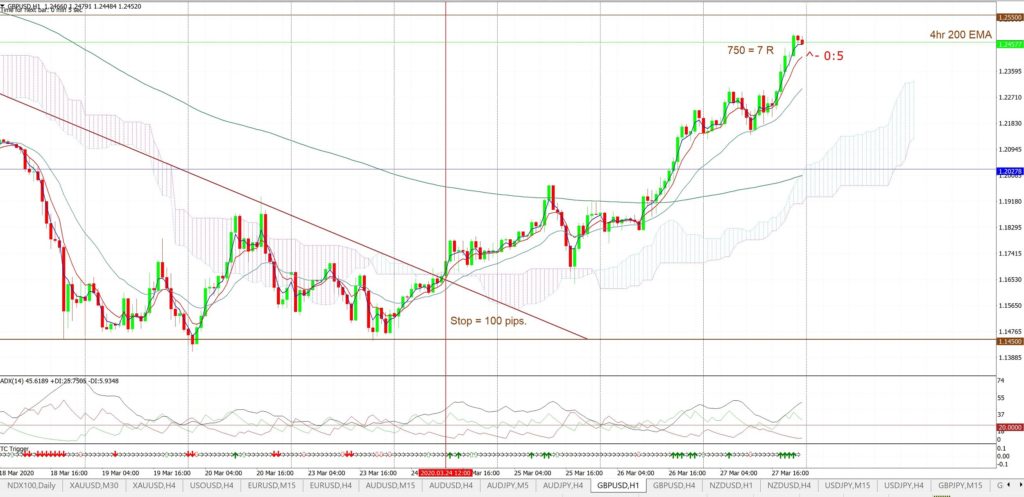
GBP/USD 60 min: The initial Risk here was High but to be expected with the Cable and the current market conditions. However, the target was always going to be near the 1.25 level as this was the 4hr chart’s 61.8% fib level. Taking profit again a bit ahead of this region would have been a sensible move:


