Tue 13th May (1.30 pm)
I have been charting the major US stock indices here and noting how they have all been consolidating within various technical charting patterns. Two of these indices have now made a breakout. I will be watching these to see whether they can hold these breaks for their weekly candle close:
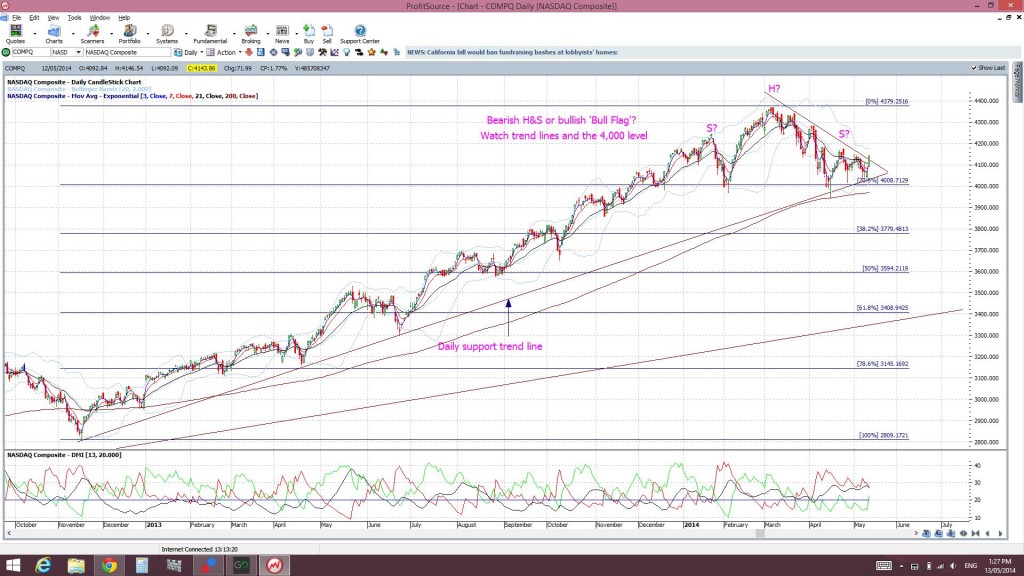
NASDAQ:This index has been consolidating in what could have been either a potential bearish H&S or a bullish ‘Bull Flag’ pattern. I had stressed the need to watch for a trend line break here to confirm the type of breakout. Price has now made a bullish break out and up from this flag pattern and I’ll be watching to see if this can hold:
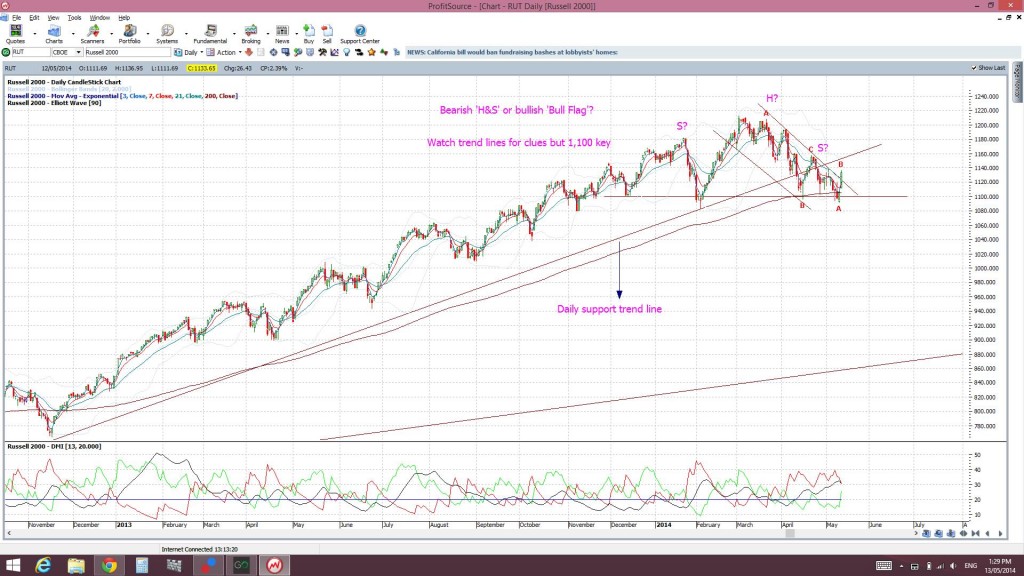
Russell 2000 Index: the ‘small caps’ index. This chart was presenting the same way as for the NASDAQ. This, too, has made a bullish break and I will also be looking for a weekly candle close out from this ‘Flag’:
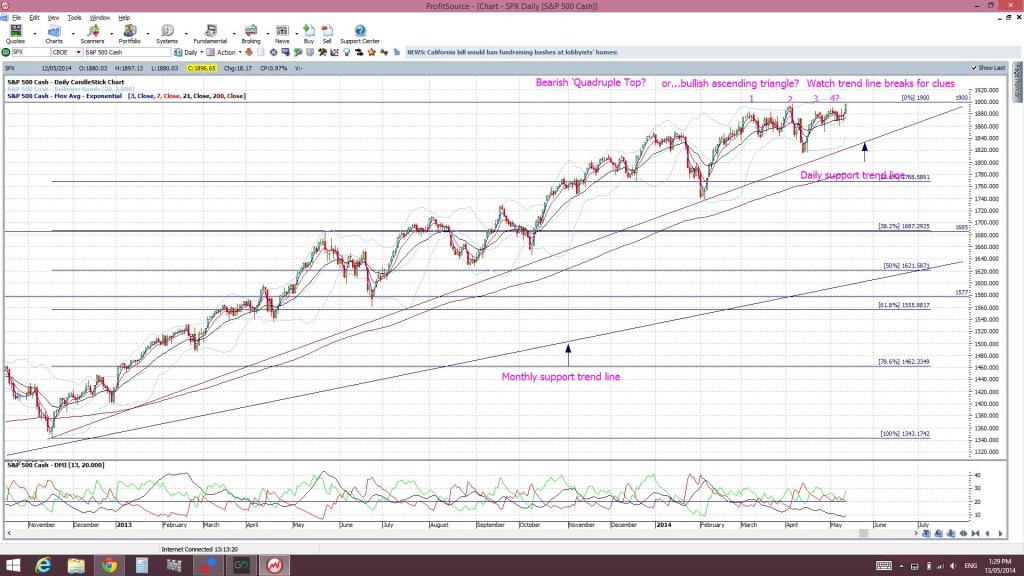
S&P500: this has printed a new high but I am looking for a close and hold above the 1900 level to confirm a bullish breakout here:
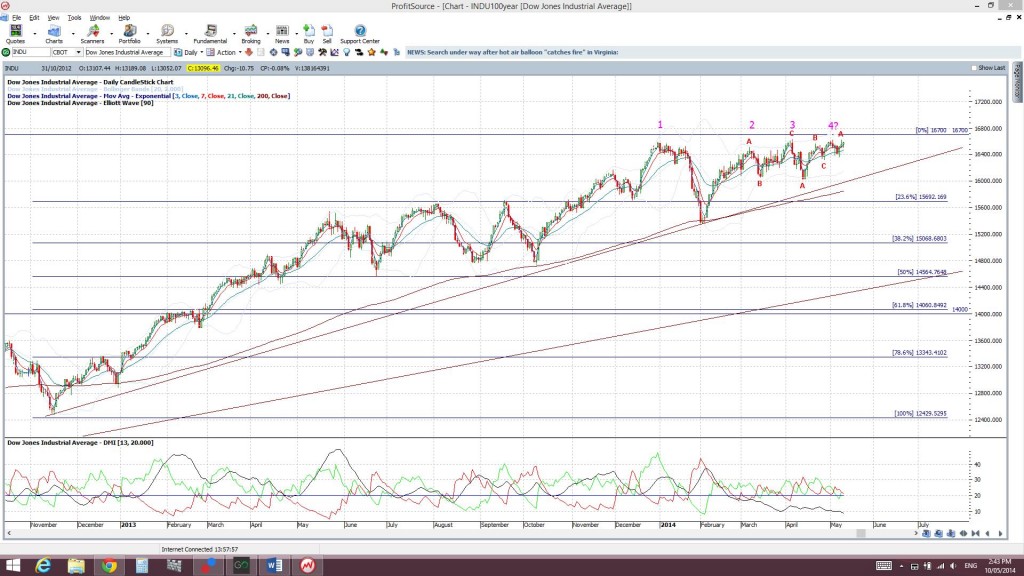
DJIA: as for the S&P500 but I’m looking for a close and hold above the 16,700 level:
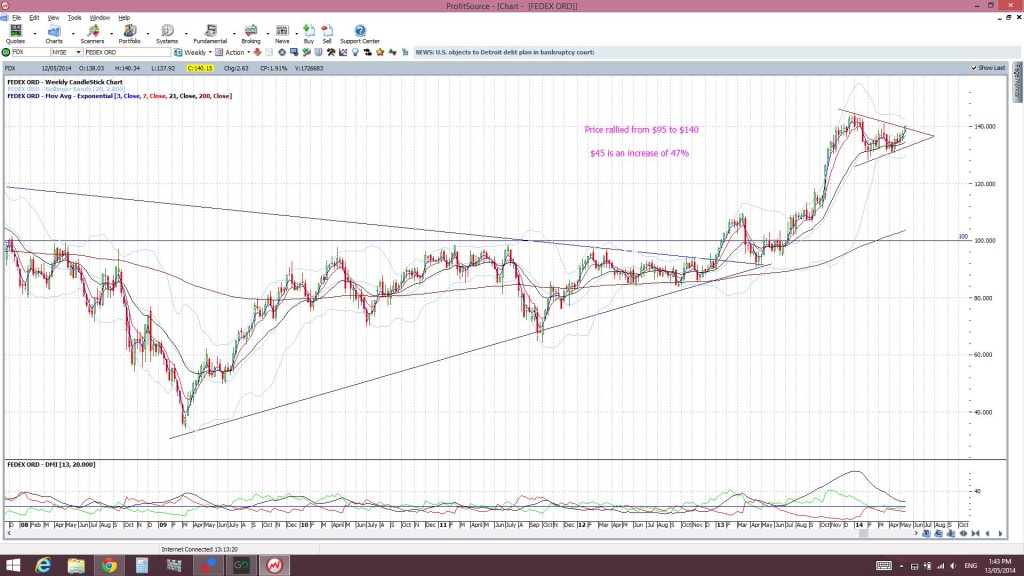
FDX Fedex: this ‘bellwether’ stock has broken out too but we need to see where the weekly candle eventually does close:
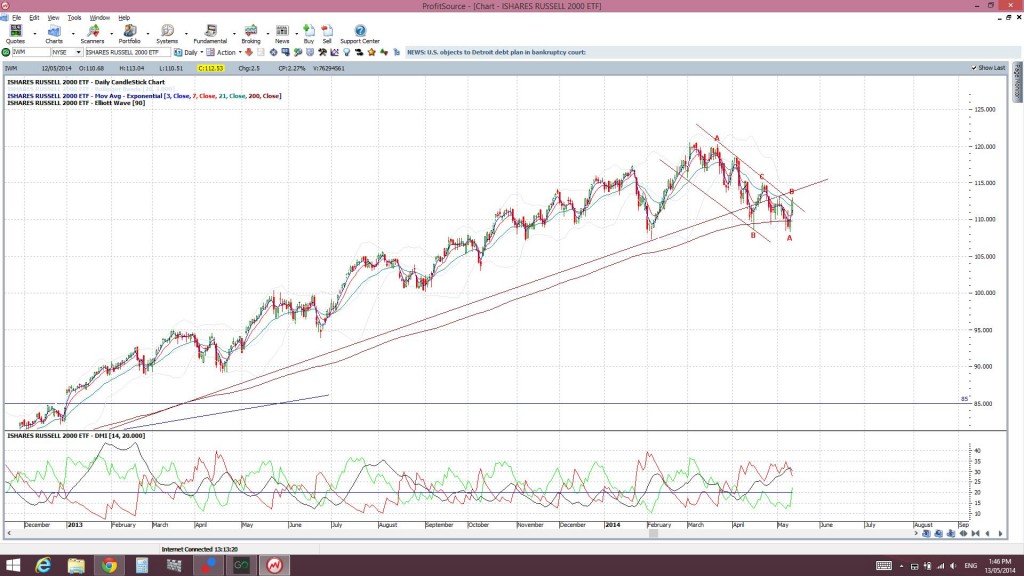
IWM: Russell 2000 ETF: has yet to breakout though:
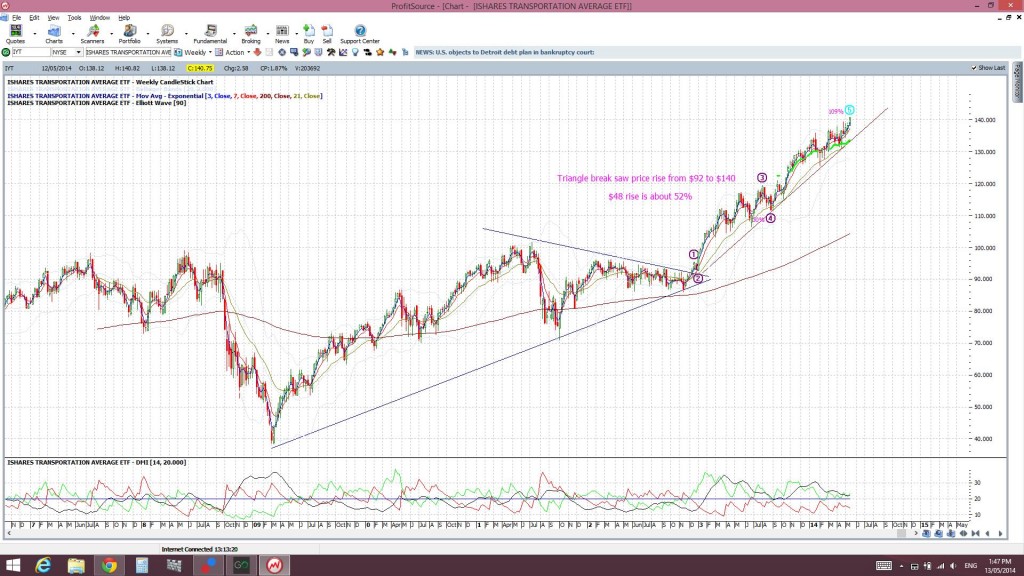
IYT: Transport ETF: this is much like Forest Gump and just keeps on running:
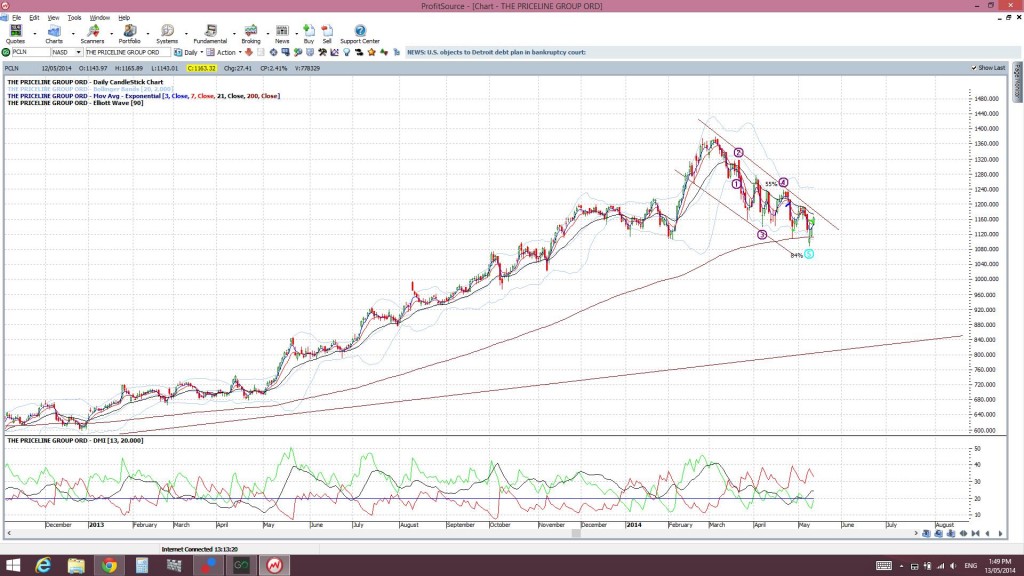
PCLN: Priceline: no breakout here just yet:
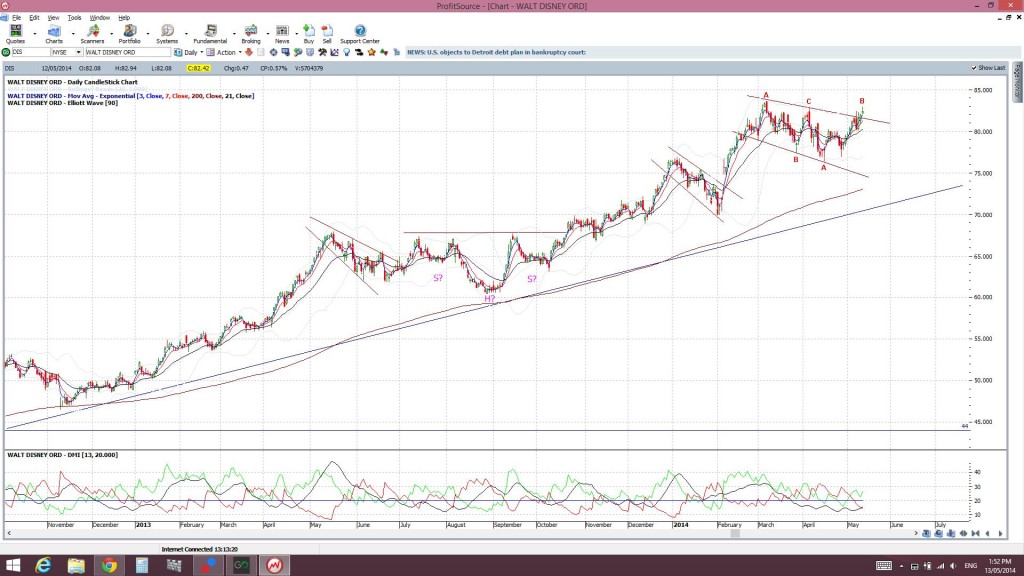
DIS Disney: has also broken out but the weekly close needs to be confirmed here too:
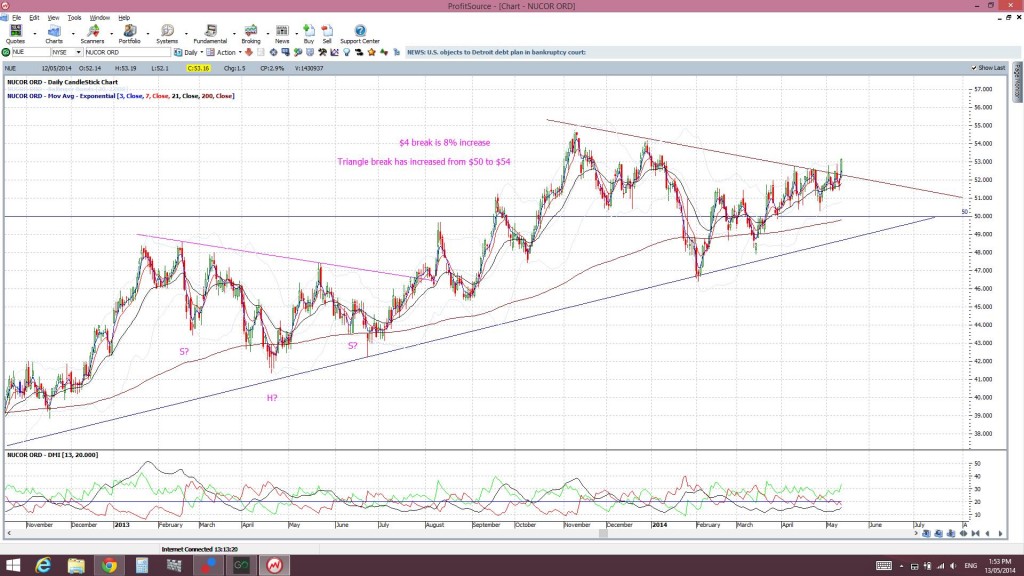
NUE: Nucor: has also broken out on the daily chart:
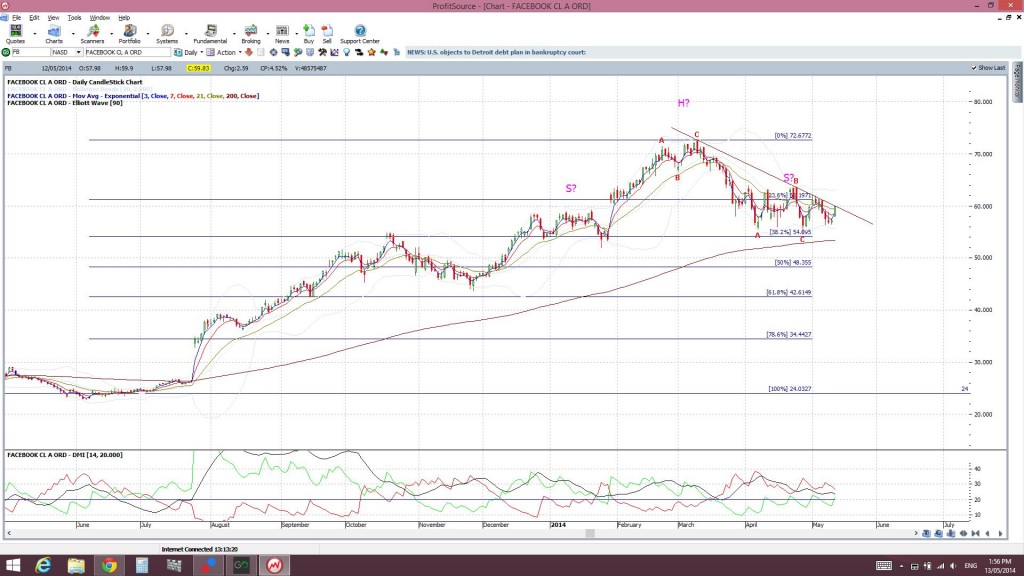
FB FaceBook: no breakout here just yet:
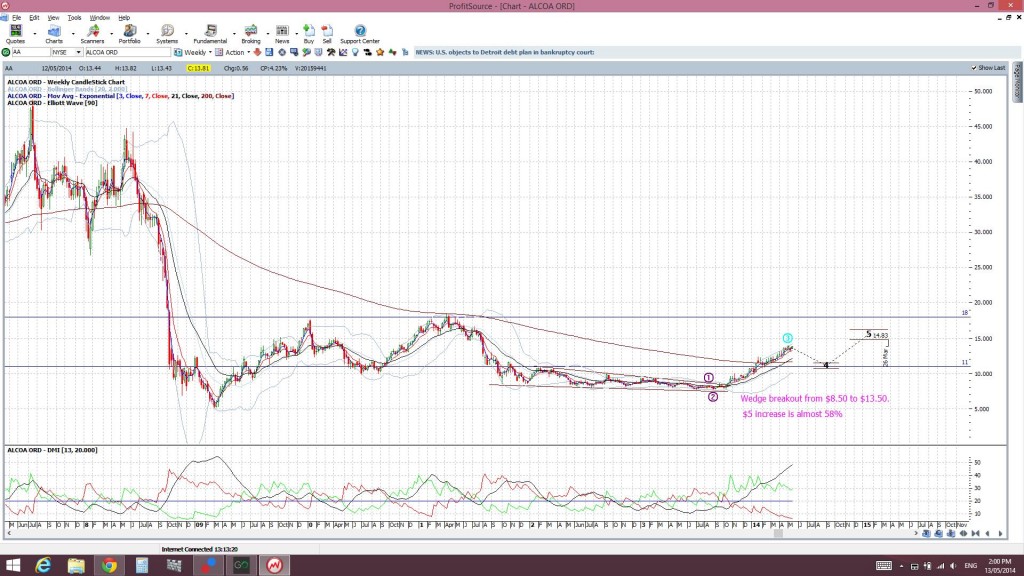
AA Alcoa: I consider that this stock is next headed towards $18.


