The following trend line breakout trade example is one from the GBP/JPY that triggered in August 2021 and follows the technical analysis regime that was outlined in the article available through this link. The GBP/JPY example highlights how mapping higher time frame charts with relevant Support and Resistance trend lines and, then, monitoring for momentum-based breakouts on lower time frames can lead to low-risk and high-reward trading opportunities.
In this example, trend lines were mapped on the 4hr time frame and the breakout was evaluated on the 30 min time frame.
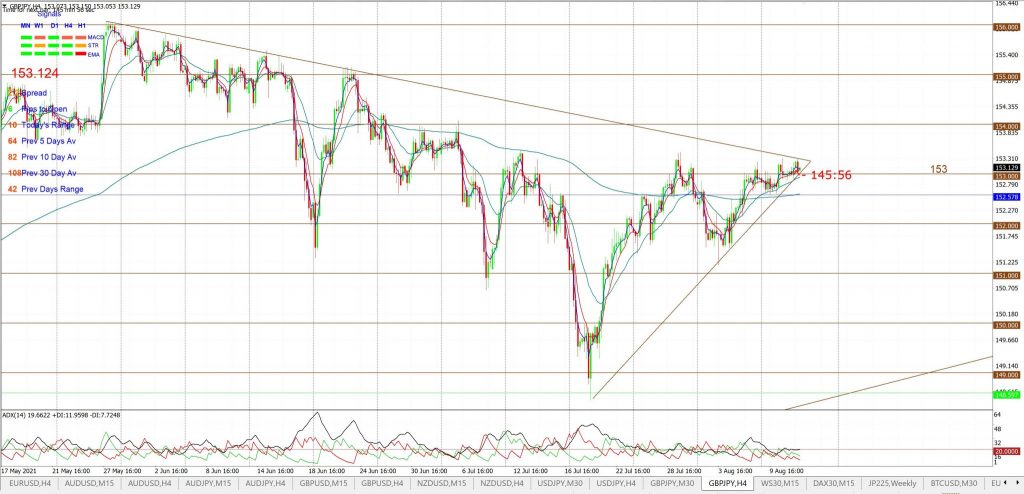
GBP/JPY on Thursday 12th August: the 4hr chart triangle pattern had been brewing on this pair for some days. I say ‘brewing’, because the trend lines were adjusted to follow price action during the period when momentum was low. Note how the ADX (black line in the lower pane) was flat-lining along the 20 level for this latest rendering of the trend lines and this reflected very low momentum.
GBP/JPY 4hr: The mantra here was, as it always is, to watch for any ADX momentum-based trend line breakout.
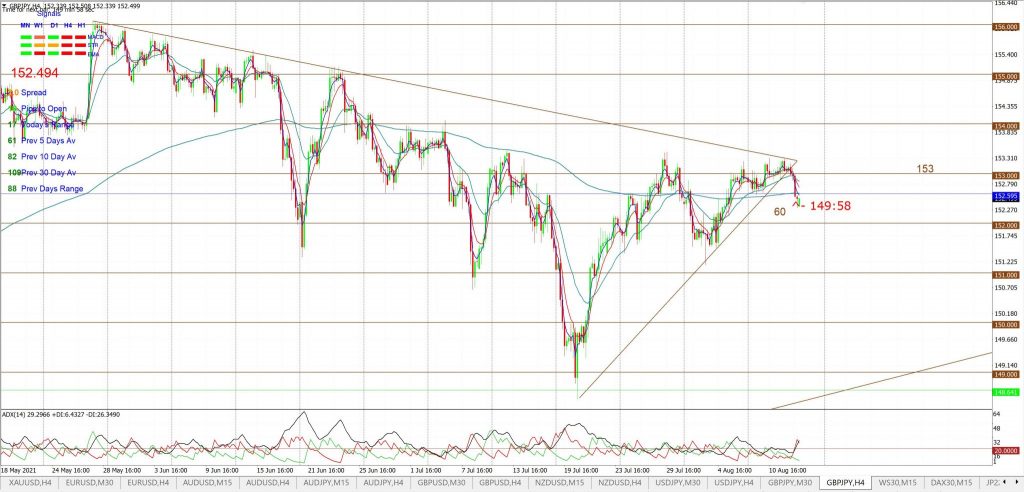
GBP/JPY on Friday 13th August: a momentum based trend line breakout did trigger and this was noted in my morning update on Friday August 13th.
GBP/JPY 4hr: this trend line breakout came with an uptick of the ADX indicator which helped to confirm this as a valid trend line breakout.
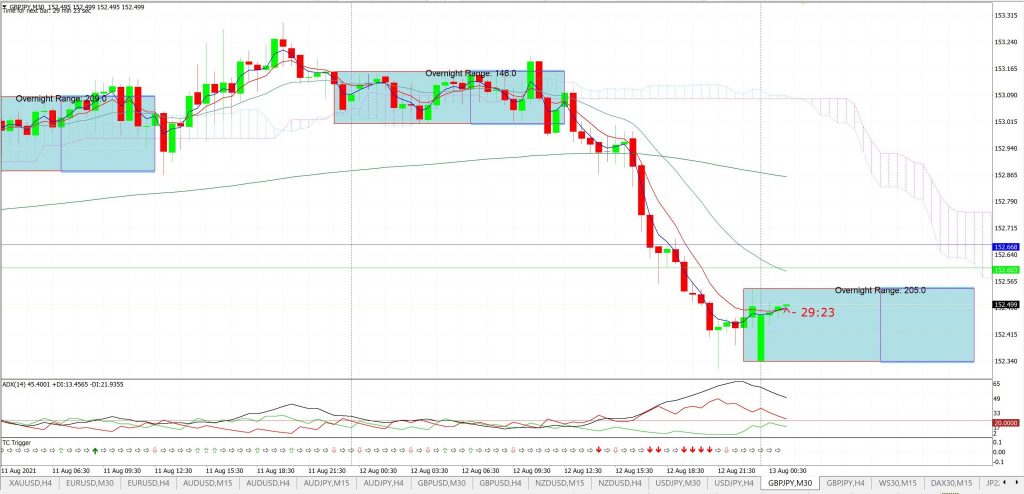
GBP/JPY 30 min: the 30 min chart shows that the weakness developed in the late European session on the Thursday 12th and continued through the US session.
Note how there was choppiness during the Asian and early European session, as shown in the Asian (blue) Box indicator, but how the ADX was a good guide here! The black ADX line did not lift decisively above 20 through the Asian or early Europe session and this would have helped being caught in the bullish fake-out during the early European session:
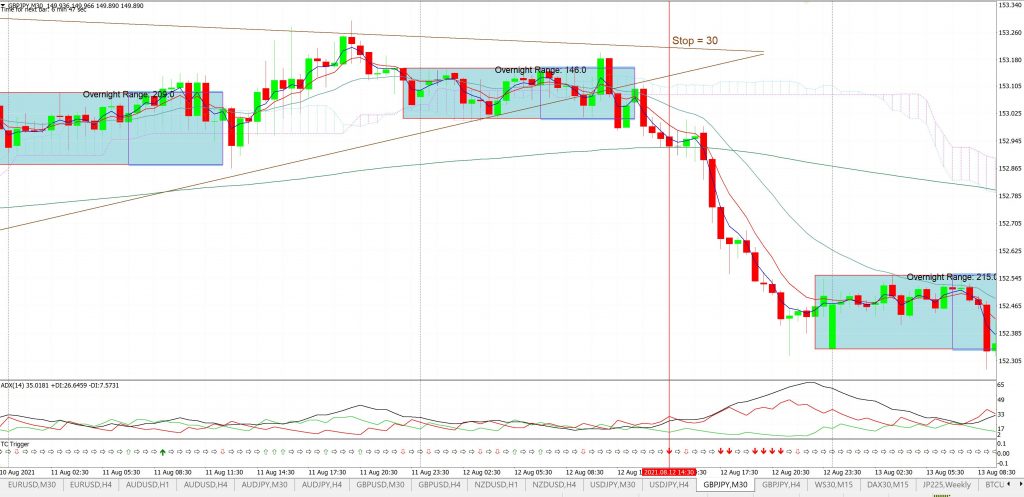
GBP/JPY 30 min: the 30 min chart below shows the positioning of the 4hr chart triangle trend lines at the time of the breakout. Note how the bullish fake-out during the European session did not actually break the upper triangle trend line anyway so this would have been another saving guide.
Bearish follow-through came after the bearish trend line breakout and this could have been identified by the uptick in momentum as signaled by the ADX rising above 20. FWIW: my TC Trigger also gave a clue here.
Any GBP/JPY trader who was able to catch this breakout trade as it triggered would have been able to enter the trade with a relatively low initial Risk. Placing a STOP on the other side of the upper triangle trend line gave a measure of around 30 pips:
Profit Targets: Profit targets would depend on the time frame of trading for the trader. For example, a short-term / day trader may have just used a 2R or 3R target meaning that they would use a 2x or 3x multiple of their initial STOP value. A longer term trader may have used a target such as the 61.8% Fibonacci or a particular horizontal S/R level.
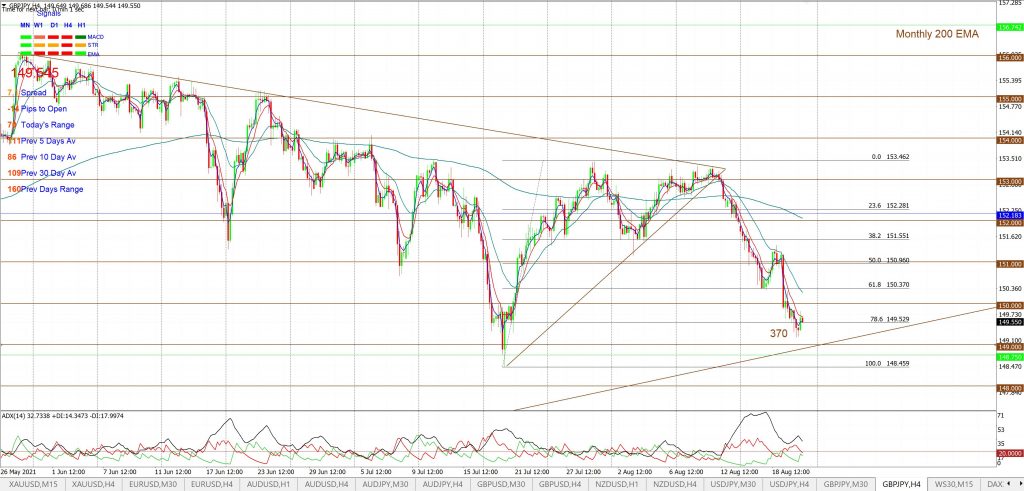
GBP/JPY on Saturday 21st August: the bearish-follow through continued through the week given the risk-off mood that permeated much of the trading that week due to US Federal Reserve taper concern and rising Covid delta cases. This general mood helped to lift the US$ and Yen thereby helping this bearish move on the GBP/JPY.
GBP/JPY 4hr: By Saturday morning on August 12th the TL b/o trade had given up to 370 pips. Any trader who stayed with this trade for the week would have been able to achiever almost 350+ pips for an initial risk of around 30 pips. That gives a Risk / Reward of around 30: 350 or over 10 to 1, or 10 R, which isn’t too bad!
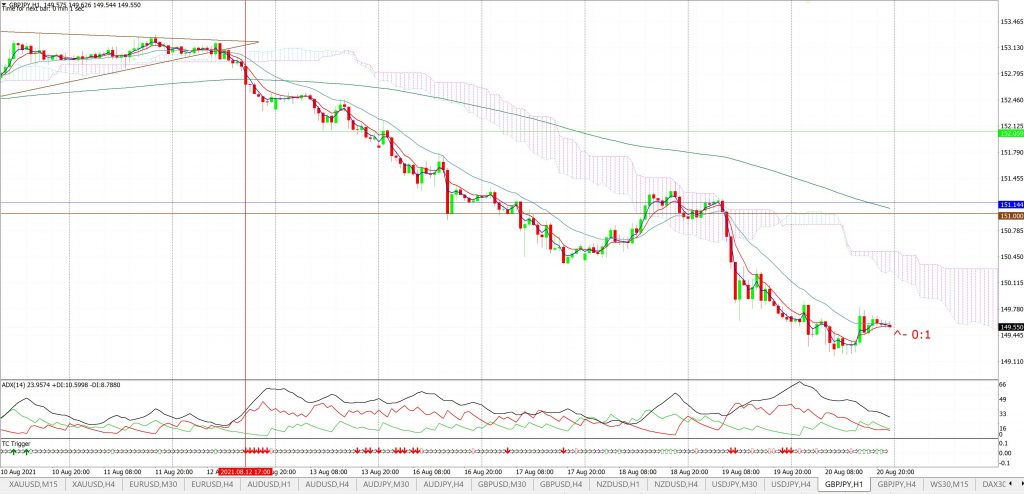
GBP/JPY 60 min: this 60 min chart shows how the TL b/o had started back on Thursday 12th Aug:
Concluding comments:
The aim of this article was educational in nature to help traders and investors understand how technical analysis can applied to assist with identifying trading opportunities. Traders can benefit from adopting a disciplined approach to their technical analysis by mapping areas of Support and Resistance with trend lines on higher time frame charts and, then, monitoring lower time frame charts for momentum-based trend line breakouts. Doing so may enable the trader to catch a breakout move that involves a lower risk trade setup.
The example in this article used a combination of 4hr and 30 min Forex charts but the same logic applies to mapping trend lines on any trading instrument and on other time frame combinations. For example, I apply this approach to the weekly charts of stocks and then drop down to daily charts to monitor for trade entry opportunities. In fact, any combination of time frames can be applied on anything you can chart!
As with all trading and investing, only ever use funds that are surplus to your needs and that you can afford to lose and to manage risk appropriately.
Disclosure: I did not catch this particular trend line breakout trade as it triggered during my evening. Traders who are stalking trend line breakout trades may choose to use trend line breakout indicators to alert them to new breakouts. Many charting software platform offer alert services that can be emailed or sent by SMS to your phone.


