Introduction: This chart review of the Mexican Peso was prompted after my viewing of Blake Morrow’s weekend video analysis and details of this video can be found through the following link. The Mexican Peso generally trades inversely to that of the S&P500 and, with the US major stock index looking a bit toppy / extended, it might be worth watching the Peso for any potential recovery.
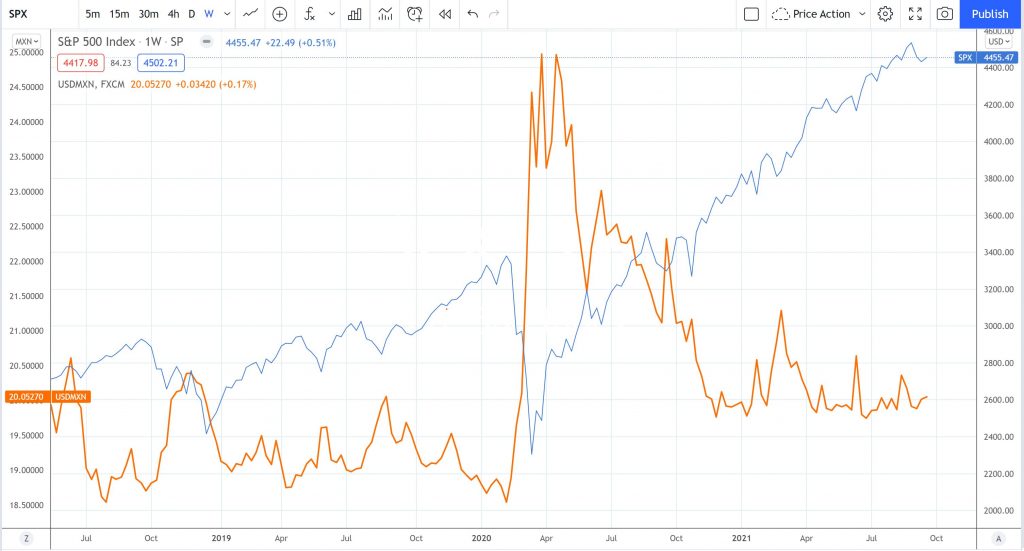
USD/MXN versus S&P500: the weekly chart below shows the USD/MXN as the yellow line and the S&P500 index as the blue line. It is rather clear from this chart that the pair generally trade inverse to each other. Thus, if the S&P500 is to have any pause or pullback following this rather lengthy 18-month rally, then the USD/MXN could be due to for some gain.
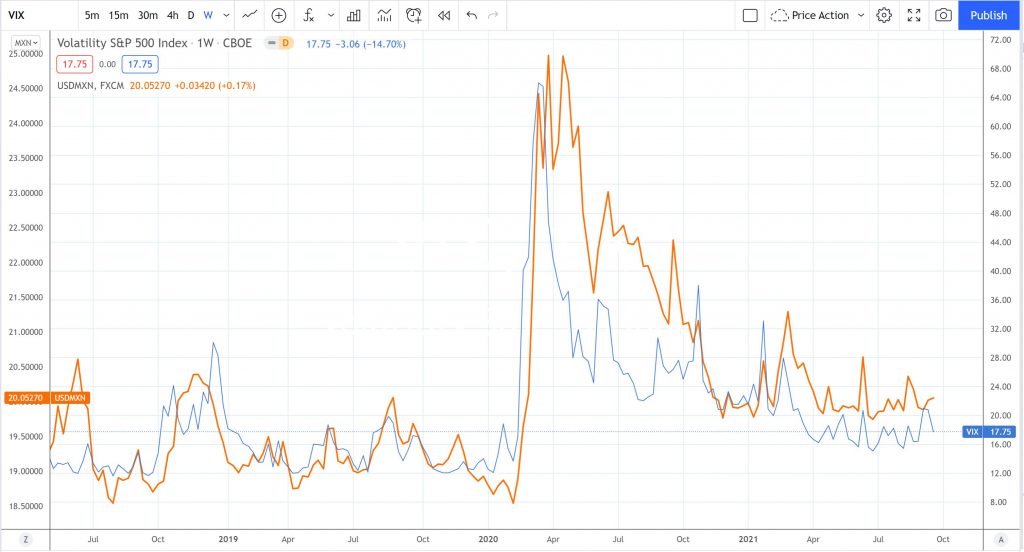
USD/MXN versus VIX: the weekly chart below shows the USD/MXN as the yellow line and the VIX (fear) index as the blue line. It is rather clear from this chart that the pair generally trade in tandem. Thus, if fear and volatility spiked with any stock market pullback, then this may also help to underpin gains for the USD/MXN.
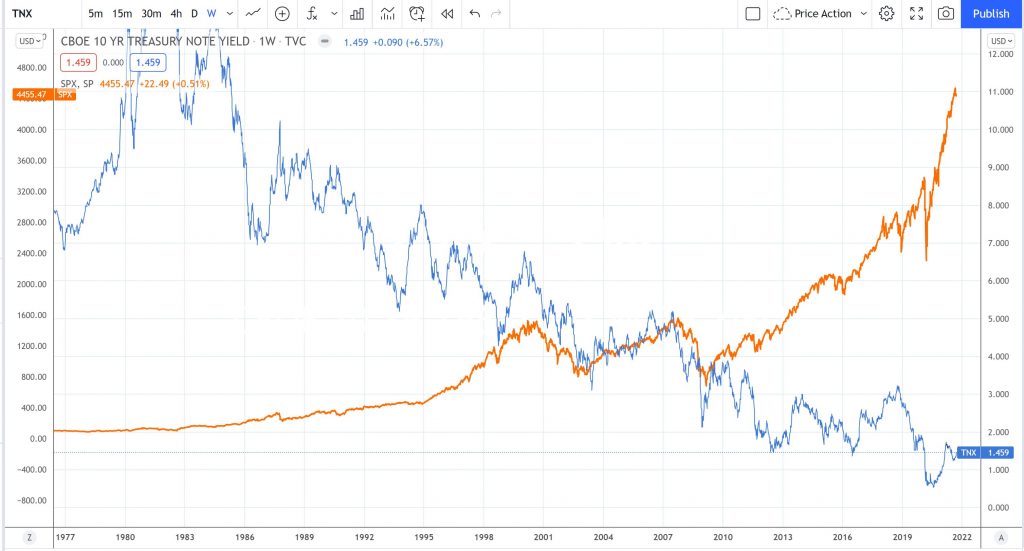
TNX versus S&P500: the weekly chart below shows the 10 Yr Treasury yield as the blue line and the S&P500 index as the yellow line. It is rather clear from this chart that the pair not always, but more often than not, trade inverse to each other. It would not be a stretch to think that any spike with the 10 Yr Treasury yield might trigger a pause, or even pullback, with the S&P500.
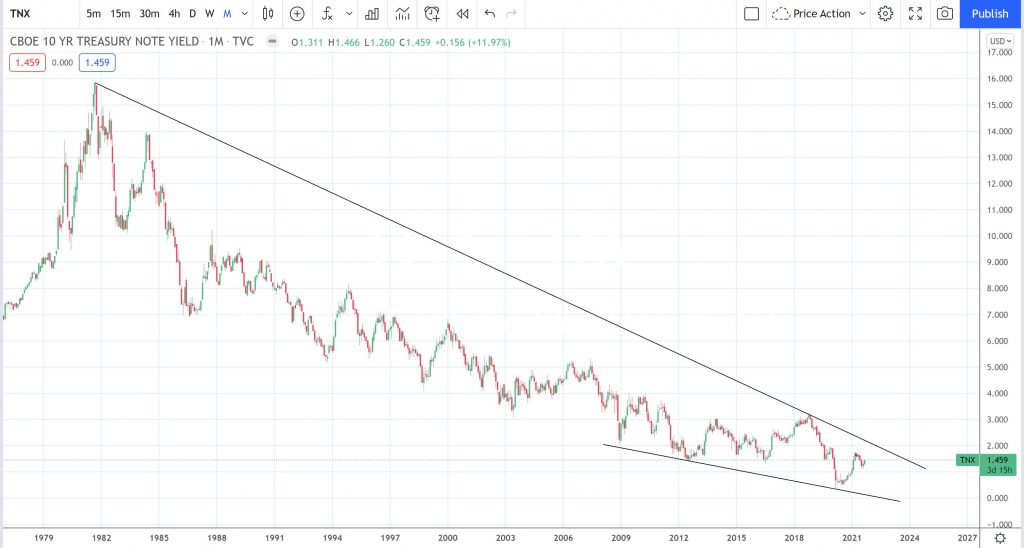
TNX: The Federal Reserve has already indicated that US stimulus will soon be wound back and that ultimately leads to questions about when are US interest rates likely to rise. My focus here, though, is more technical than fundamental and, so, my question is more along the lines of: are there any technical clues that the 10 Yr Treasury yield could be due a recovery? The monthly chart of the 10 Yr Treasury yield (TNX) shows that price action could be considered to be trading within a bullish-reversal descending wedge pattern. I find these to be one of the most high probability chart patterns of them all and I have numerous pages on my site where you can see examples of successful wedge breakout patterns on pages here and here.
This second monthly TNX chart shows that one potential target for any bullish trend line breakout would be up near the 61.8% Fibonacci region, circa 9.90, and this is also a region of previous price reaction. I have numerous examples on my site about how the application of a Fibonacci retracement tool can help identify trend line breakout targets and these can be found linked here and here.
This chart is well worth watching for any potential bullish breakout as this may then offer clues about the next directional move of the S&P500 and, in turn, the USD/MXN.
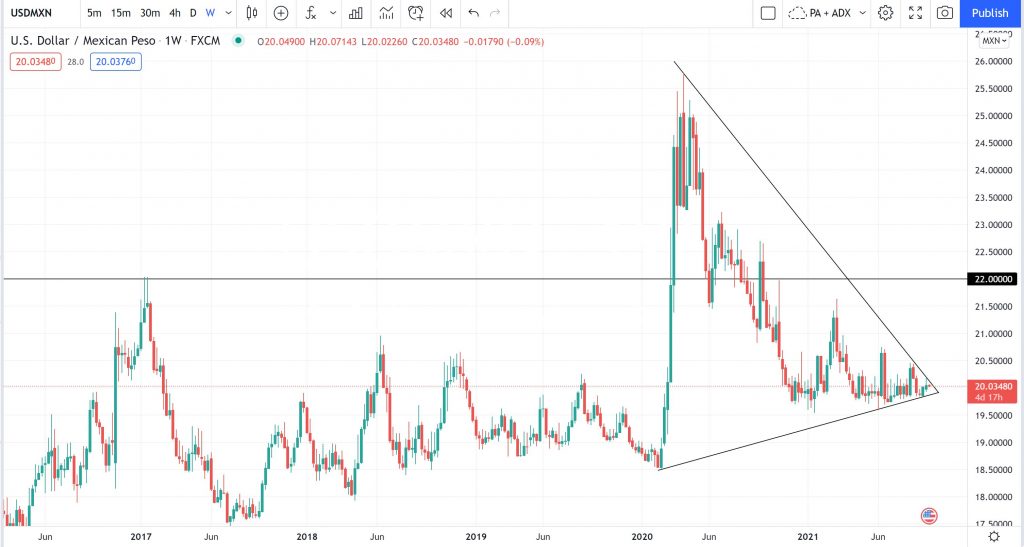
USD/MXN weekly: the chart below shows that recent price action for the USD/MXN can be captured within a triangle congestion pattern. I have drawn a horizontal line in at the 22 level as this marks the previous High prior to the Covid-inspired Feb 2020 – April 2020 rally. This 22 level would be one resistance to monitor if there was to be any bullish trend line breakout.
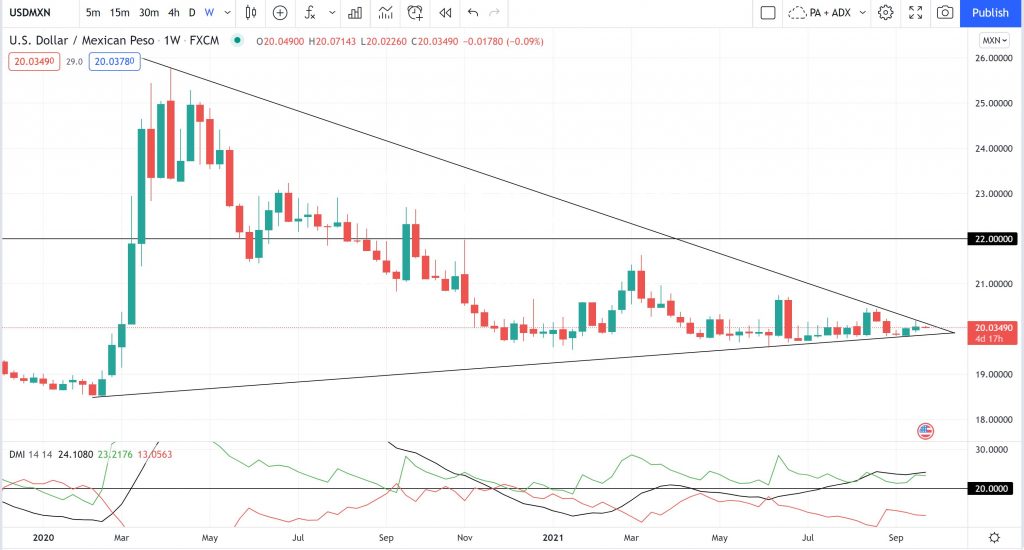
USD/MXN weekly: this is just a more expanded weekly chart that also shows the momentum indicator ADX in the bottom pane. The idea is to watch for any trend line breakout that evolves with an uptick in the ADX (black line) and +DMI (green line) but these are already elevated so we need to drop down to the daily chart to see if that is of better help.
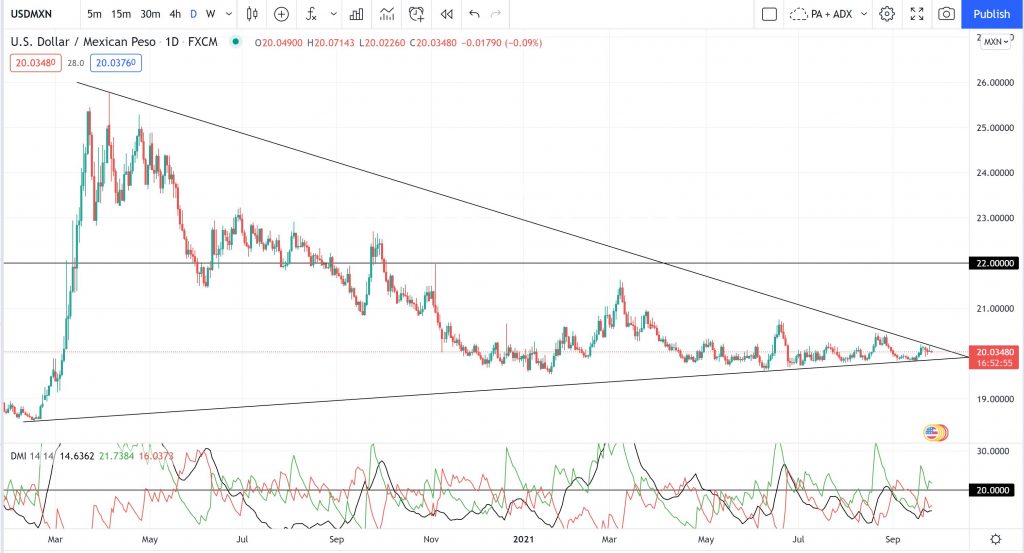
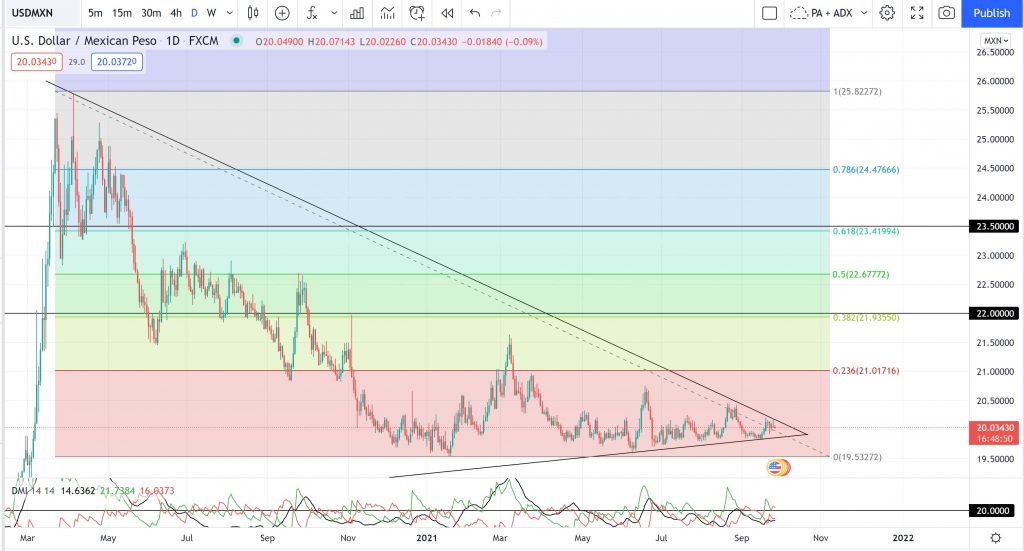
USD/MXN daily: The daily chart of the USD/MXN shows that bullish momentum, the +DMI green line, is already above 20 but the ADX remains below the threshold level. Thus, watch for any bullish trend line breakout that evolves with an ADX move above 20 and with the +DMI remaining above 20 and rising.
USD/MXN daily: the chart below has a Fibonacci retracement tool applied to help identify target levels for any potential bullish breakout. One obvious target level would be the previous resistance of the horizontal 22 level. After that, watch for any push to the 23.9 region as this is near the popular 61.8% Fibonacci region and this is also a region of previous price reaction.
Concluding comments: The S&P500 stock index has enjoyed a lengthy rally off the Covid inspired April 2020 lows that has endured now for over 18 months. Trends do not travel in straight lines unabated and so a pause or pullback at these lofty levels would not surprise, even if the pause is only temporary.
One such trigger for a pause could be that of some bullish recovery with the 10 Year Treasury Yield, and / or or a spike with the VIX, and so these are two metrics worth keeping in mind. Currency traders might consider the USD/MXN as a candidate for trading any pullback with stocks or spike in yields and / or the VIX and so trend lines on the USD/MXN have been added for traders to monitor.
As with any trading activity, only ever trade with funds that are surplus to your needs and that you can avoid to lose as all trading carries risk. Make sure that you limit your risk to a suitable small percentage of your trading account and follow your tested trading plan. Also, remember to trade what you see and not what you think.


