The Double Bottom
The Double Bottom is a bullish-reversal chart pattern and more information about this pattern can be found through the following link.
Basically, the target for any bullish breakout move is calculated as being the Height of pattern as it would extend beyond the top neckline.
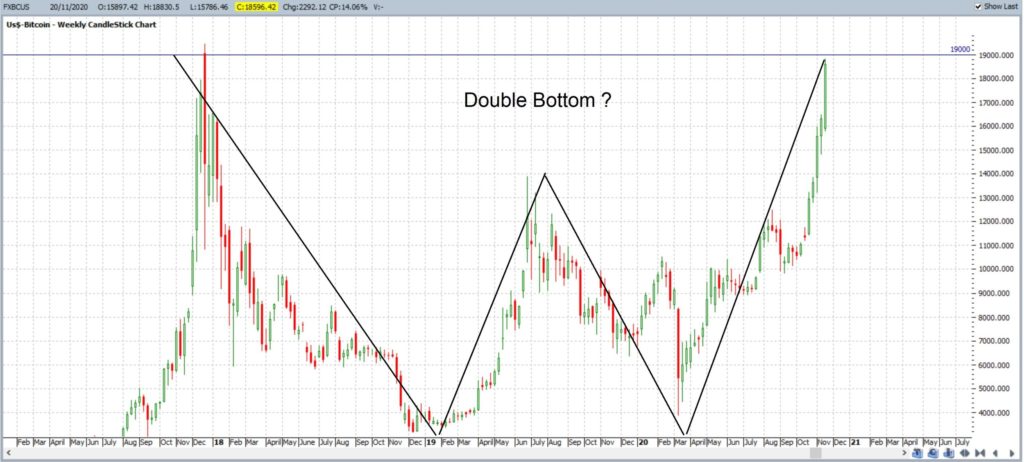
A Double Bottom formed on BTC/USD in November 2020 and the chart, shown below, was initially posted in an article that can be found through this link.
The ‘Height’ of this Double Bottom was approximately $16,000. This is calculated as being the distance from the lower level of the Double Bottom, approximately $3,000, to the height of the upper Neckline, at $19,000. Thus, the target for any bullish breakout move above $19,000 would have been around $35,000. That is, $19,000 + $16,000:
BTC/USD weekly: The Double Bottom chart from Nov 20th 2020:
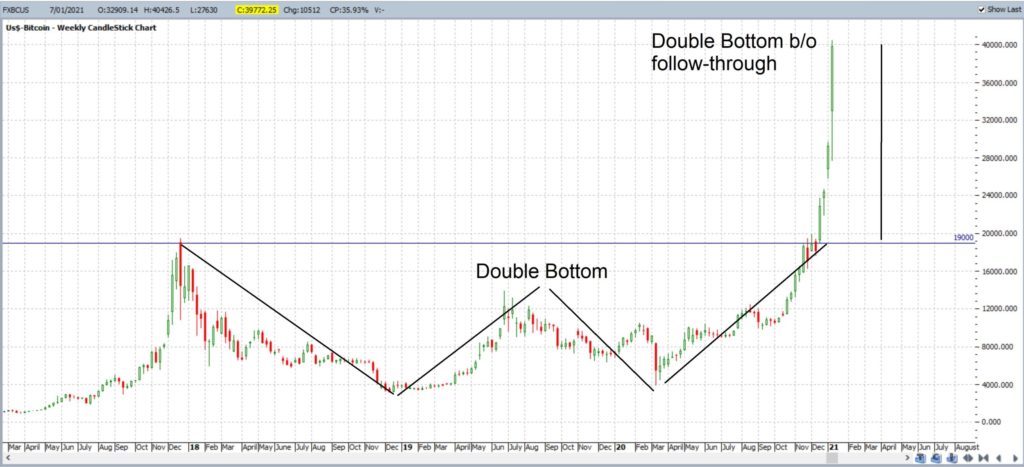
The target move to $35,000 was achieved and passed by January 8th 2021 as the chart below reveals:
BTC/USD weekly: The Double Bottom chart follow through as of Jan 8th 2021:
Keep an eye out on your charts for any Double Bottom as they are well worth monitoring.


