This article is a follow-up to one I wrote about Telstra stock back in June this year. In that article I noted how Telstra looked to be forming a base and had carved out a bullish-reversal Morning Star pattern. It seems this was spot on as the stcok has now gone on to make a bullish breakout from a descending wedge. I find descending wedge patterns to be one of the most reliable patterns so I will be going LONG on Telstra next Monday.
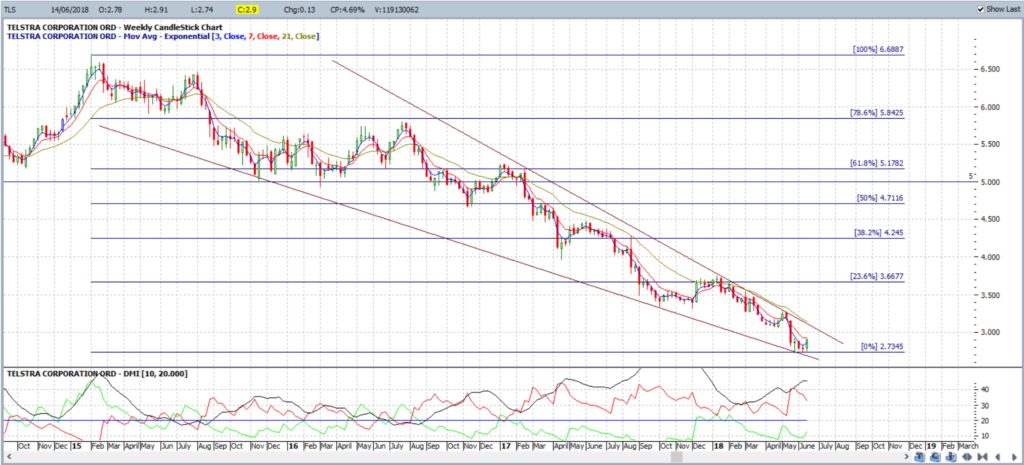
Telstra weekly: this was the chart I posted back in June showing the developing descending wedge. There was still a pattern of lower Lows and lower Highs:
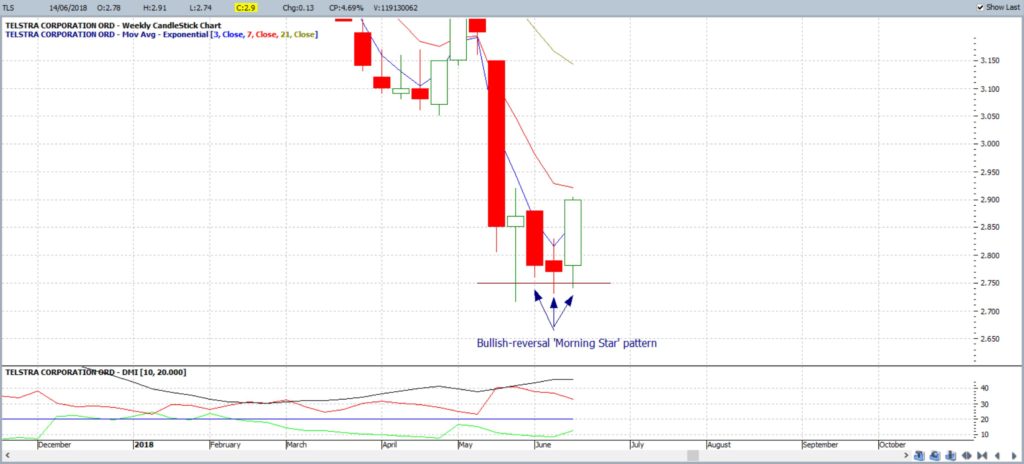
Telstra weekly: This was the chart from back then showing the bullish-reversal ‘Morning Star’ pattern, despite the continued down trend. This pattern was a warning that the downtrend might be about to slow or stall:
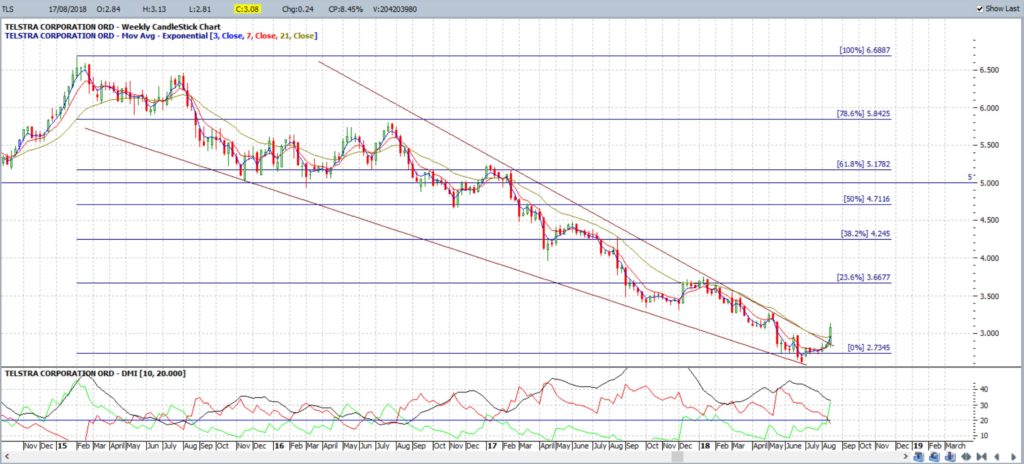
Telstra weekly: this is how the chart appears after Friday’s close and note the bullish trend line breakout. This breakout marks the end of Telstra printing lower Highs as we now have a higher High! I will be watching for any recovery here up towards the weekly 61.8% fib which also happens to be near previous S/R at the $5.00 level.
Summary: Telstra has been in a downtrend since 2015 but trends do not continue in straight lines forever. Telstra has finally broken the pattern of printing lower Highs and I will be looking for continued recovery up to the weekly chart’s 61.8% fib, near $5 S/R.


