In January 2017 I had part of my algorithm coded into a new indicator and this now appears at the bottom of most of my MT4 charts. This is called the TC Trigger and it codes the ADX plus other indicators within my TC System. The TC Trigger is not used in isolation to determine any new LONG or SHORT signal though. It is a supporting indicator, a trigger to confirm a signal assuming other conditions are met. Namely price action location in relation to the Ichimoku Cloud and the 3,7 and 21 EMAs. The screen shot below shows the TC Trigger with the various symbols (click on image to make larger for viewing):
Arrows: The ‘arrows’ indicate the following:
- ⇒ : no TC signal.
- ⇑ : a TC LONG signal might be building.
- ↑ : the conditions support a TC LONG if price is also above the Cloud and 3, 7 & 21 EMAs.
- ⇓: a TC SHORT signal might be building.
- ↓: the conditions support a TC SHORT if price is also below the Cloud and 3, 7 & 21 EMAs.
The TC Trigger can be used on any time frame of chart, however, since my 2016 trading trip to Europe I have been more focused on applying the algorithm to shorter time frame charts.
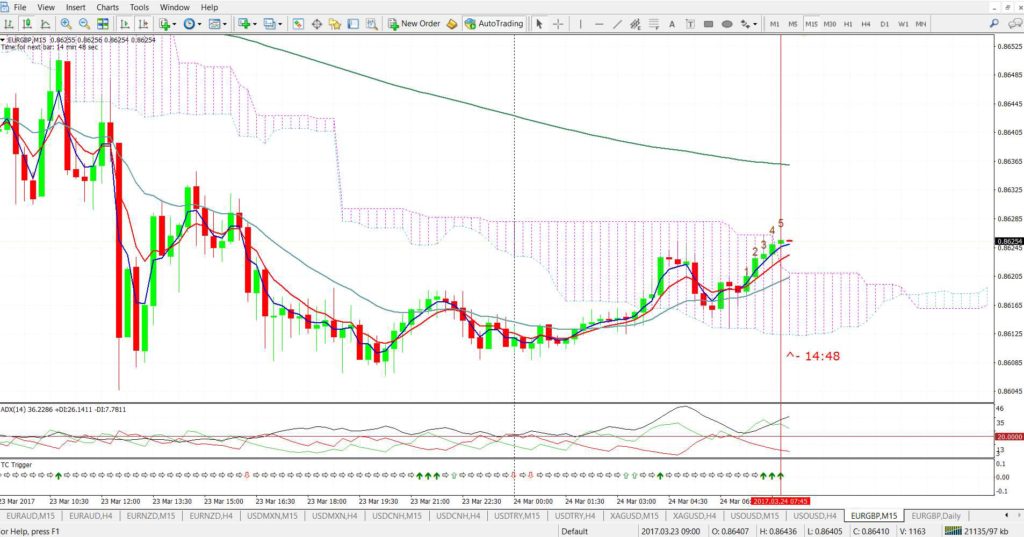
The TC Trigger and new TC signal: Note on this 15 min chart of the EUR/GBP how the 5th candle after the EMA crossover closes above the Cloud and this aligns with an up green arrow on the TC Trigger. This constitutes a new TC LONG signal:
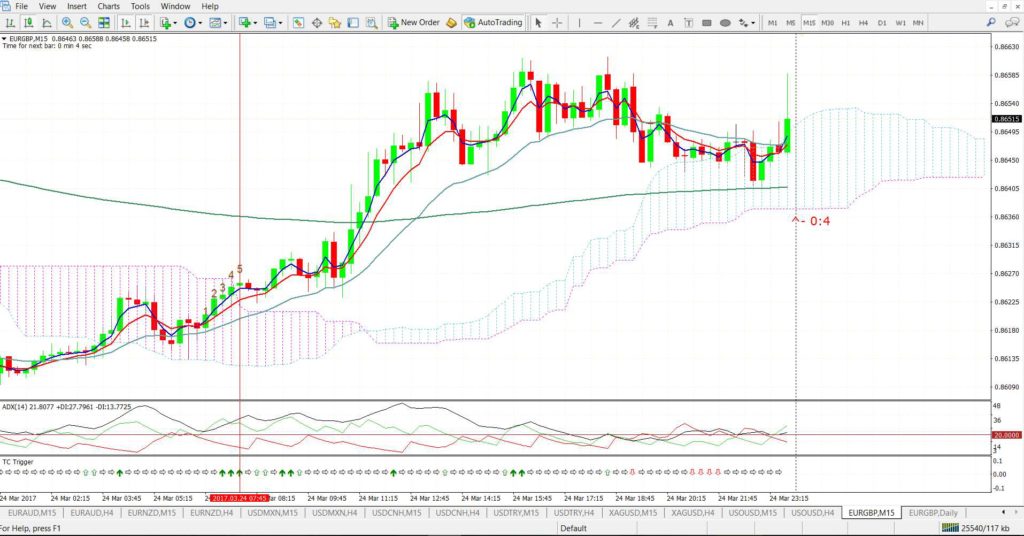
The EUR/GBP is a rather low yielding pair but it can be seen that this signal went on to be profitable for about 35 pips:
Examples of Using TC Trigger:
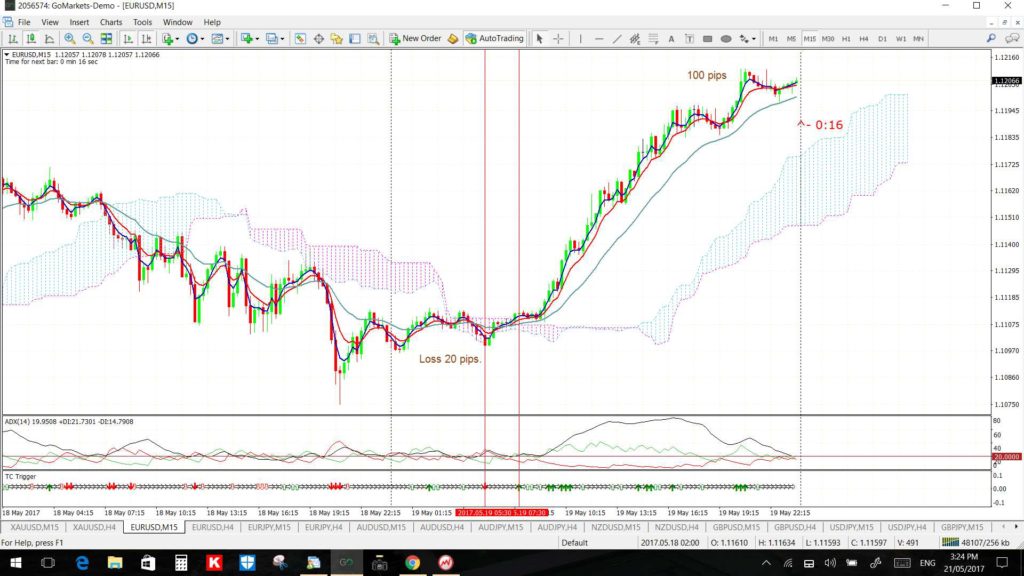
EUR/USD: The following chart shows the TC Trigger in action on the 15 minute chart of the EUR/USD from Friday 19th May. The first TC signal was a SHORT that failed and, if your STOP was just the other side of the Cloud then this would have meant a loss of about 20 pips. The next signal though was a successful LONG signal that went on for around 100 pips:
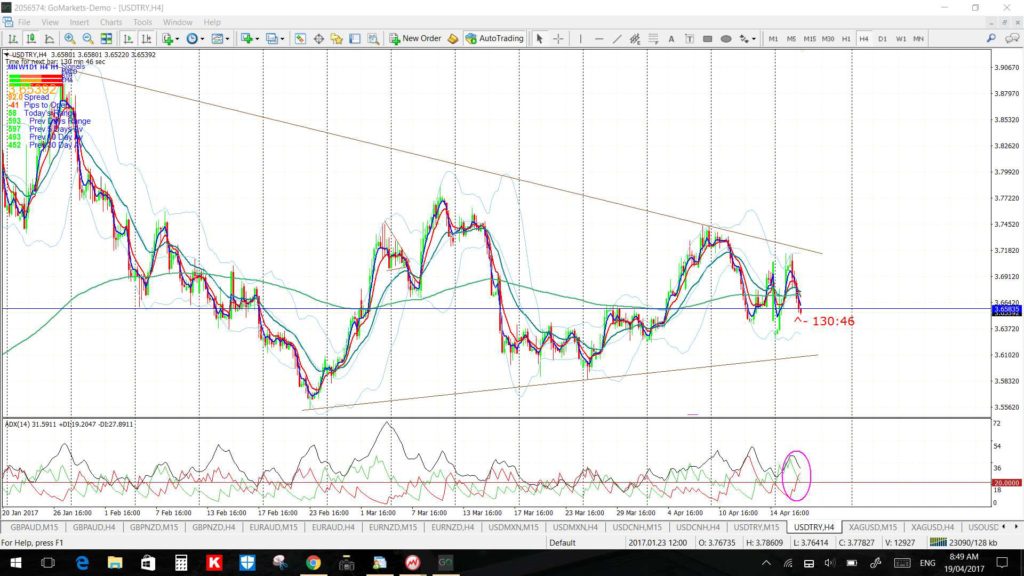
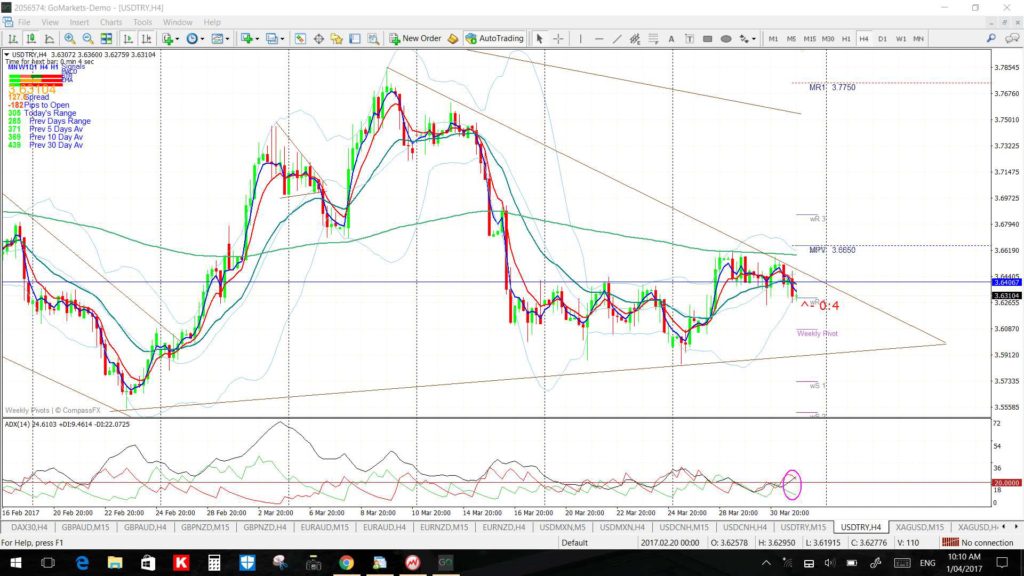
USD/TRY: The USD/TRY is a high yielding pair and so is worth stalking on the 15 min chart time frame for any breakout move. The pair had been consolidating within a triangle on the 4hr chart time frame during April 2017 as the following 4hr chart reveals:
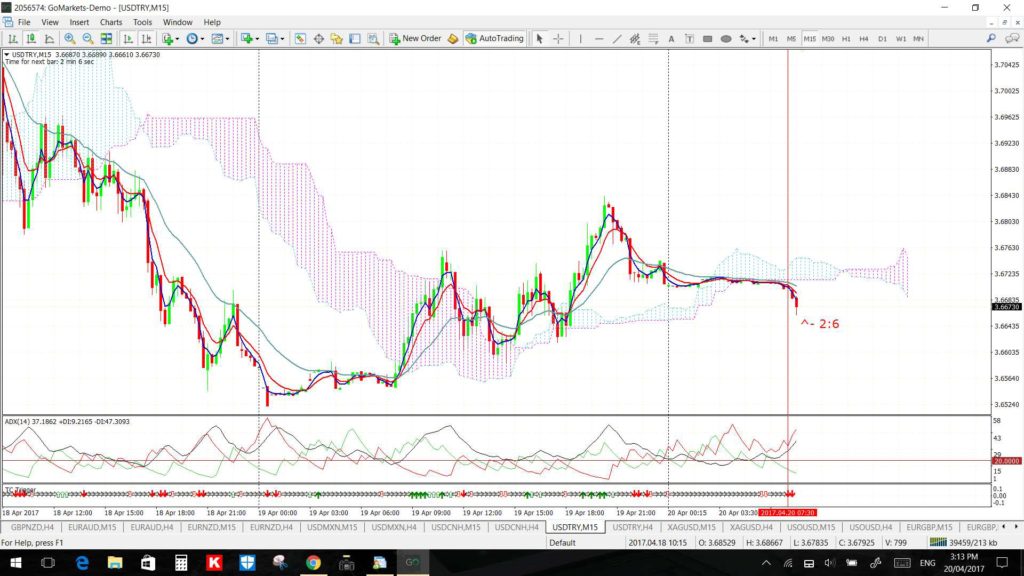
There can be decent trend trades off the 15 min chart though within this overall consolidation on the larger time frame. The following TC LONG signal was noted in the late Asian session on Thursday 20th April. The benefit of stalking trades on high yielding pairs using my TC algorithm off the shorter time frame chart is that the risk can be managed more easily. In this case a STOP would have been placed on the other side of the Ichimoku Cloud and that would be for about 50 pips:
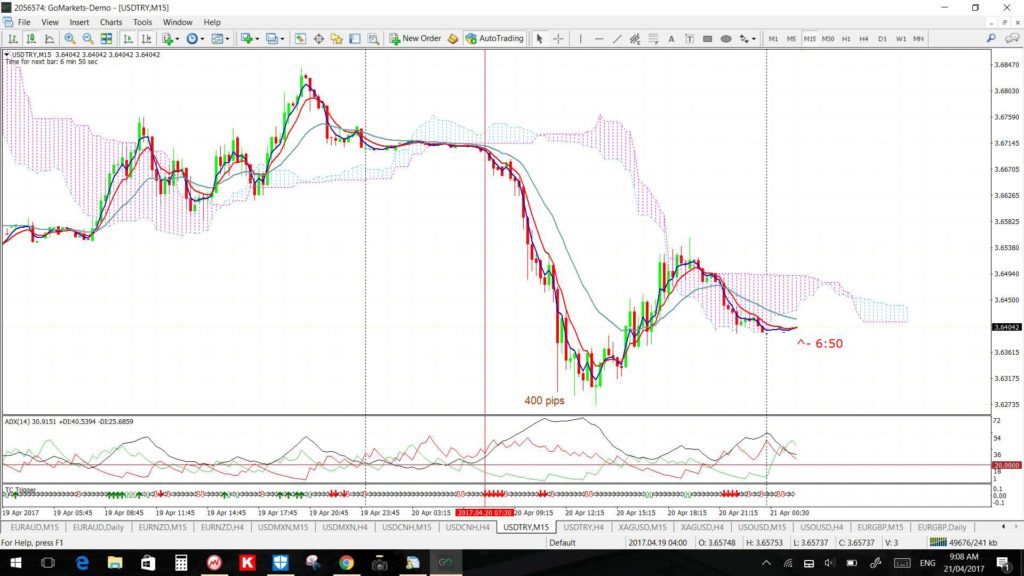
This signal went on to give 400 pips before reversing and so the risk to reward, 50 pips for 400 pips, was worthwhile here:
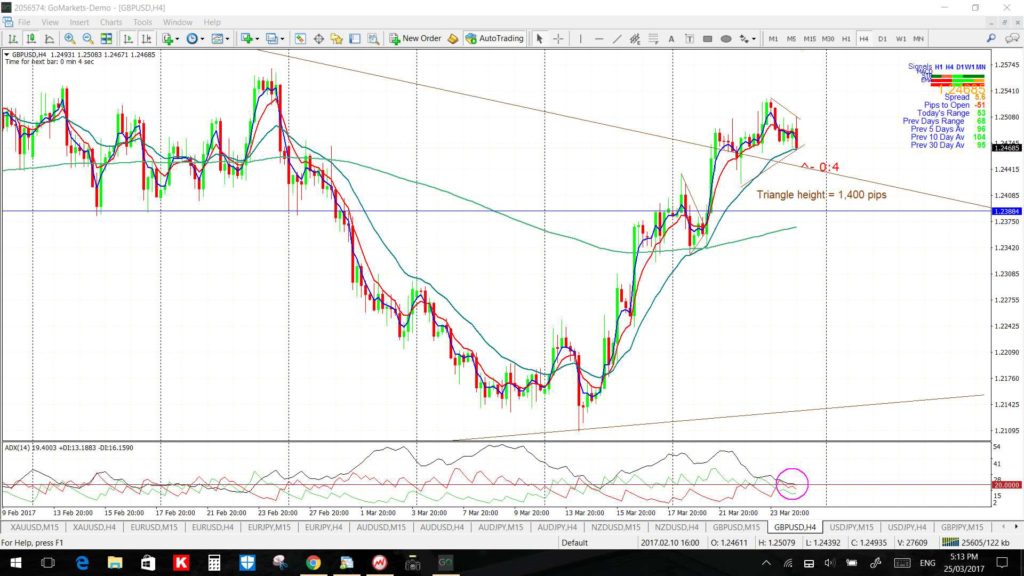
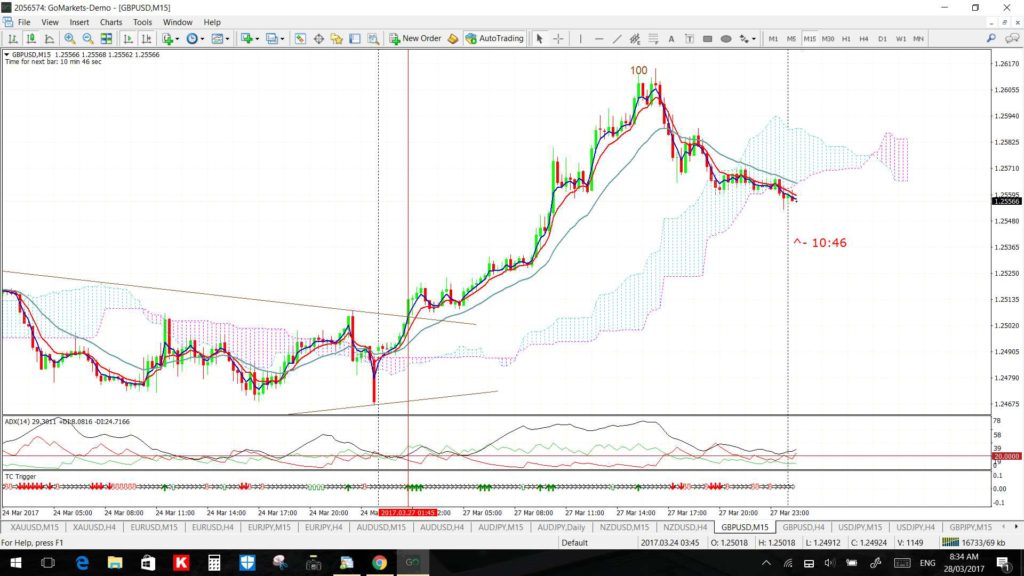
GBP/USD: The Cable had been bullish in the previous week and I noted in my w/e update that it looked to be attempting a potential 1,400 pip daily chart triangle breakout. I had also noted the recent consolidation on the 4hr chart and advised traders to watch for breakout from this 4hr chart triangle and the chart from this post is as per below:
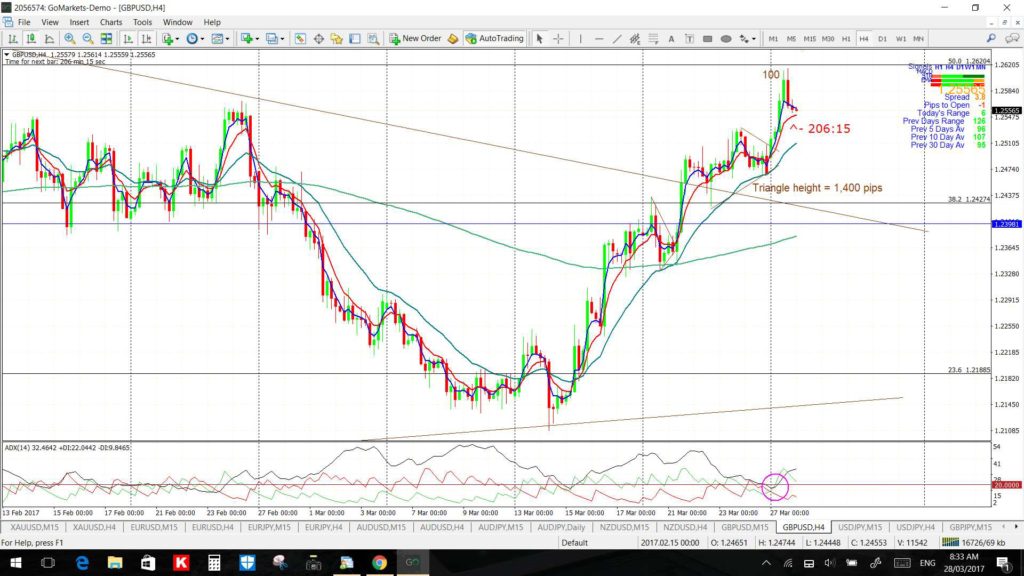
This is the 4hr chart on the following Tuesday morning showing a 100 pip breakout move:
The 15 min chart though shows how a new TC signal was triggered with the break of the triangle trend line and gave a decent haul of pips:
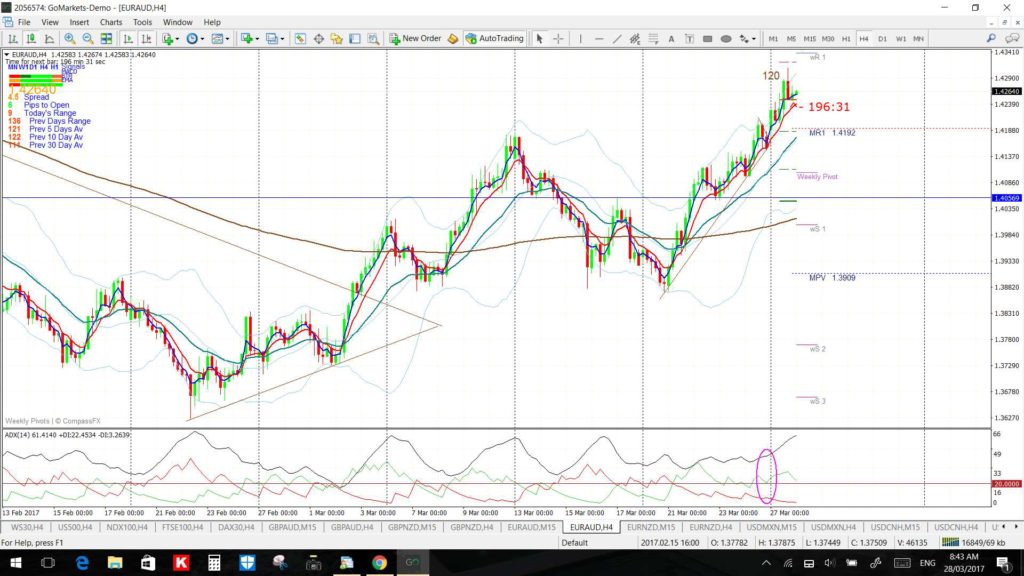
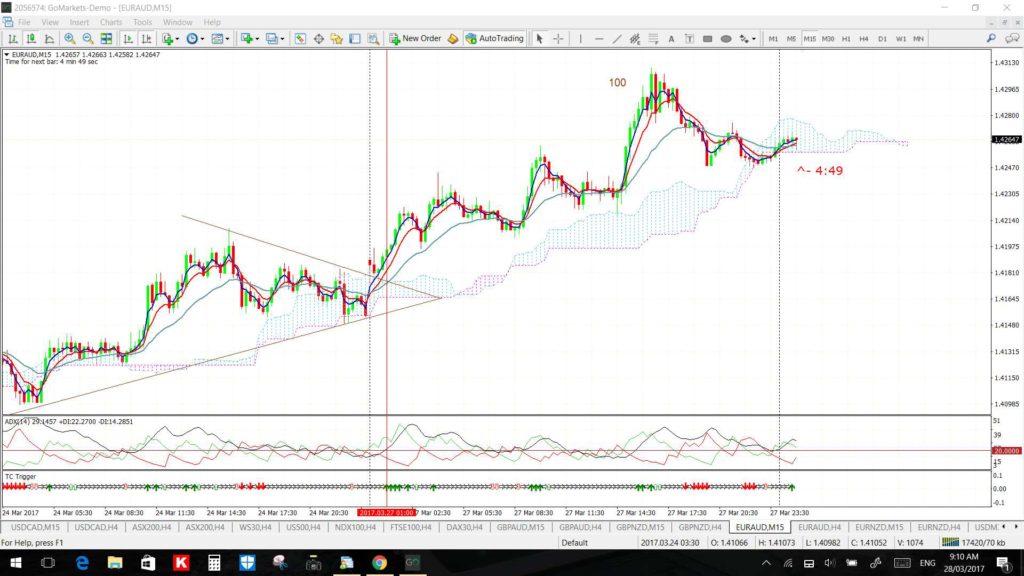
EUR/AUD: The EUR/AUD was also consolidating as shown in this post. The subsequent breakout gave 120 pips and the 15 min chart also shows that a new TC LONG signal triggered along with this 4hr trend line breakout:
E/A 4hr:
E/A 15 min: showing the successful new TC signal along with the trend line breakout:
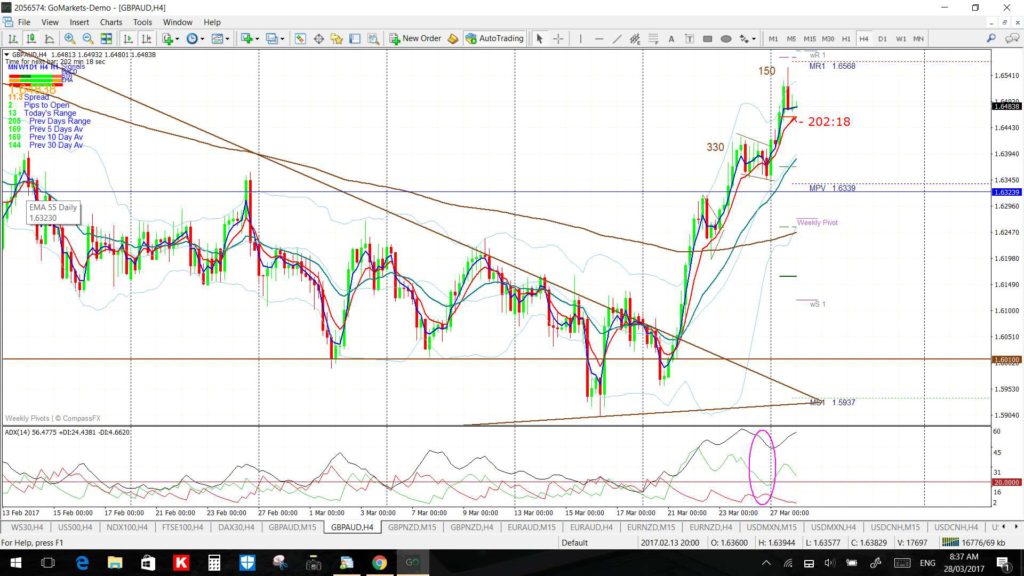
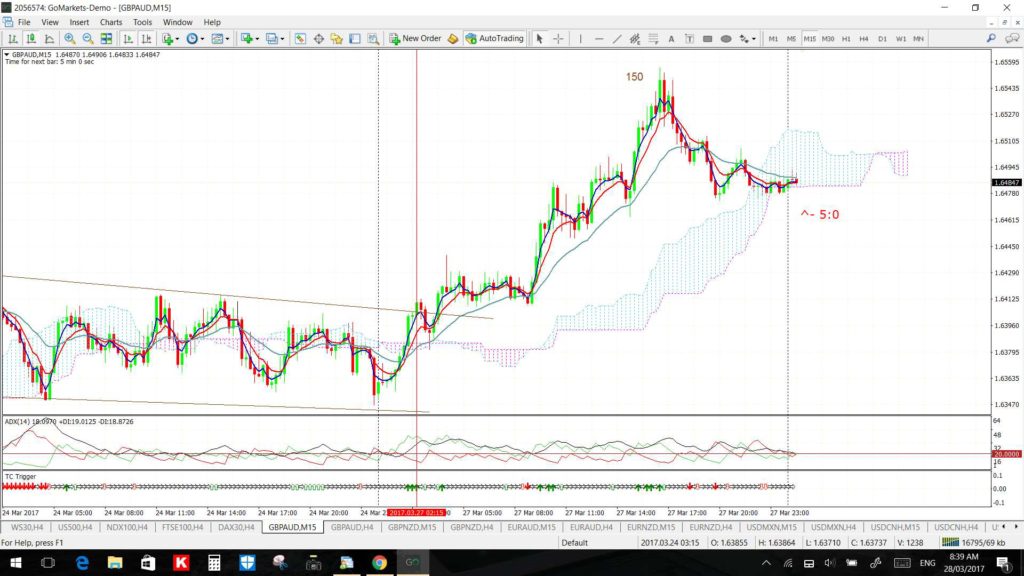
GBP/AUD: The GBP/AUD was also consolidating as shown in this post. The subsequent breakout gave 150 pips and the 15 min chart also shows that a new TC LONG signal triggered along with this 4hr trend line breakout:
G/A 4hr:
G/A 15 min: showing the successful new TC signal along with the trend line breakout:
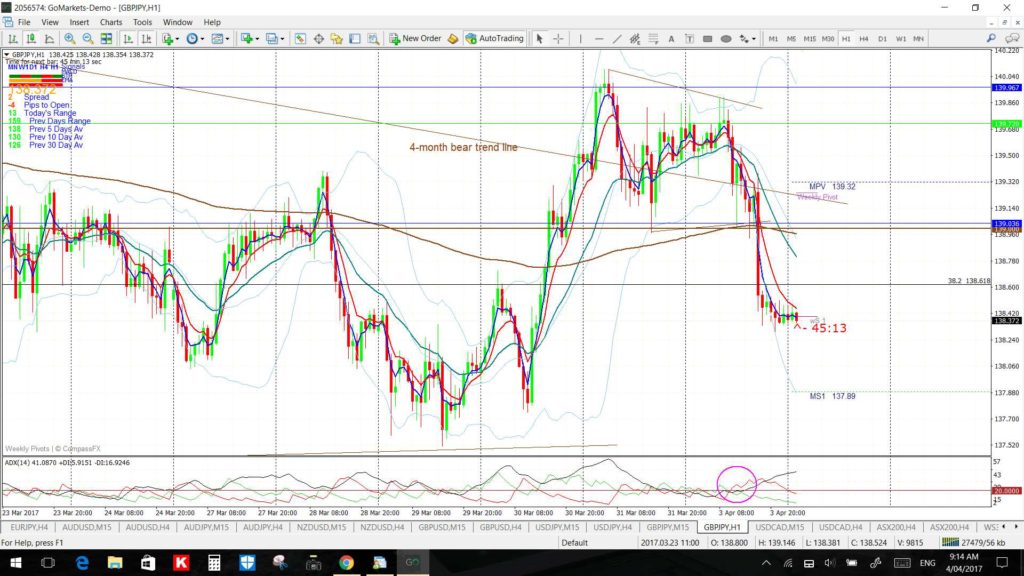
GBP/JPY: The GBP/JPY was trading in a sideways channel on Monday 3rd April and I noted as much in an evening Tweet. The 60 min chart from that evening Tweet was as below:
This was the 60 min chart on the following morning though showing that price has broken through the lower support trend line during my night time:
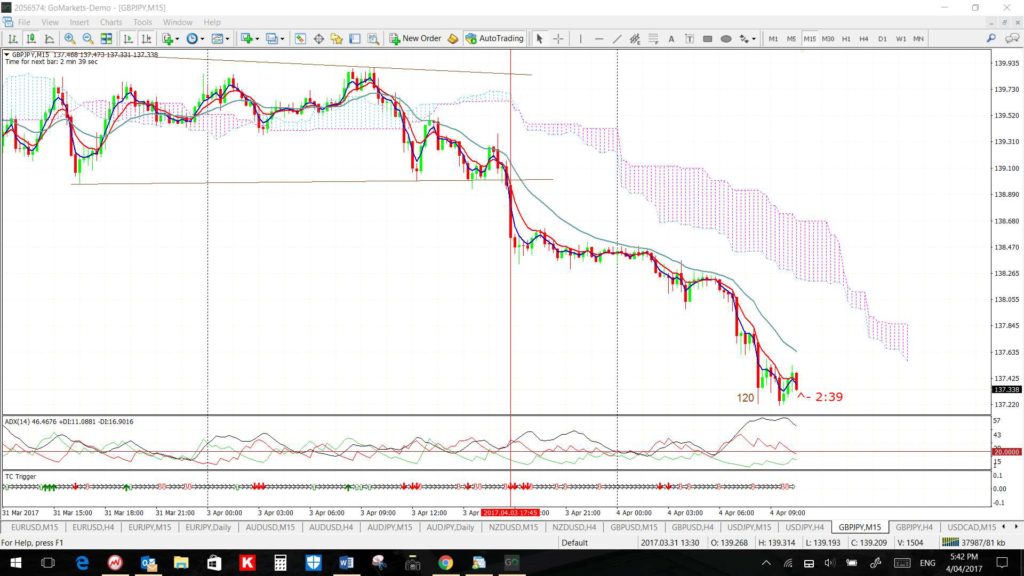
The 15 min chart shows how a new TC signal triggered with this trend line breakdown and continued throughout the Asian session to deliver a substantial pip haul:
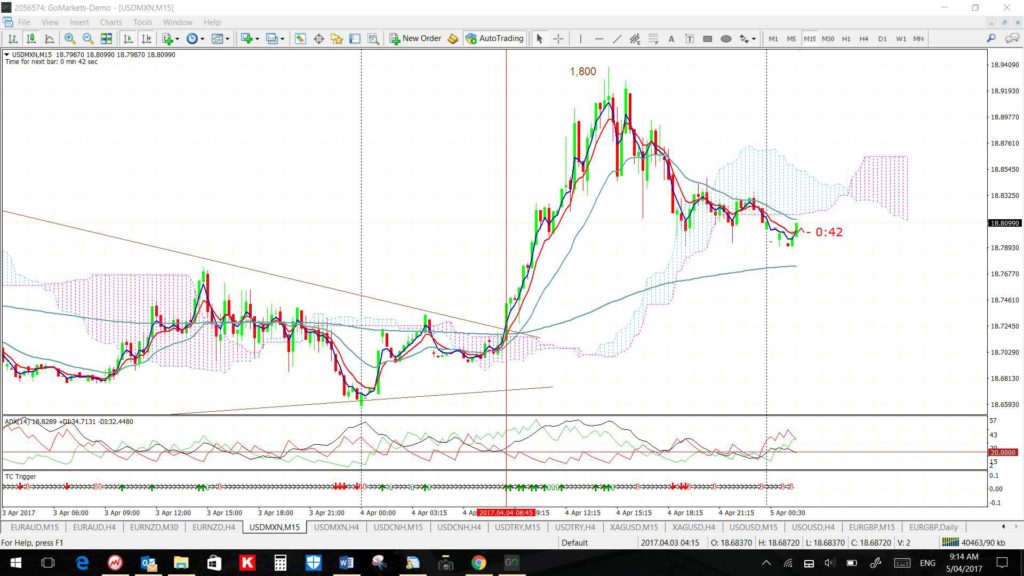
USD/MXN: this is an example of a trend line breakout trade dove-tailing in with a new TC signal on the 15 min chart time frame.
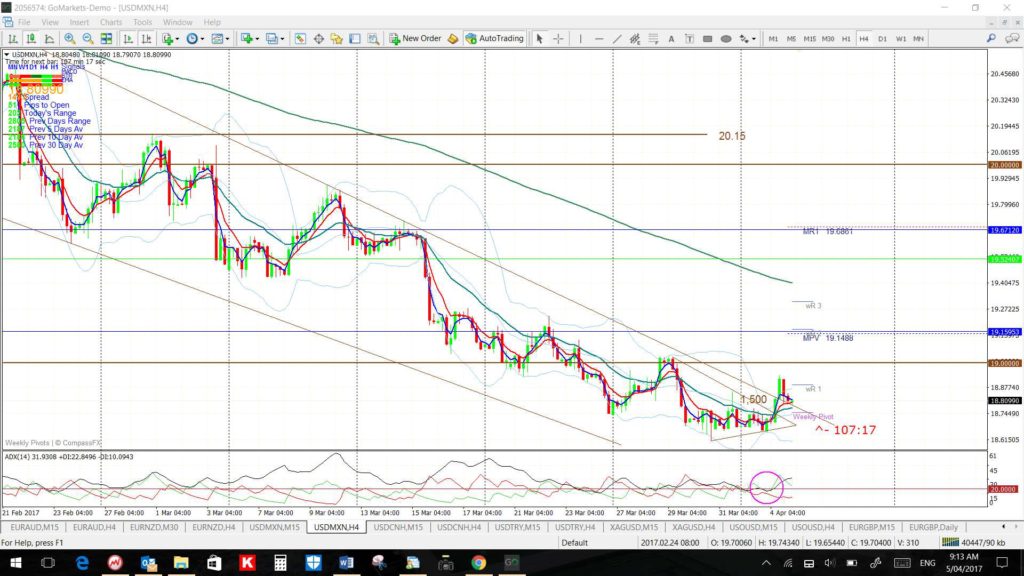
USD/MXN 4hr: this chart from my post on Tuesday April 4th showed price action consolidating within a triangle set within a descending trading channel and under the key 19 level:
USD/MXN 4hr: this was the chart on the following day showing a major breakout from both of these technical patterns:
USD/MXN 15 min: the 15 min chart reveals how the first TC signal after this triangle trend line breakout was a most useful guide to catch this significant momentum move:
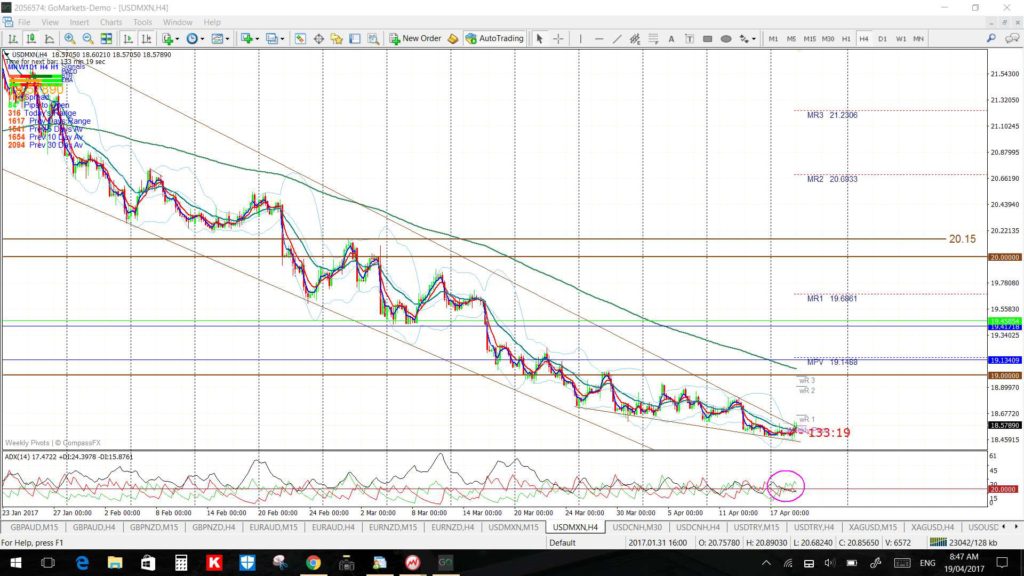
USD/MXN: The USD/MXN had made a break up through a long-term bear trend line and this chart was noted in a post on Wednesday April 19th 2017.
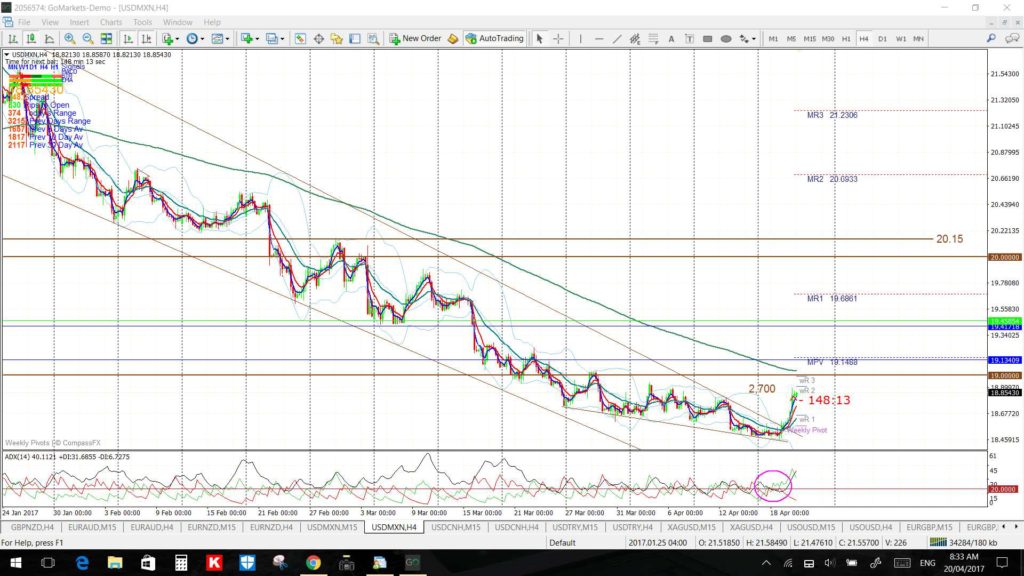
There was significant follow-through after this breakout as the chart from the following morning, Wednesday April 20th, reveals with a 2,700 pip shuffle along:
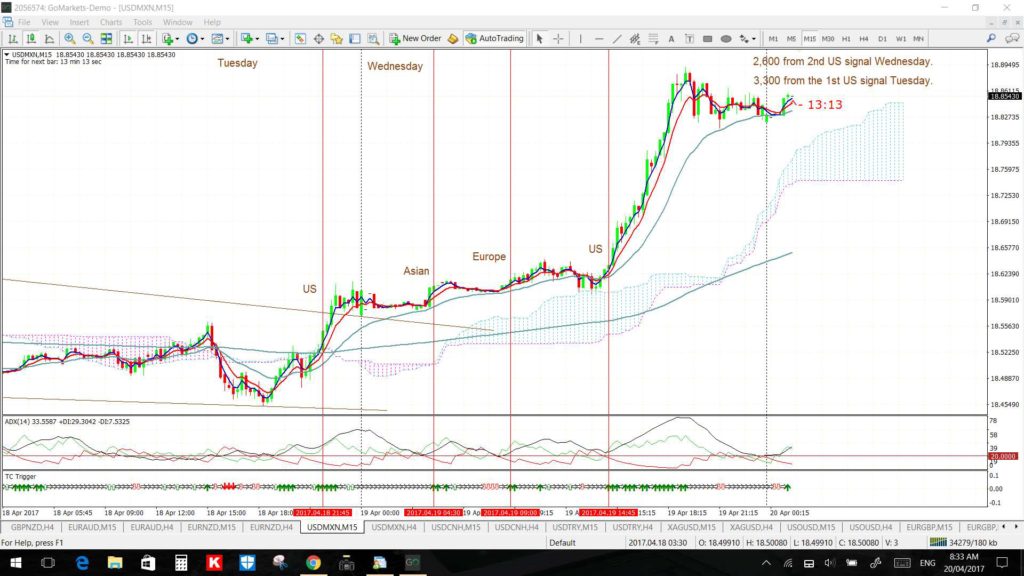
The 15 min chart shows that were a number of new TC LONG signals that evolved with this breakout on both the Tuesday and Wednesday. Holding any LONG from the first signal would have allowed a move of 3,300 pips whereas taking the most recent signal enable 2,600 pips:
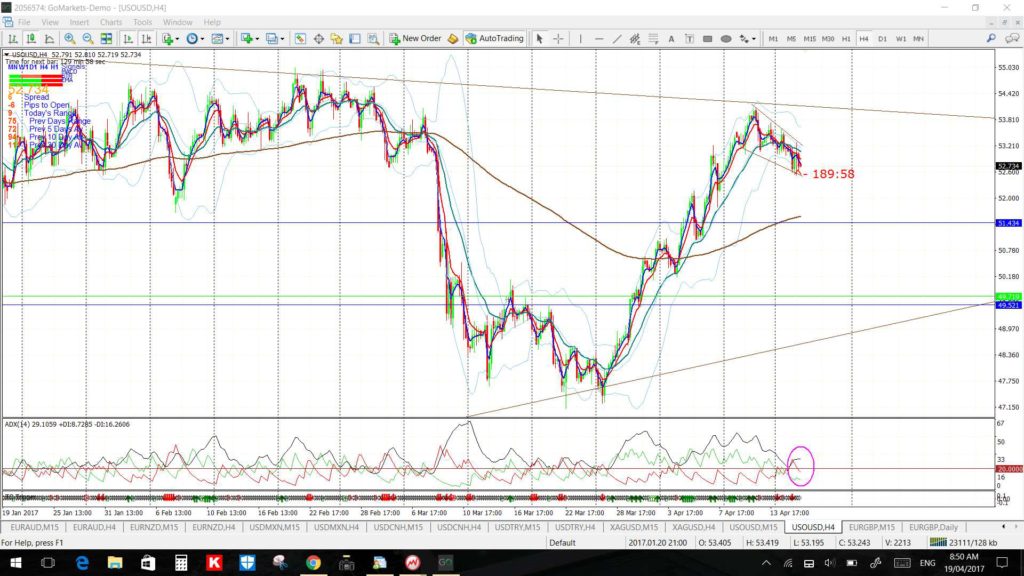
Crude Oil: I had been monitoring this Bull Flag on Crude Oil for a few sessions and noted the Flag on Wednesday April 19th 2017 as follows:
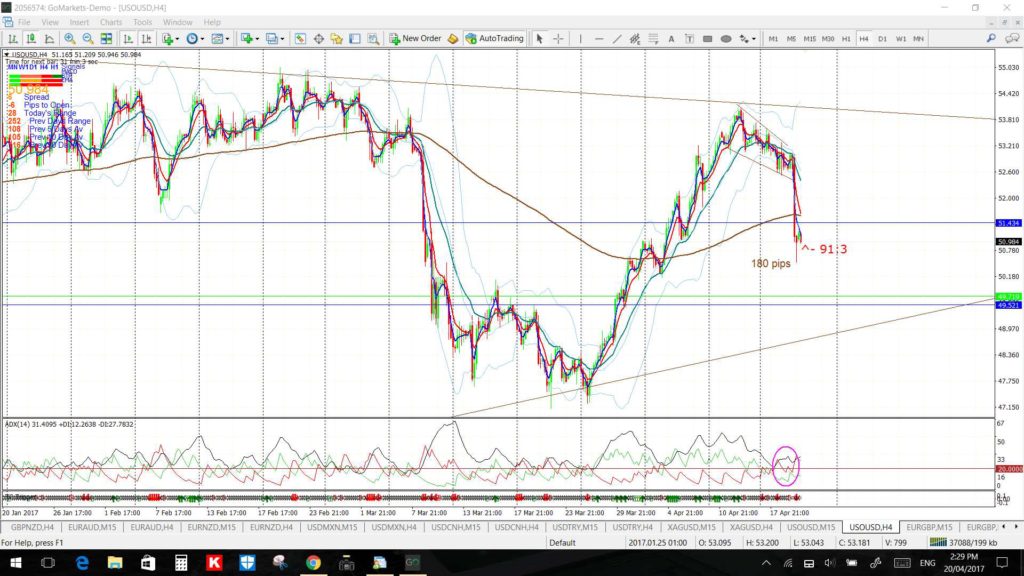
This was how the chart appeared to me the following day, the morning of April 20th. There had been a clear-cut trend line breakout for around 180 pips ($1.80):
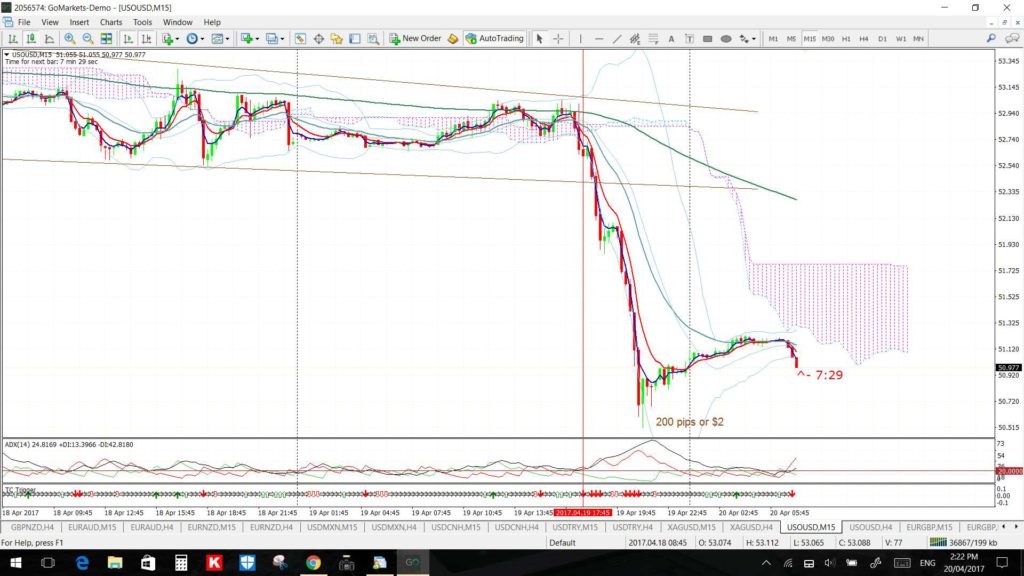
The 15 min chart shows that a new TC SHORT signal triggered near this trend line break and gave up to 200 pips ($2.00):
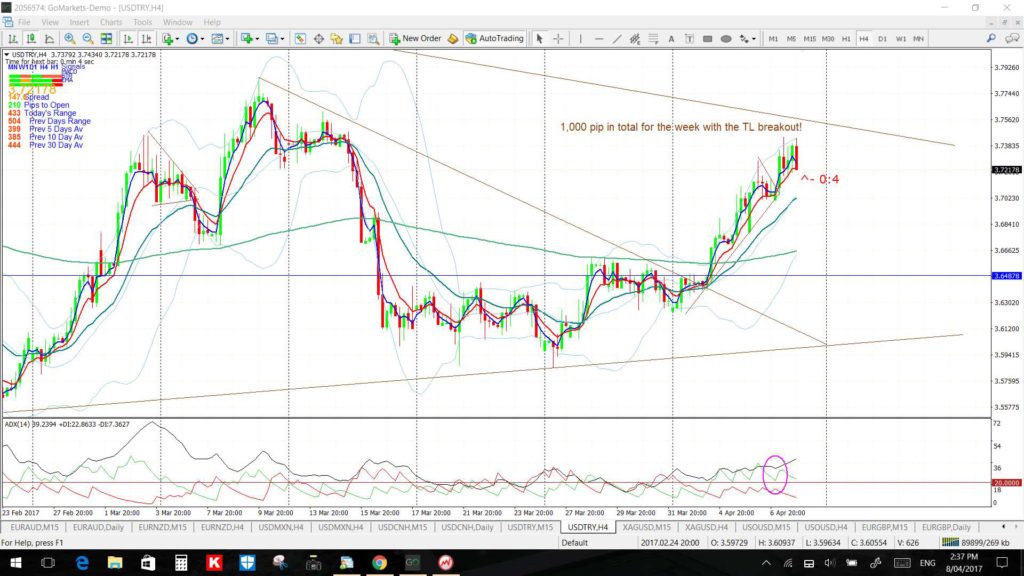
USD/TRY: I noted in a weekend analysis report in April 2017 that this pair was setting up within a triangle on the 4hr chart that was then set within a larger one on the daily chart giving traders trend lines to watch for any make or break activity. This was the chart from that post:
This was the chart by the end of the week following a 1,000 pip triangle breakout:
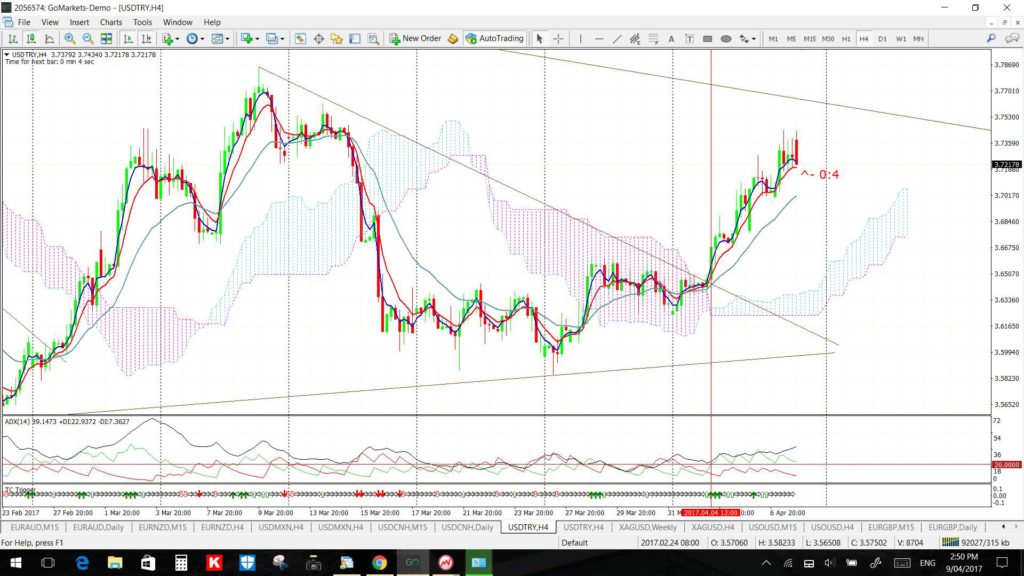
The 4hr Cloud and TC Trigger chart would have helped traders with this breakout trade:
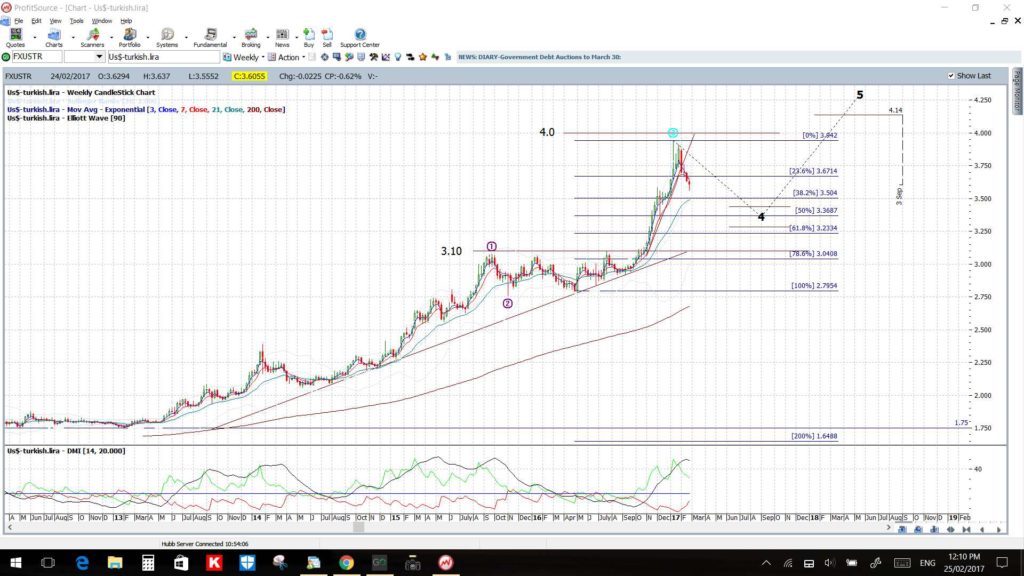
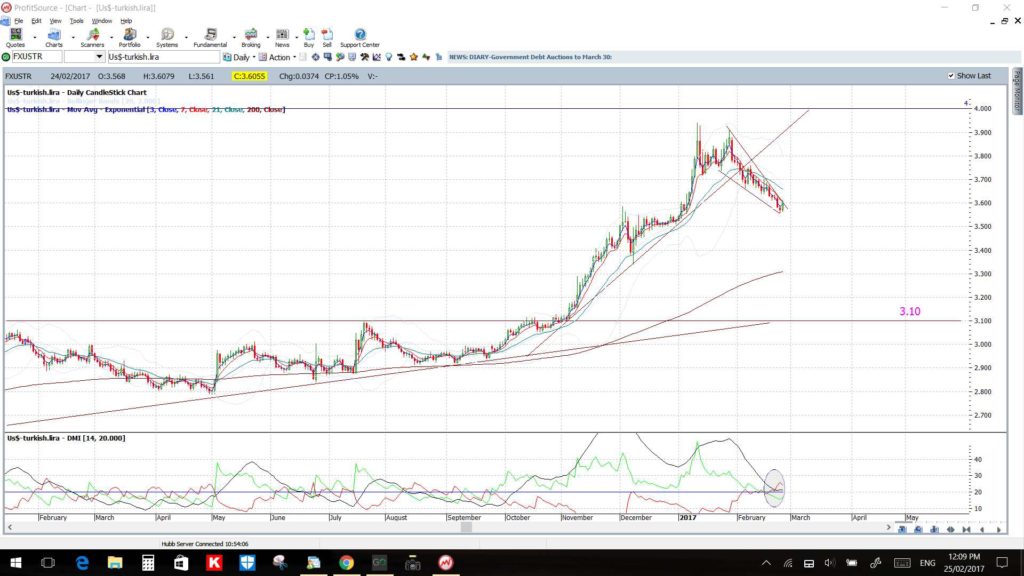
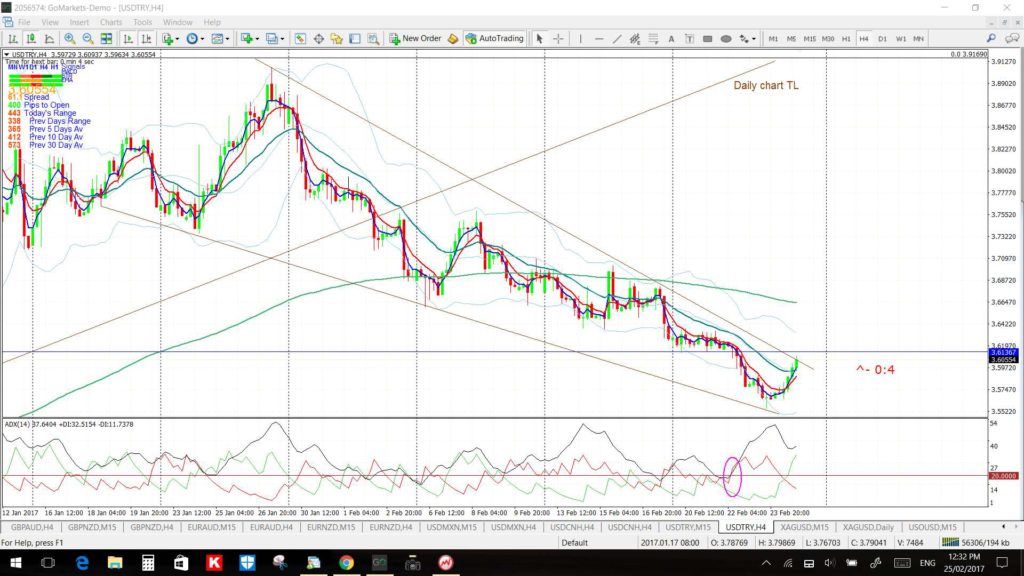
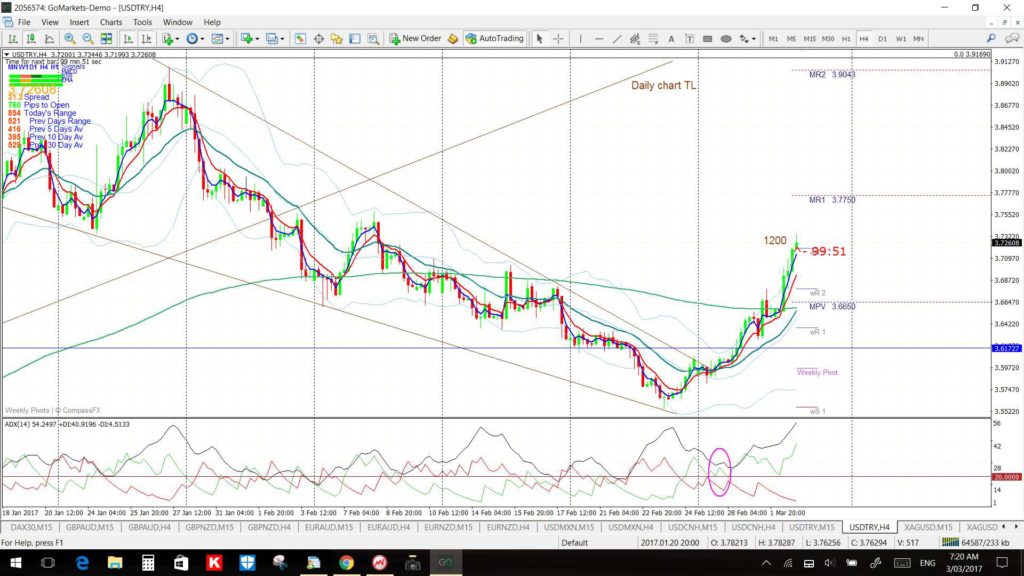
USD/TRY: the case study below applies to trade signals on the USD/TRY from February 2017.The charts below are from my weekend post of Sunday February 26th. In this post I noted the USD/TRY and how it was shaping up within a descending wedge. These are the charts from that post:
USD/TRY weekly: the weekly chart showed how a support trend line had been broken:
USD/TRY daily: the daily chart showed the Flag formation:
USD/TRY 4hr: the 4hr chart revealed this was a descending wedge and these are generally bullish-reversal patterns. Thus, I was on the lookout for a potential bullish trend line breakout here:
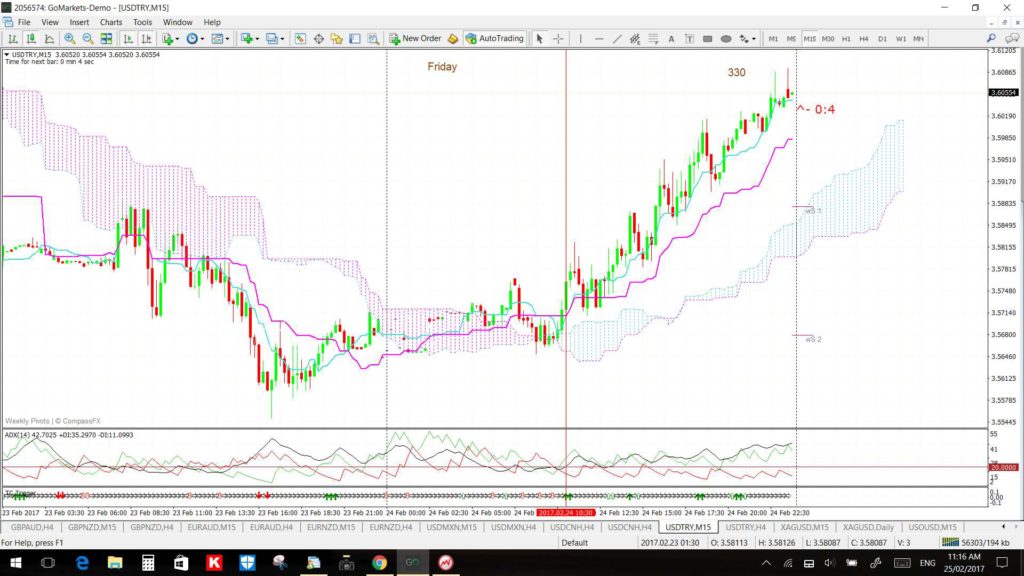
USD/TRY 15 min: the 15 min chart showed how the move back up to the top of the wedge could have been caught on the Friday with the help of my TC algorithm using the 15 min chart during the late Europe/US session. Price action was above the 3, 7 and 21 EMAs, above the Ichimoku Cloud and also aligned with a solid green UP arrow from my TC Trigger which all combined to indicate a new LONG signal. This Friday move alone was a very profitable one!
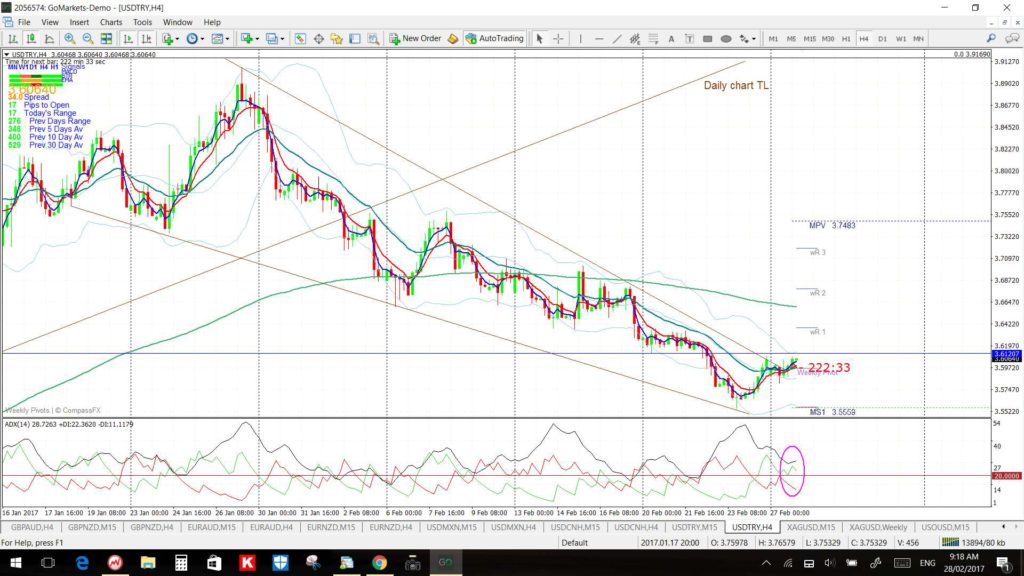
This was the USD/TRY 4hr chart on the following Tuesday 28th February where a breakout move looked to have started however this was just prior to President Trump’s address to the joint session of Congress and so many traders would have been quite cautious:
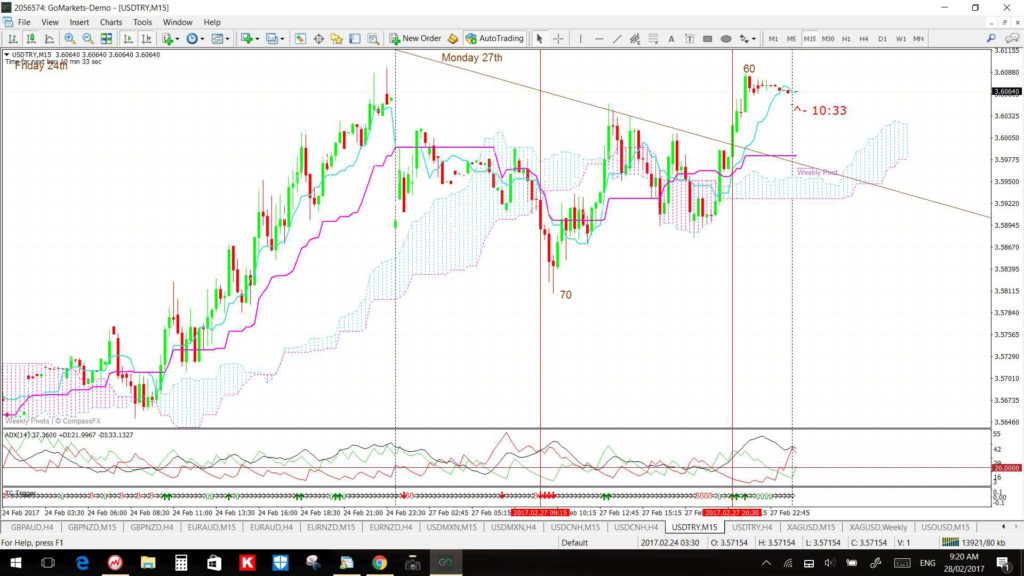
The 15 min chart shows that this bullish break of the wedge trend line aligned with a new TC signal though as price was above the 3,7 and 21 EMAs, above the Ichimoku Cloud and had triggered a solid green UP arrow indicating support of a TC LONG signal:
This was the 4hr chart from later in the week showing how the bullish USD/TRY move continued on give around 1,200 pips:
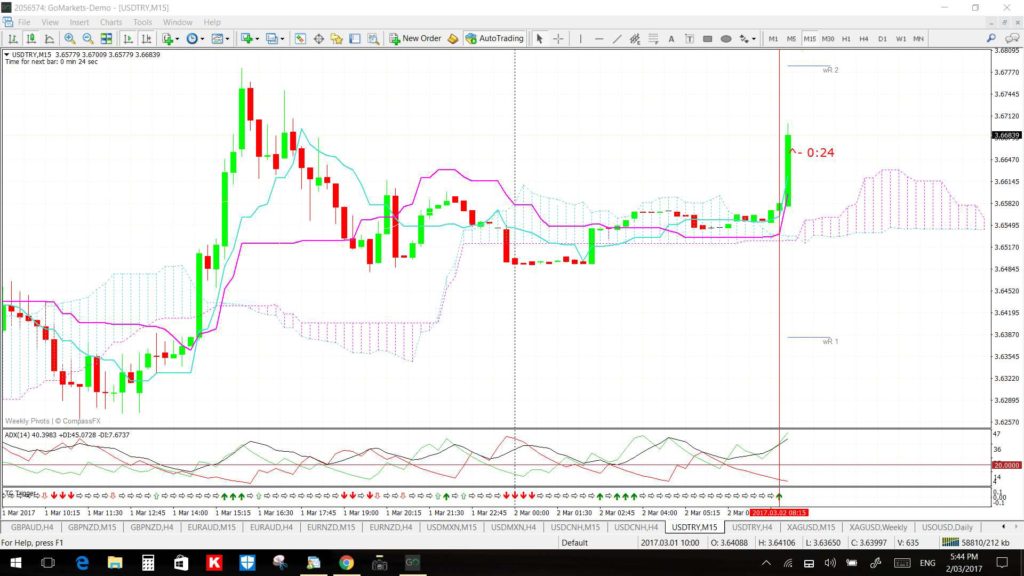
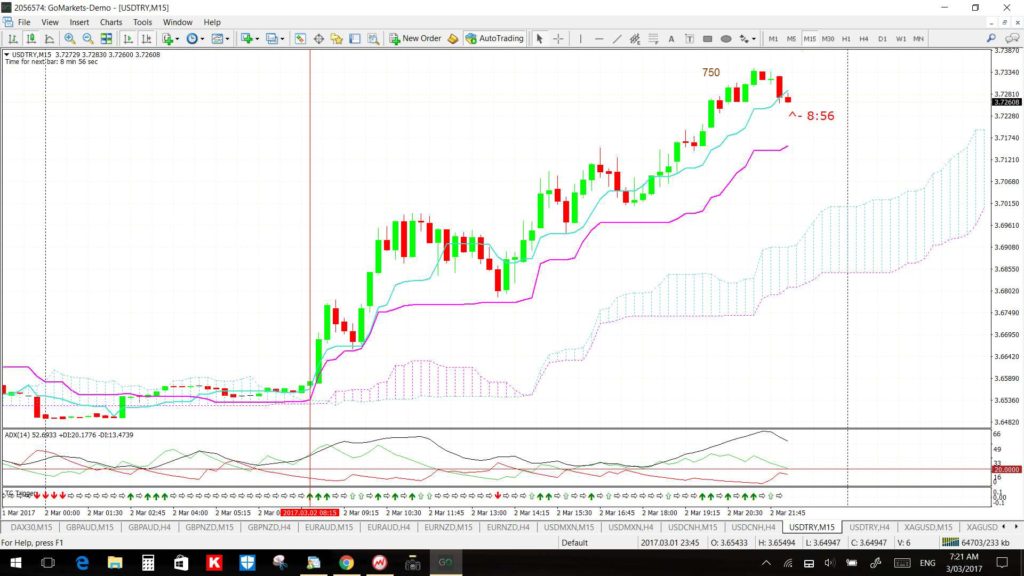
Price action during that 1,200 pip move did not travel in a straight line though and this gave fresh opportunities to enter LONG at other intervals along the way. The chart below is one example of this from mid week and I snapped this to share with a trading buddy but also thought it might be too late to chase the trade as it had already moved on about 100 pips since the TC LONG signal originally triggered. Note where the vertical red line denotes the new TC LONG signal and how there had been a recent cross above the Ichimoku Cloud, price was above the 3, 7 and 21 EMAs and a new solid green UP arrow was triggered:
Sadly for me, despite this large early move, this particular USD/TRY breakout did continue on much higher during my night and delivered around 750 pips
Other examples: Please check the following links for more post articles about the benefit of using my TC Trigger:
Summary: My new TC Trigger indicator is not to be used in isolation. It is best used in conjunction with EMA crossovers and alignment with the Ichimoku Cloud. My TC algorithm isn’t perfect but when used during the European and US sessions and in conjunction with trend line breakouts it delivers a high success rate of signals.
Please address any questions to mary@tradecharting.com


