A key learning for me since my trading trip to Europe in October 2016 has been of the value of watching trend lines during periods of consolidation and, if any breakout evolves, to then look for trade entry signals using my TC algorithm off the shorter time frame charts. This post gives examples of the benefits of this regime that presented in early 2017 but I will add more examples as they present.
The first part of this article focuses on:
- The benefits of waiting for TC signals that trigger with new trend line breakouts.
- The value of waiting for a trend line breakout to evolve with a new TC signal.
- The importance on noting key trend lines and S/R levels.
The second part of the article gives lessons about particular breakout trades + TC examples.
- The benefit of TC Signals that trigger with new trend line breakouts: An example:
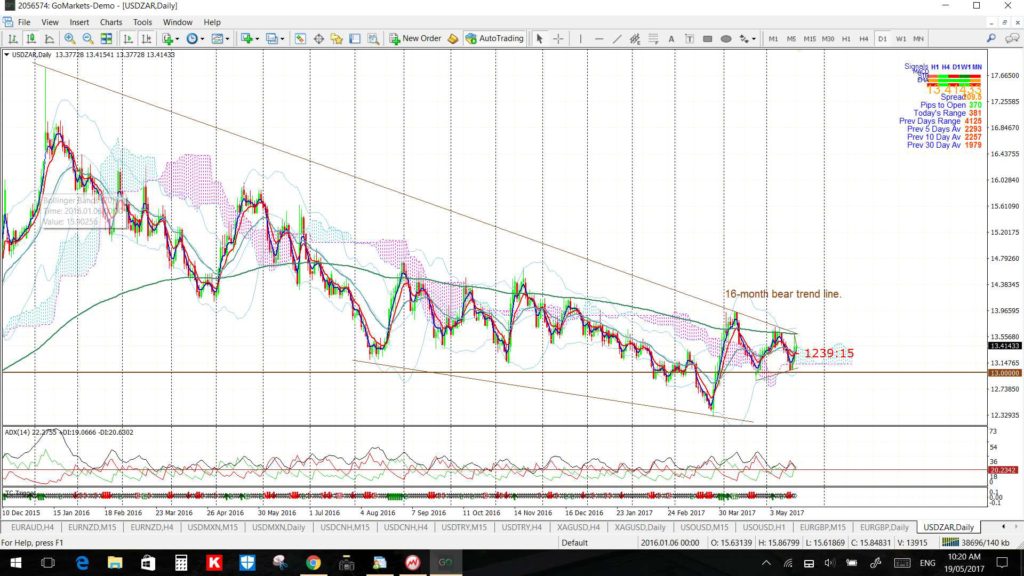
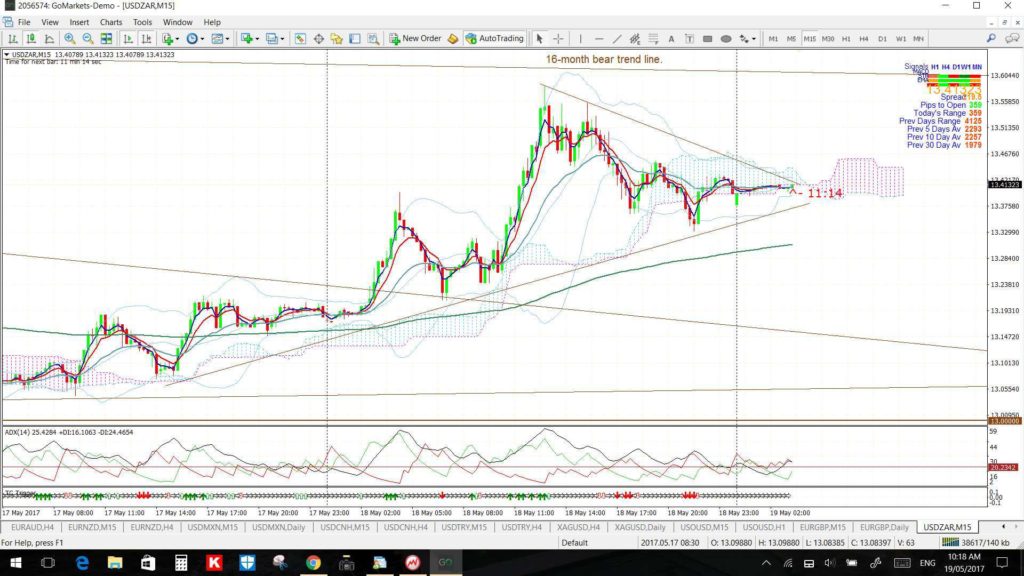
USD/ZAR: On Friday 19th May I Tweeted to watch the revised trend lines on the USD/ZAR for any breakout move. Here were the daily, 4hr and 15 minute charts from that Tweet:
USD/ZAR daily:
USD/ZAR 4hr:
USD/ZAR 15 minute:
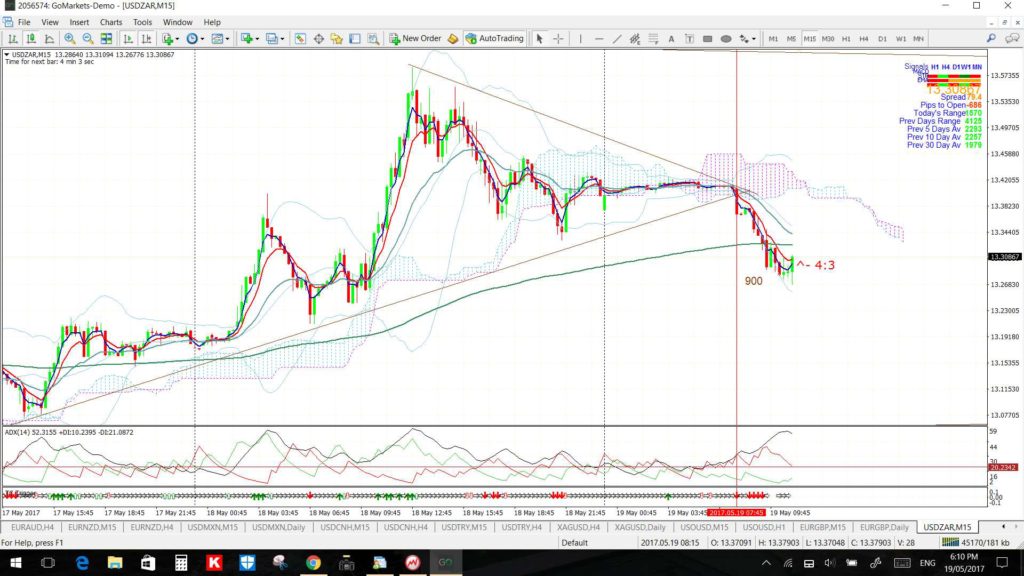
The breakout actually triggered later that day and gave up to 900 pips by the European session:
USD/ZAR 15 minute: from later on Friday 19th May: A new TC signal triggered along with the trend line breakout:
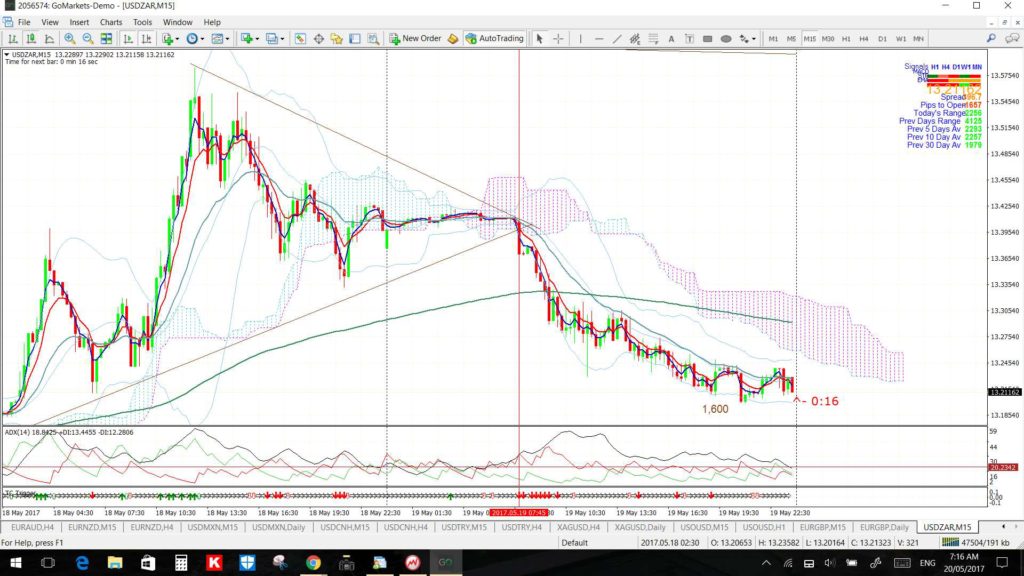
I woke the next morning to see the trade had extended its win to 1,600 pips.
- The value of waiting for a trend line breakout to evolve with a new TC signal: Example:
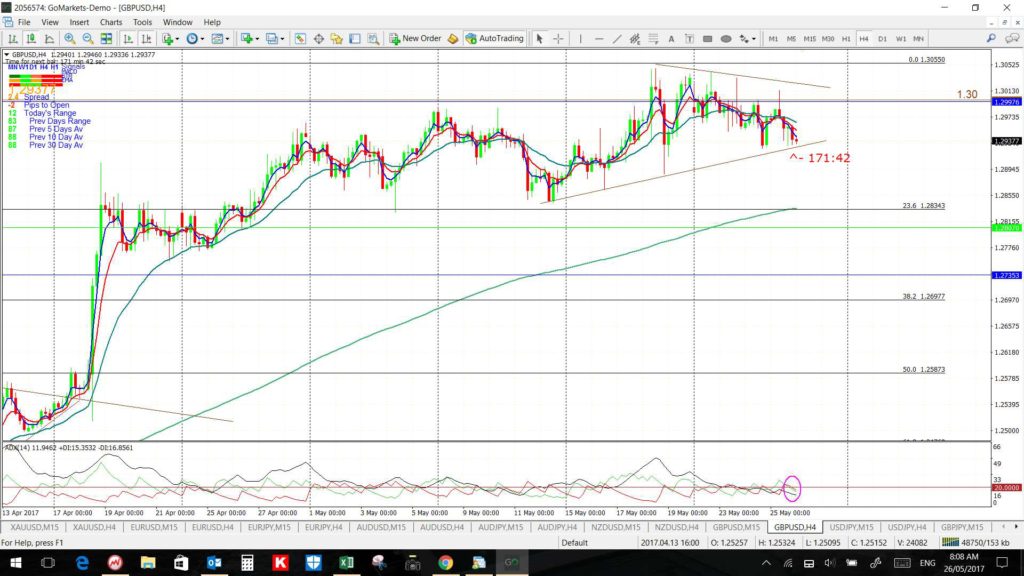
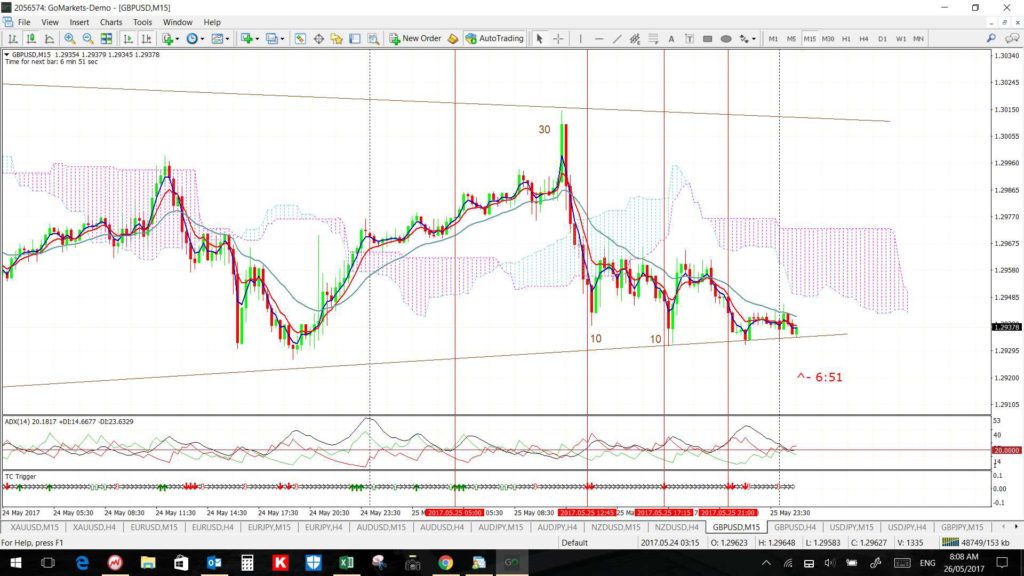
This particular example is to remind traders about the benefit of waiting for a new TC signal to trigger once there has been a breakout from a consolidation pattern. Thursday 25th May was a Bank holiday in parts of Europe and there was a holiday looming on the following Monday in the US and UK. Thus, it wasn’t surprising to find most currency pairs range bound within consolidation patterns when I wok on the Friday morning. The example below illustrates that, whilst there were a few 15 minute TC chart signals on the GBP/USD on Thursday, none of these evolved with a trend line breakout. These moves might have been useful for scalpers who live to grab just 5 to 10 pips but, that is all.
GBP/USD 4hr: showing how the Cable has been range bound near or under the key 1.30 level for much of the last four weeks.
GBP/USD 15 minute: there were a few TC signals that triggered on the 15 minute chart but these did not evolve with a trend line breakout. They did offer some scalping profit opportunity but there was little follow-through. The further away from the trend line then the better the TC signal result so that is at least something to take away from this exercise.
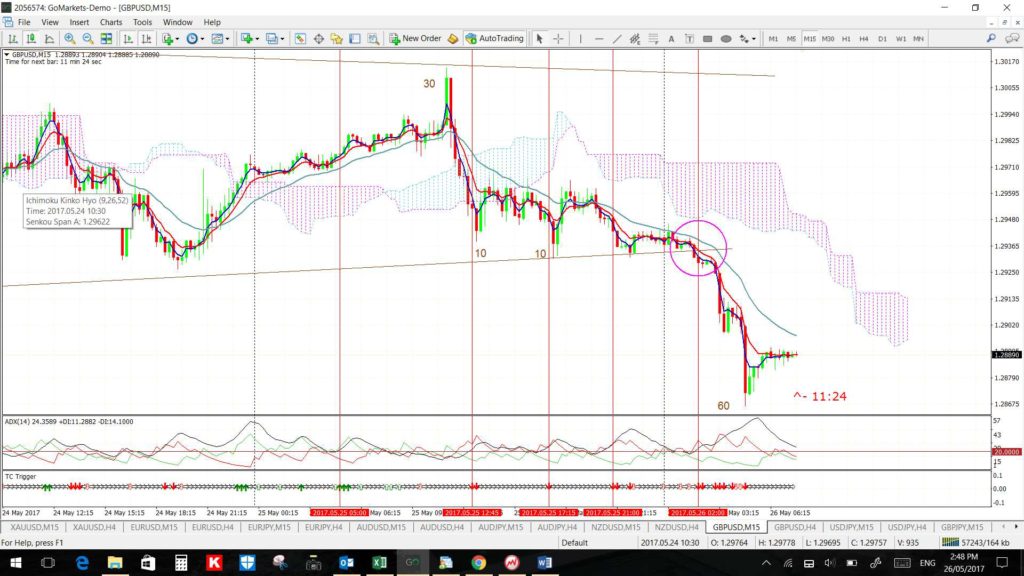
Note how the next day there was a trend line breakout that evolved with a flurry of TC Trigger arrows. Even though this did not produce a clean TC signal in a timely manner it does illustrate how the TC Trigger is more reliable when the arrows form up along with a trend line breakout:
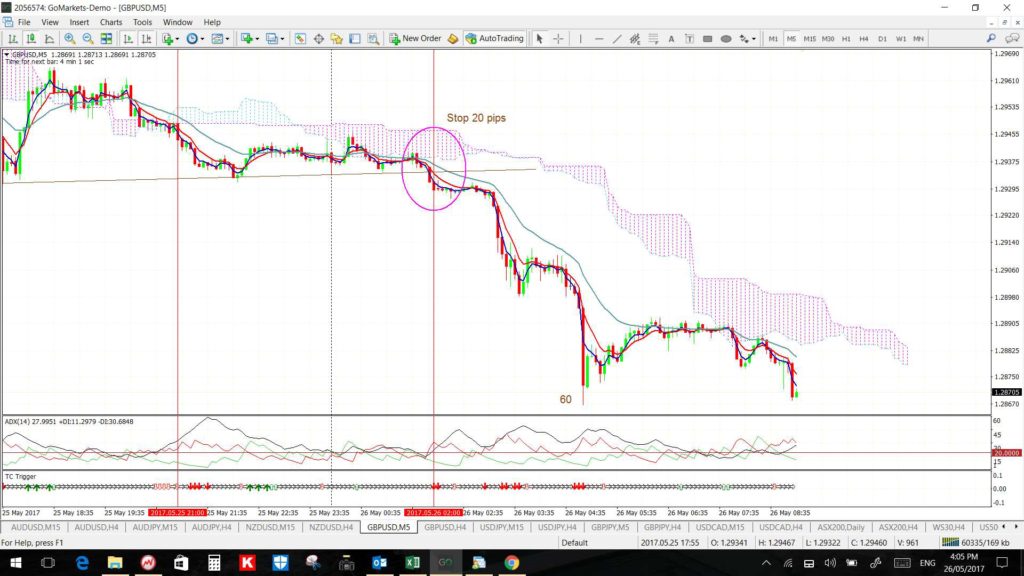
In this situation when there is a trend line break BUT no clean-cut 15 min signal traders may look down to the lower time frame 5 minute chart. In this particular instance, there was a signal to SHOT on the 5 min chart and this also offered an opportunity for a smaller STOP size:
- The importance on noting key trend lines and S/R levels: Example:
One of the TC Trial participants e-mailed to update me about his first trade which, sadly, was a losing trade. He asked me to review the chart to see if there was anything that stood out as ‘wrong’ with the TC signal. The TC signal was valid but the set up did not offer the highest probability outcome and so I thought I’d share the results of this review with you all. The TC Trial participant was happy for me to share this charting example and suggested it as a potential learning opportunity for others.
GBP/CAD 15 min: This is a section of the chart the TC Trial participant sent me showing the set up of his trade. The TC signal taken was a valid one but this, alone, would not have been enough for me to want to take such a trade. There were two main issues that stood out for me and I explain these below.
Firstly, this trade was taken on OPEC Meeting day, Thursday 25th May, and I would not have traded any CAD pair across such an event. I find the CAD pairs skittish at the best of times and news from this event had the potential to trigger CAD movement and, thus, I would have left these pairs alone. The lesson here: check your trading calendar.
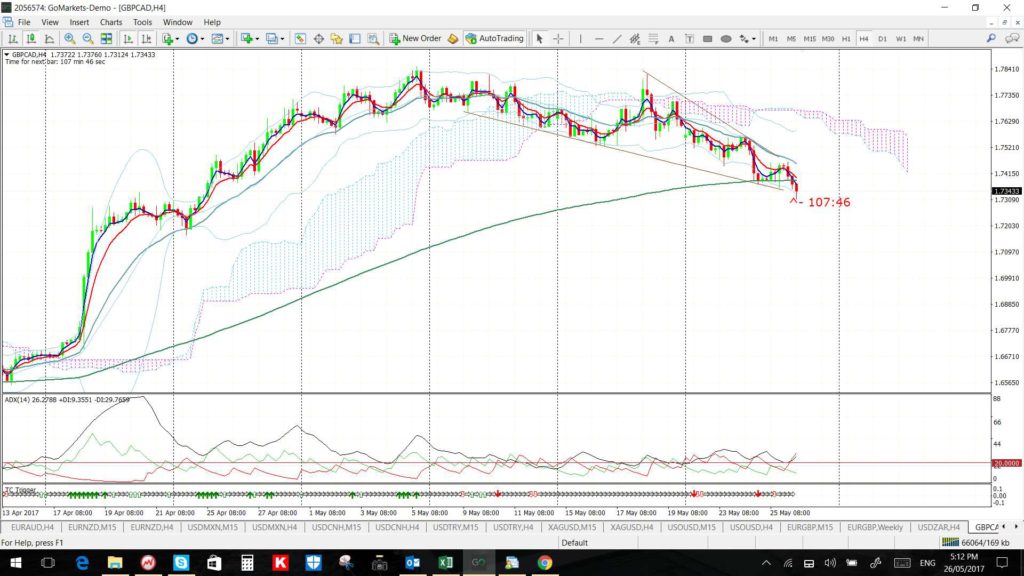
Secondly, not being familiar enough of late with this pair I did not know anything about potential Support or Resistance levels and this, to me, is CRITICAL knowledge one must posses before trading ANY instrument. I pulled up a chart on my MT4 and straight away I could see a potential descending wedge on the 4hr chart. The last few candles would not have been present when this trader would have been viewing this chart but the pattern would still have been clear. There was obvious trend line support below recent price action that had been in play for almost 3 weeks:
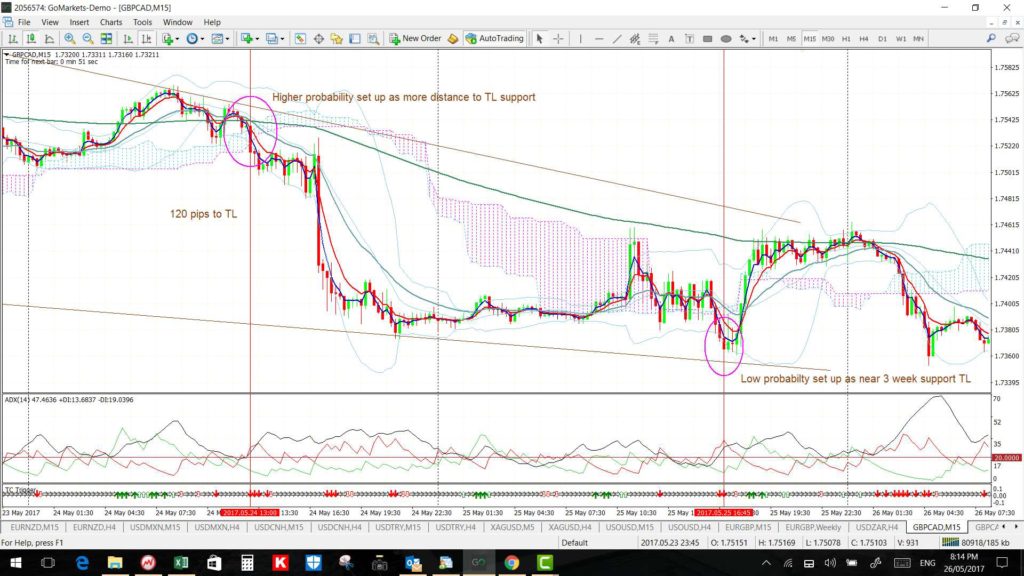
Zooming down to the 15′ chart revealed the following. The vertical line on the far right is the candle in question for this trader. Note how close the TC signal candle was to support. In a situation like this when the TC signal candle is so close to an S/R level the risk to reward potential isn’t there. In such a situation it would be best to wait to see if any candle managed to close BEYOND the S/R level before taking the trade.
Now look to the left of the chart and you can see a second vertical line through a valid TC SHORT signal from the day prior. This signal still evolved within the technical pattern but the reward to risk potential was much greater here. Note how there was about 120 pips worth of room down to the bottom trend line and, if a STOP was placed on the other side of the Cloud, this would have been of about 40 pips in value. Thus, a trade with a 40 pip STOP and a potential 120 pip range offered a 3R trade, that is, the potential to make 3 times your risk. This TC signal would have been a reasonable one to take but the second signal not so.
The lesson here: make sure you evaluate any instrument that you trade for relevant SUPPORT and RESISTANCE levels. I cannot emphasise this enough; it is a critical part of any trend trading regime but, especially, this one! I generally start on the monthly chart and work my way down to the 4 hr chart. In this example today, however, the 4hr chart was clear enough guidance for trading off the 15 minute time frame.
Summary: There are two main lessons from this losing TC signal trading example:
- Calendar: Check your trading Calendar before trading and avoid trading currency pairs across pertinent major news events.
- S/R: Make sure you are are aware of the key SUPPORT and RESISTANCE levels for trading instruments before taking any TC signal. Taking a TC signal that triggers INSIDE a technical pattern often doesn’t offer the highest probability trade set up. However, TC signals are worth considering if they offer a decent potential for reward relative to the amount of risk needed to be taken. However, the fact remains that the best trading outcomes, from my experience, come from when the new TC signal triggers along with the break of trend line.
Other Examples:
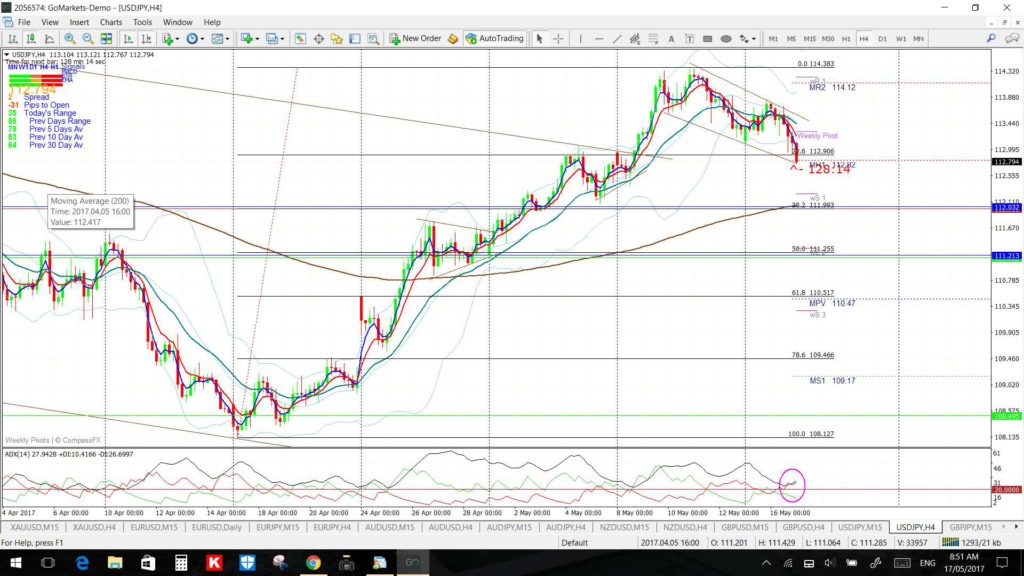
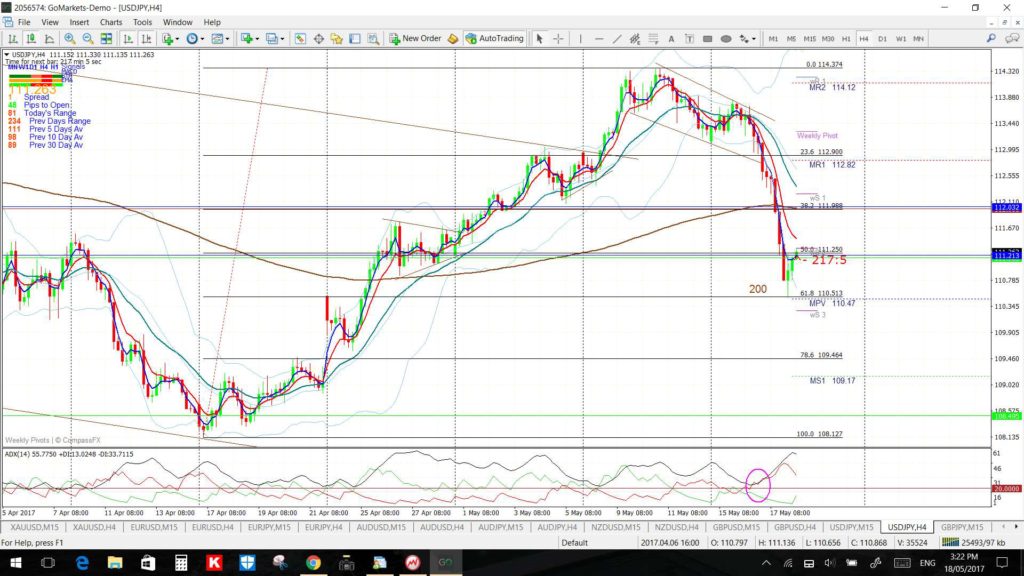
Lesson: USD/JPY: On Wednesday May 17th I posted to watch the USD/JPY and GBP/JPY pairs for any Flag breakout move. This was the 4hr chart from that post:
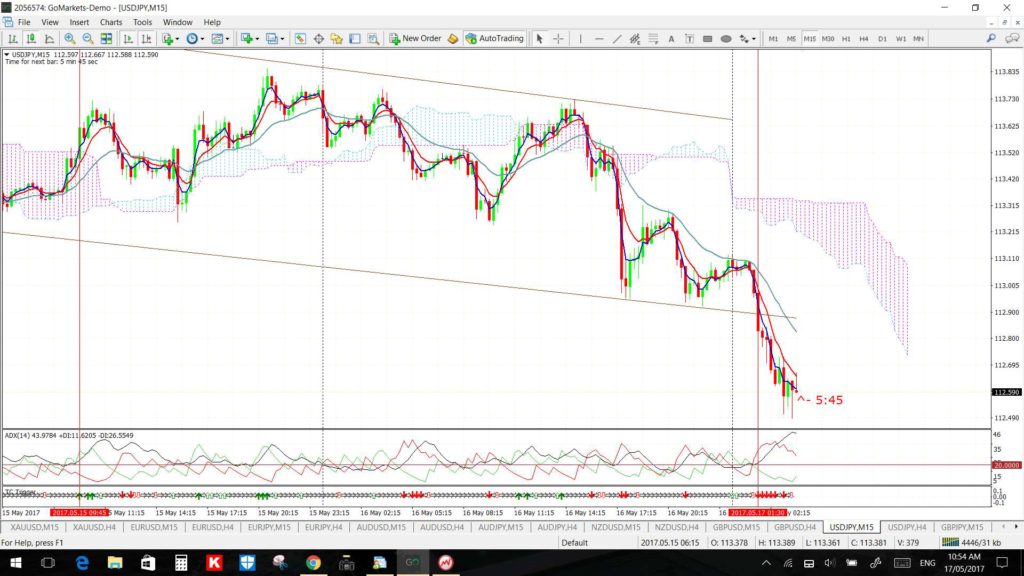
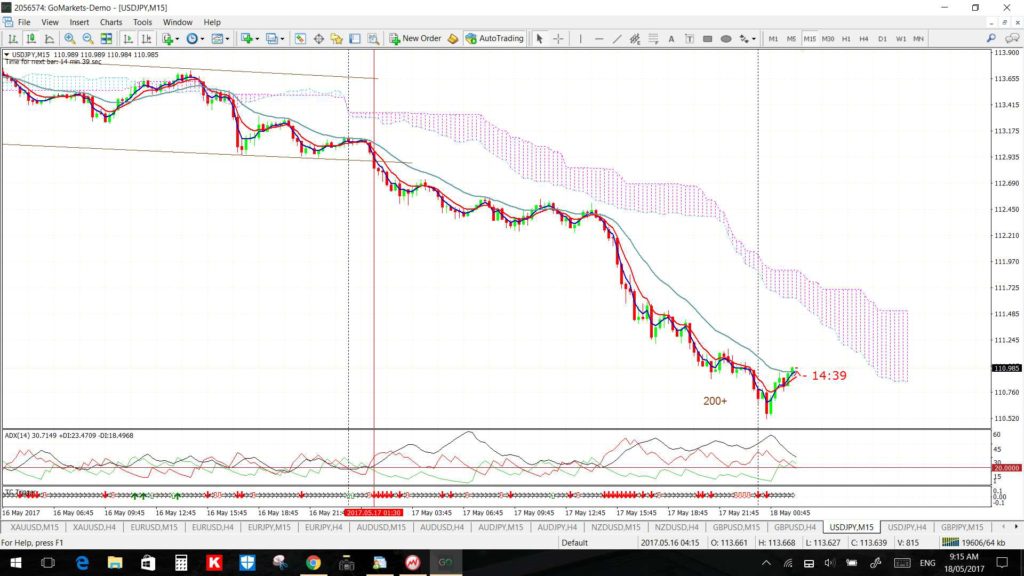
Shortly after this update there was a trend line breakout on the 15 minute chart that evolved with a new TC signal to SHORT.
The breakout move extended down to the 61.8% Fibonacci level and gave up to 200 pips:
The 15 minute chart signal also gave a great 200 pip haul:
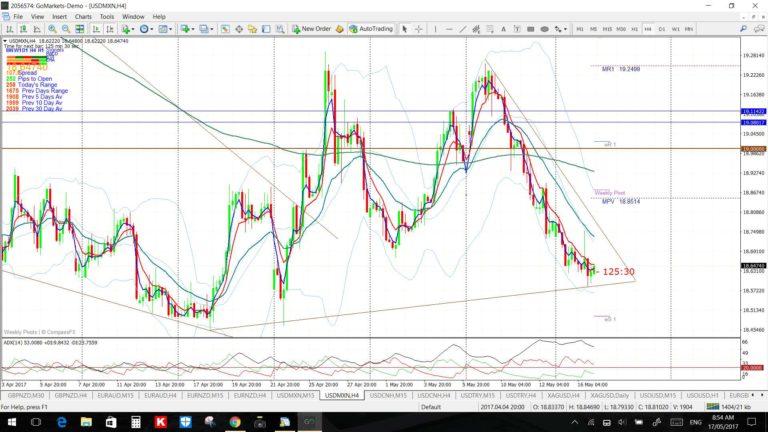
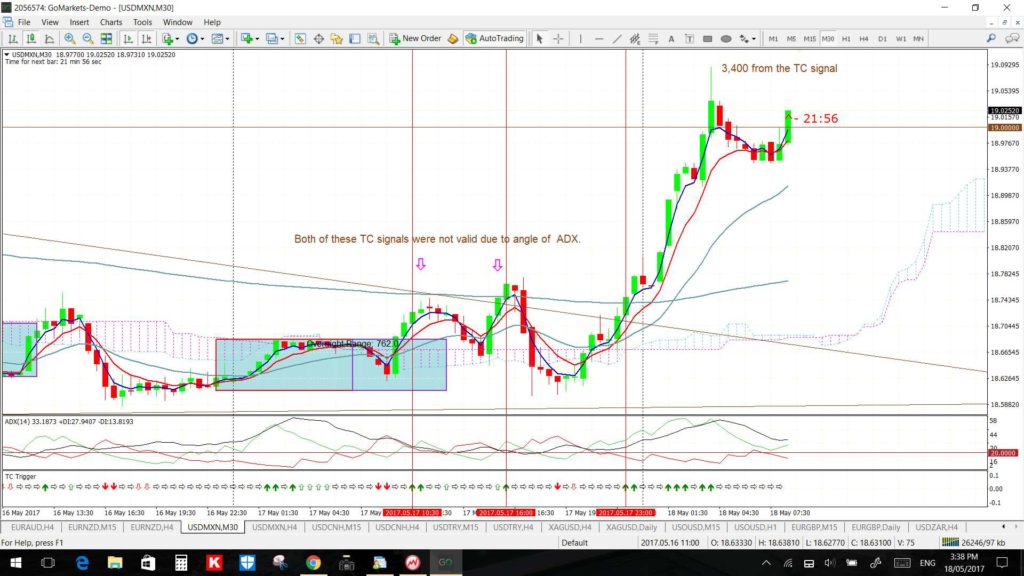
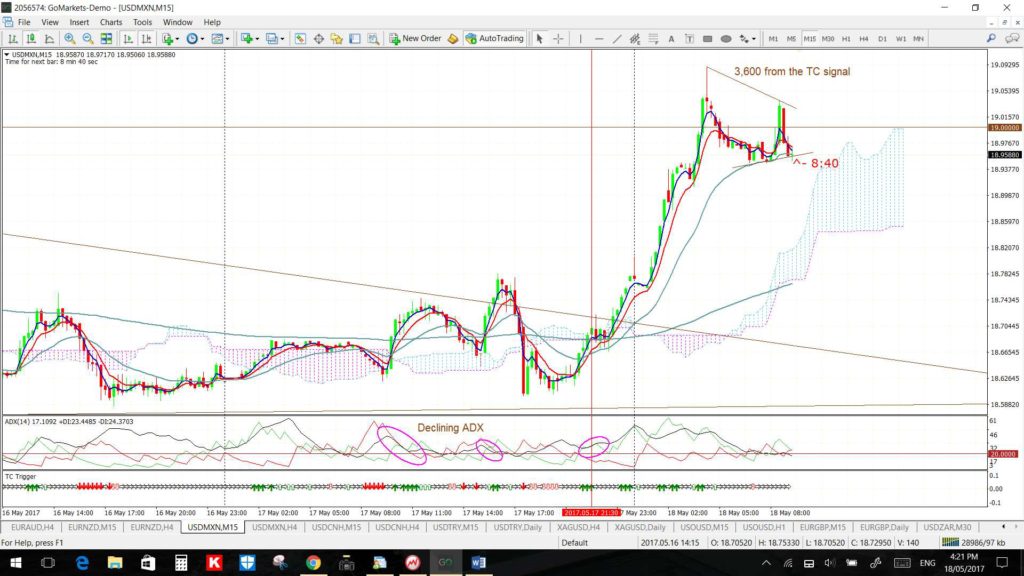
Lesson: USD/MXN: On Wednesday May 17th I posted to watch the USD/MXN to watch the triangle trend lines for any potential breakout. This was the 4hr chart from that post:
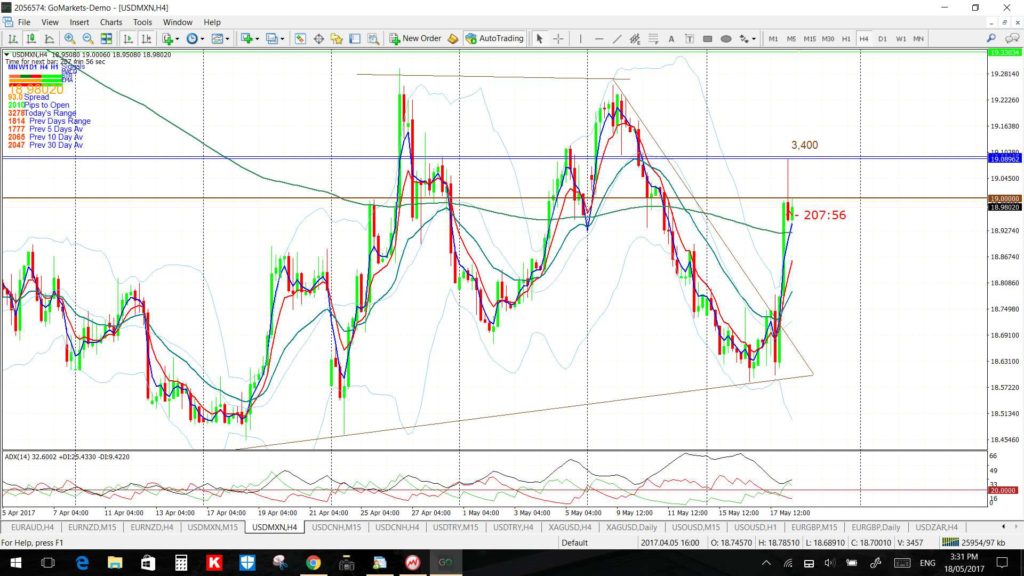
The breakout move evolved and delivered up to 3,400 pips as price headed back to test the key 19 S/R level.
Note how the first valid TC signal on the 30 min chart came during the late US session and gave up to 3,400 pips:
The first valid TC signal on the 15 min chart also came during the late US session just prior to the second trend line break attempt and this kicked on to give up to 3,600 pips:
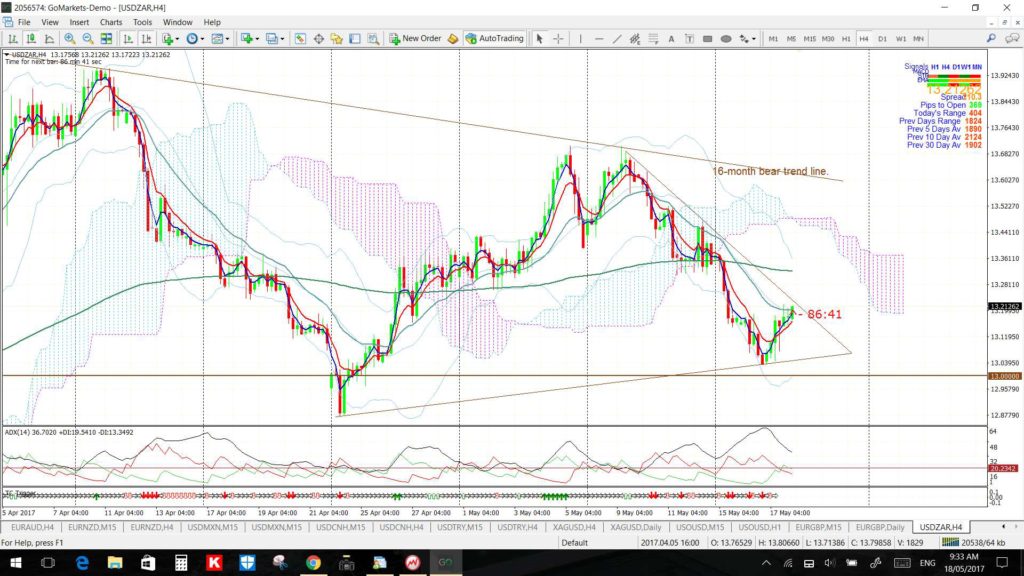
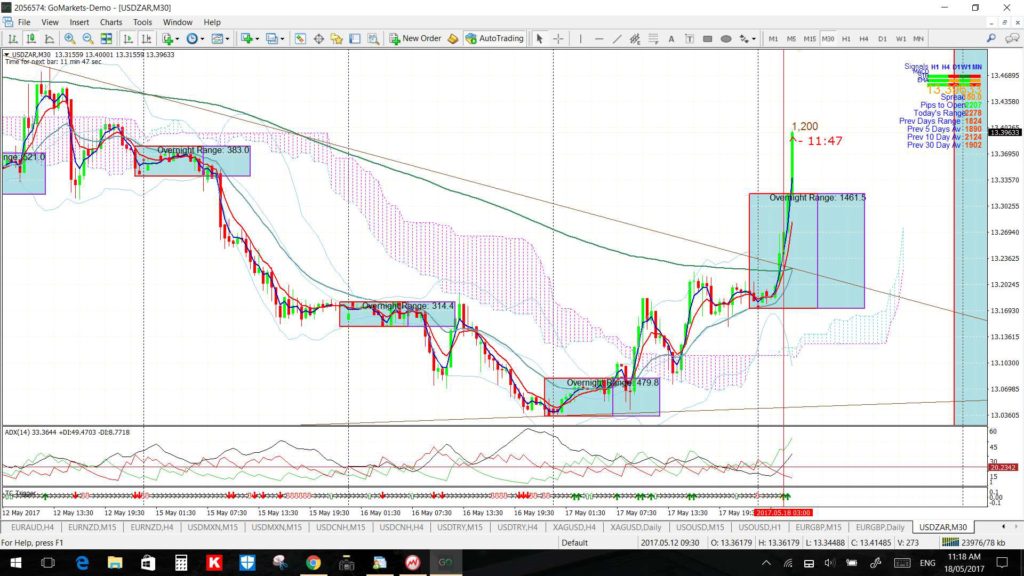
Lesson: USD/ZAR: On Thursday 18th May I updated a blog post with a chart of the USD/ZAR 4hr chart suggesting traders watch for any triangle trend line breakout. This was the 4hr chart from that article:
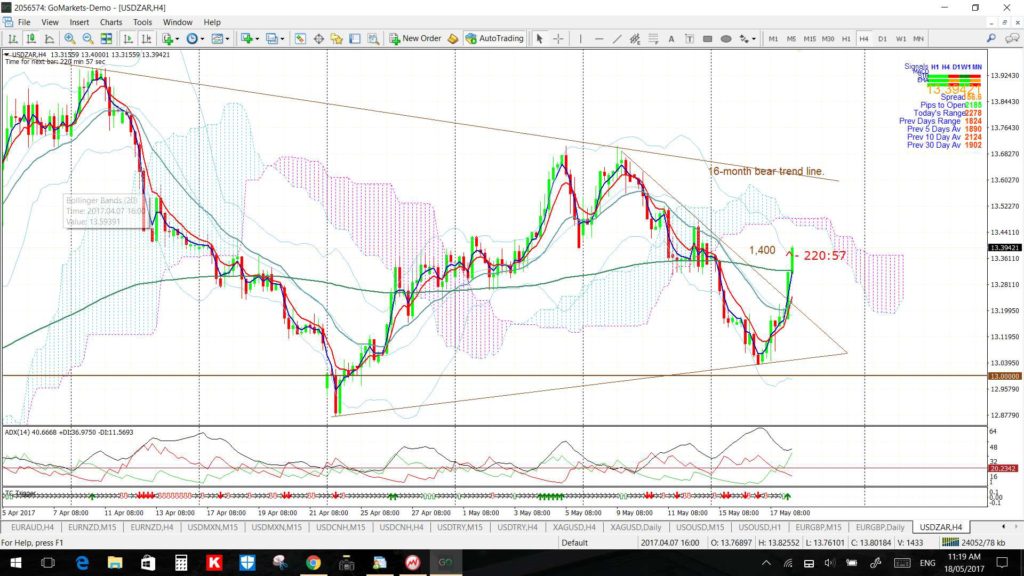
It was only 2 hours later when I notice there had already been a very productive trend line breakout:
The 30 minute chart reveals that a new TC LONG signal triggered just after this trend line breakout and gave up to 1,200 pips:
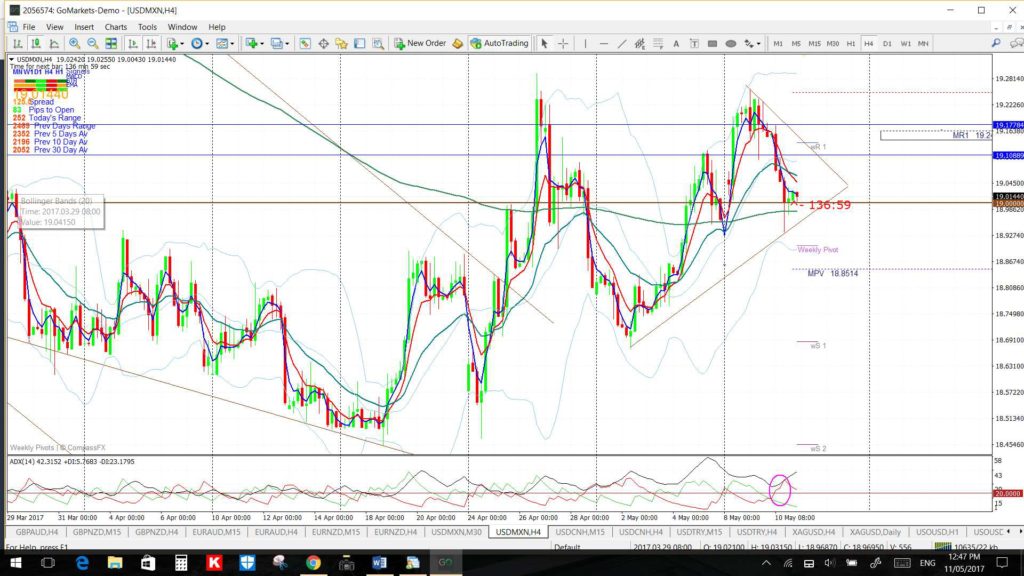
Lesson: USD/MXN: On Thursday May 11th I posted to watch the USD/MXN as it consolidated within a new triangle for the week. This was the 4hr chart from that post:
USD/MXN 4hr:
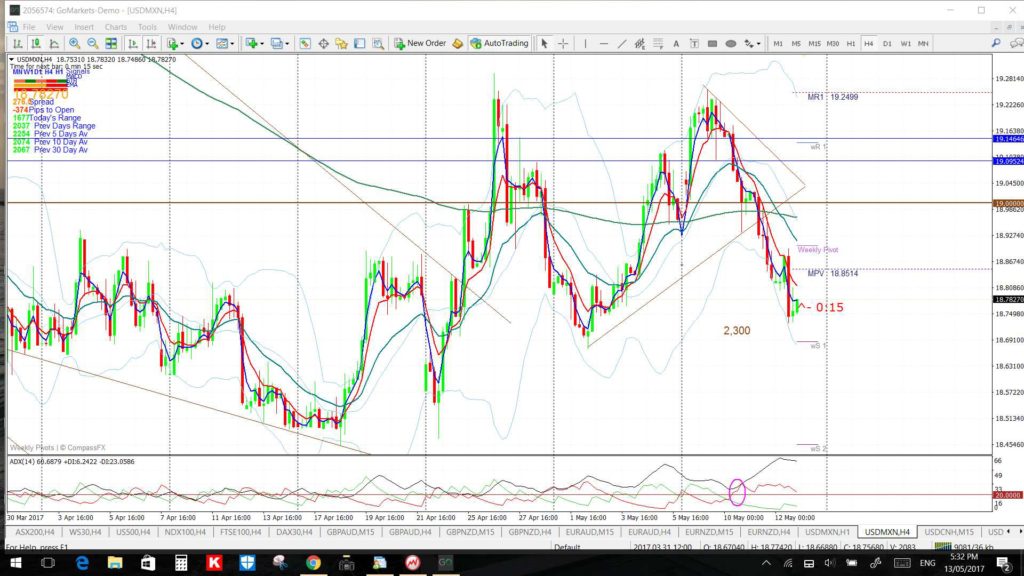
This was the 4hr chart by the end of the week showing a breakout move that delivered up to 2,300 pips:
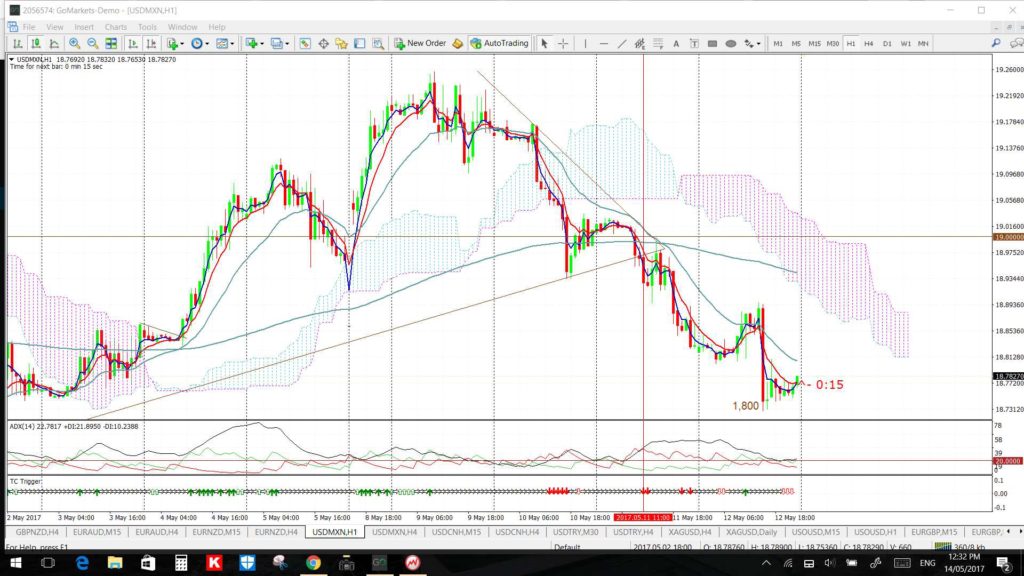
The 60 minute chart shows how this break of trend line came with a new TC SHORT signal, the first signal of the day, and was a good clue to SHORT here too with a move that gave up to 1,800 pips:
Lesson: GBP/NZD:
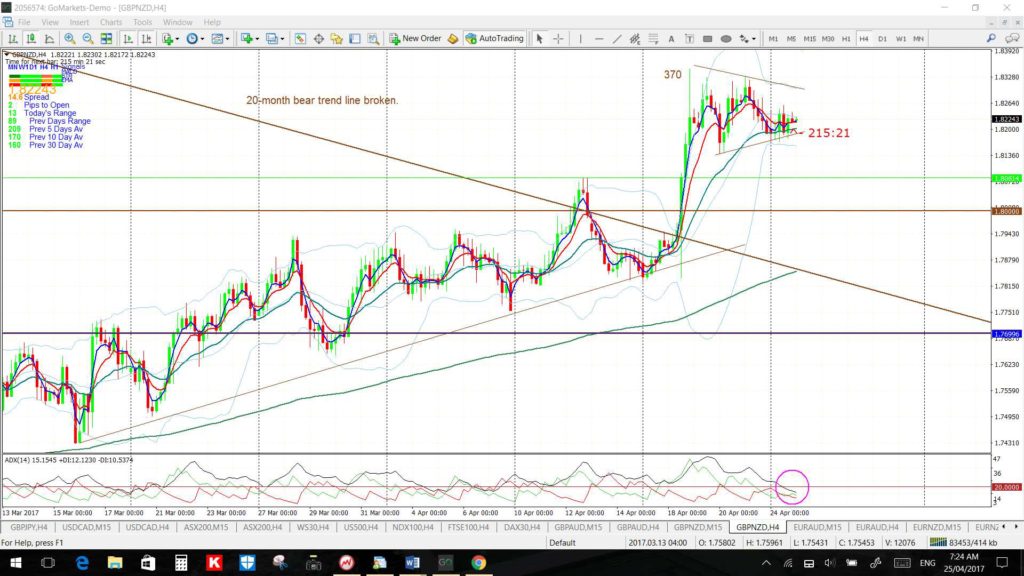
On Tuesday 25th April I noted that the GBP/NZD had been consolidating within a Flag following an earlier trend line breakout. The plan here was to watch for any test of these Flag trend lines:
GBP/NZD 4hr:
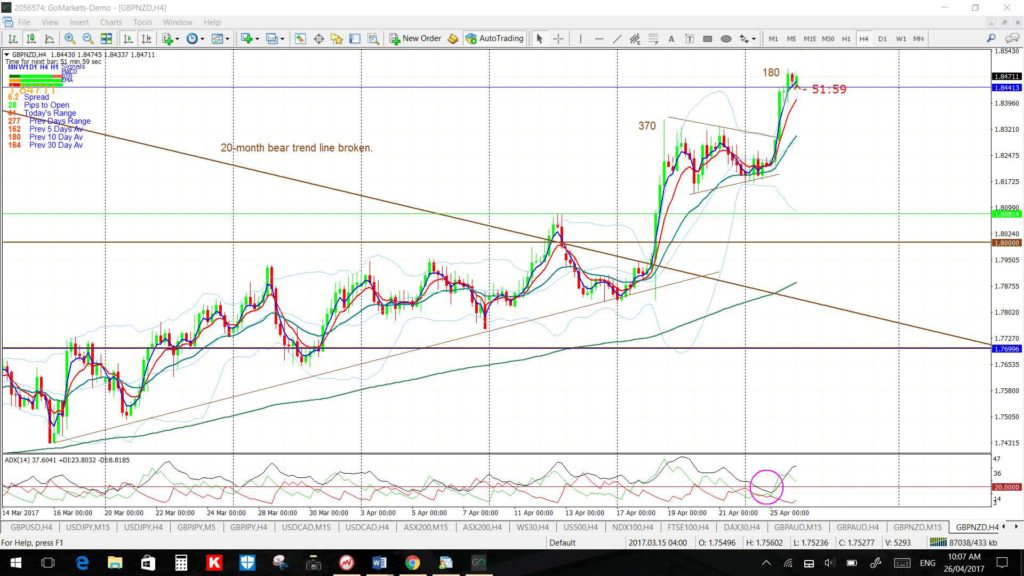
The next day it was noted that there had been a bullish breakout from this Flag that had delivered 180 pips:
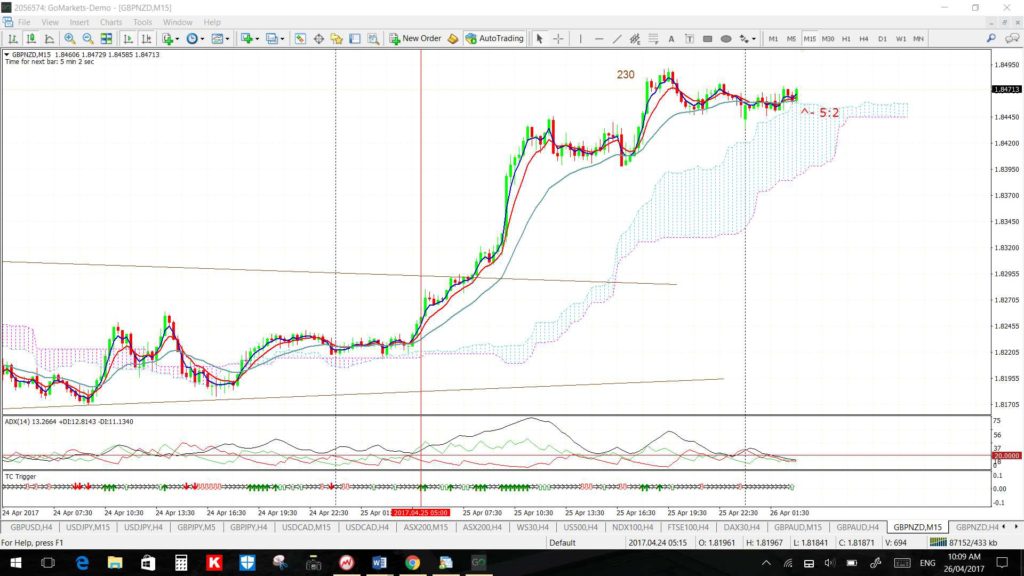
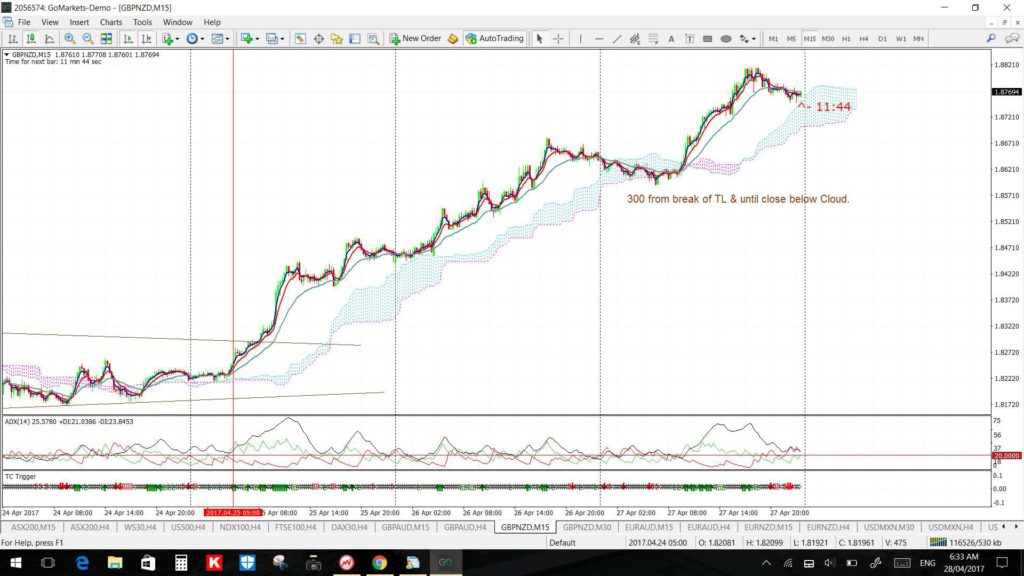
This bullish move came towards the end of the Asian session and there had been a new TC signal that triggered near this breakout. The new TC LONG signal would have given encouragement to watch for any breakout above the Flag trend line:
GBP/NZD 15 min:
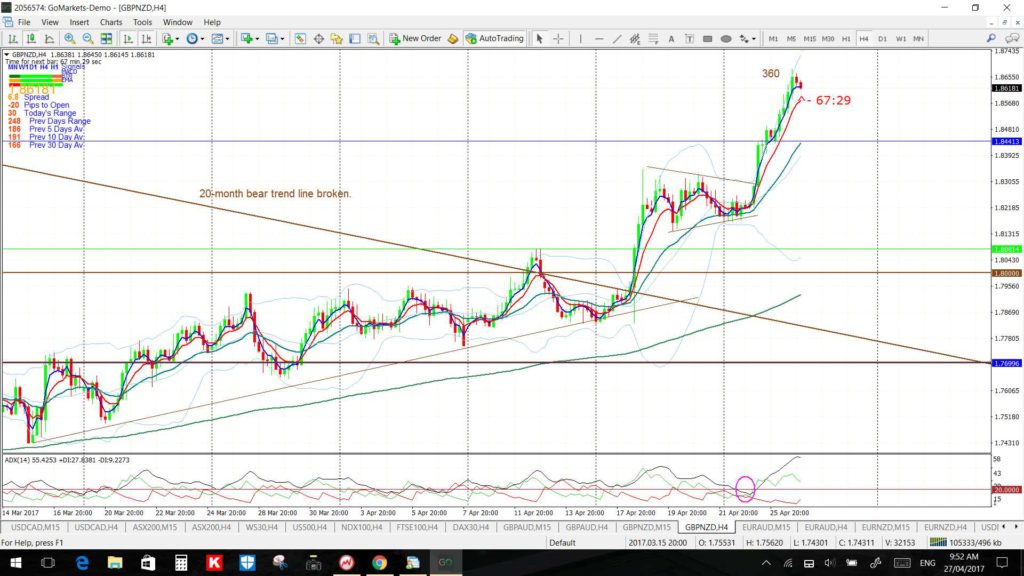
The next day it was noted that this bullish move had continued:
By the end of the week the yield from this bullish move was up to 550 pips as the 4hr chart below reveals:
The 15 min chart shows that by staying with this move after the trend line breakout until a dip back below the support of the Cloud would have enabled up to 300 pips to be caught from this overall move.
Lesson: USD/MXN:
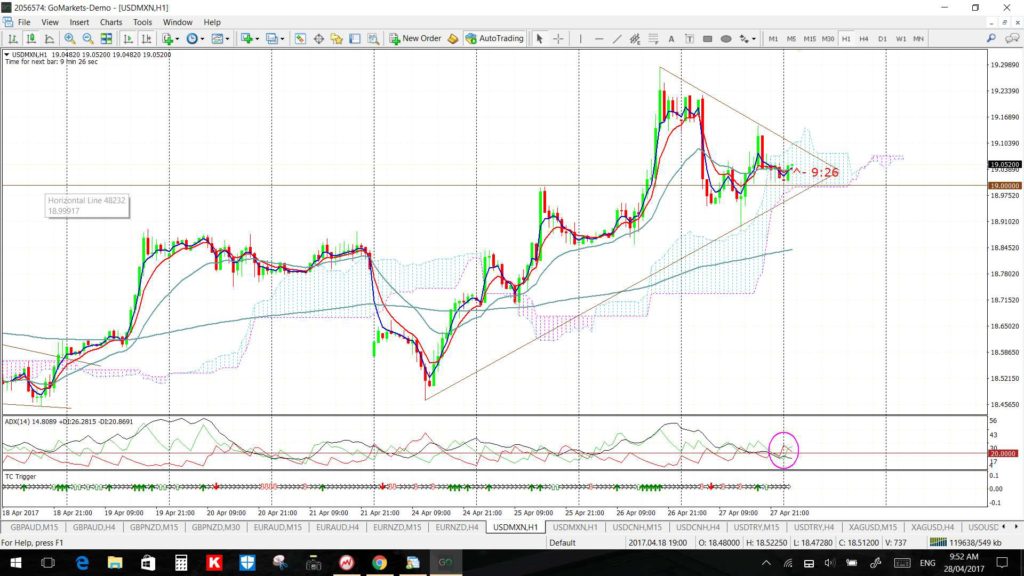
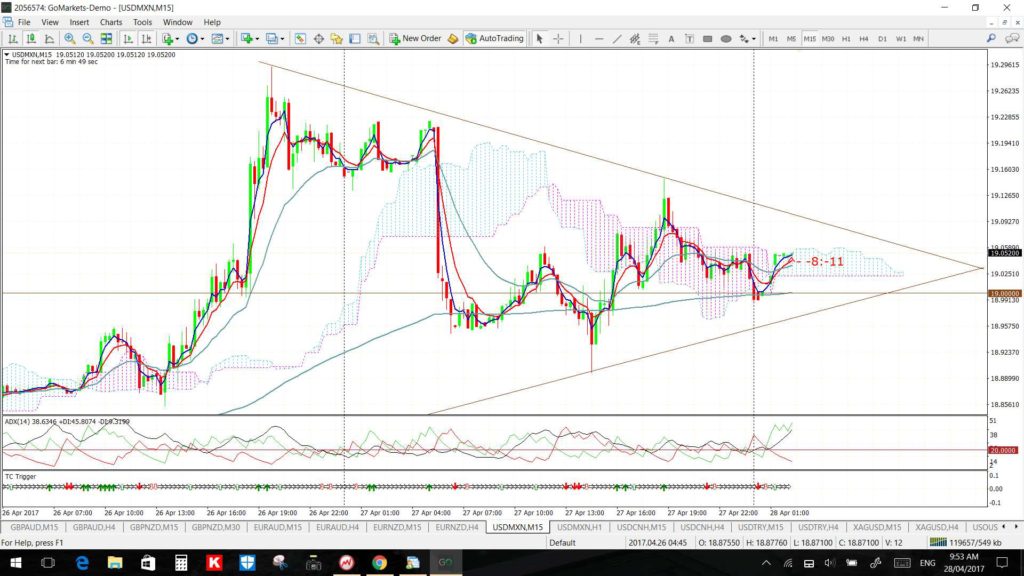
On Friday 28th April I Tweeted that I thought it was worth watching the triangle trend lines on the USD/MXN 60 min and 15 minutes charts for any breakout that might trigger during the US session. The charts from this post are below:
USD/MXN 60 min:
USD/MXN 15 min:
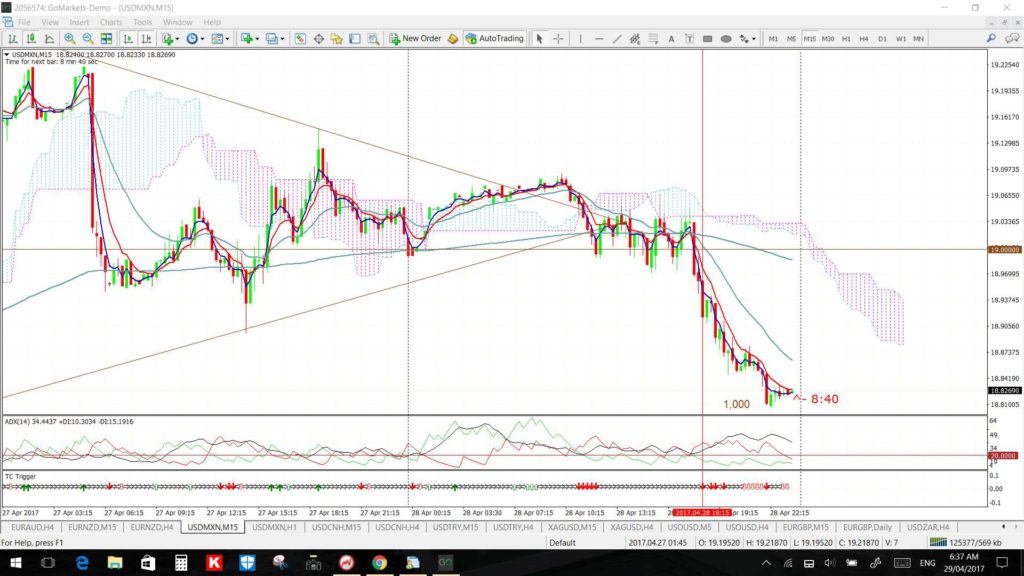
The 15 minute chart below shows that a new TC SHORT signal triggered during the US session after the triangle breakout and this went on to deliver 1,000 pips!
USD/MXN 15 min:
Lesson: FTSE-100 Index.
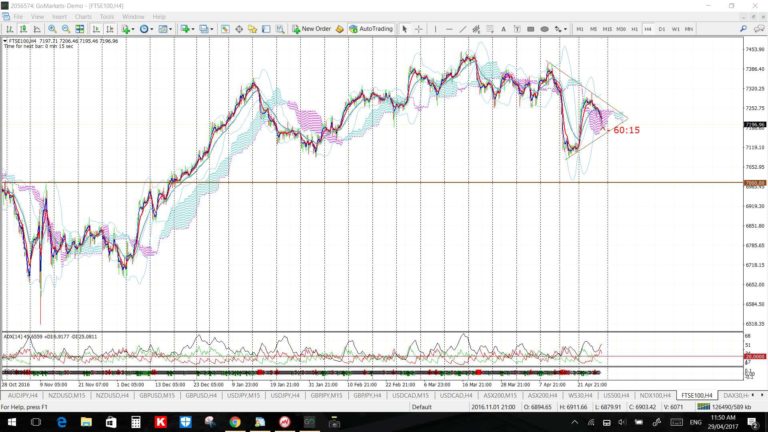
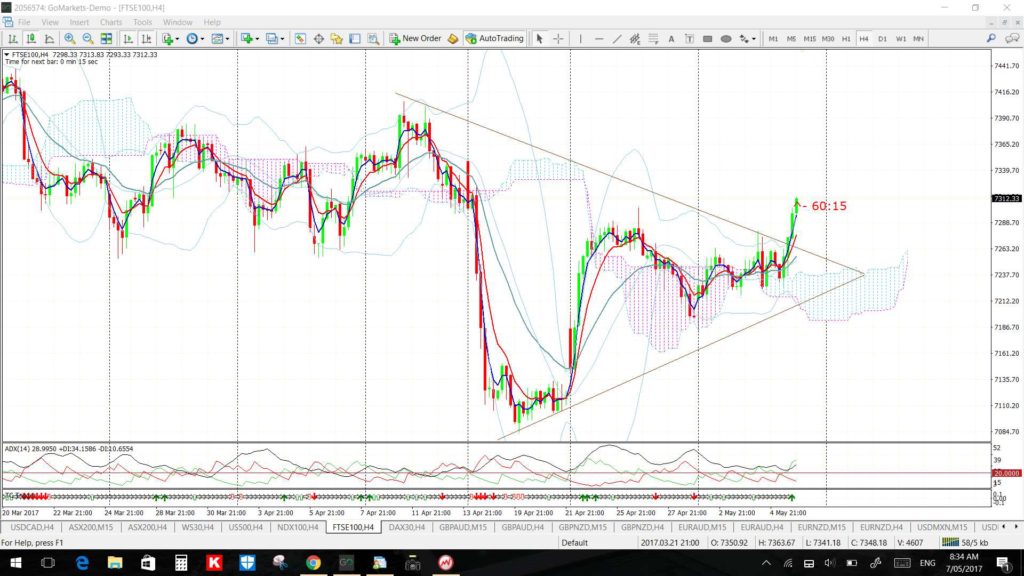
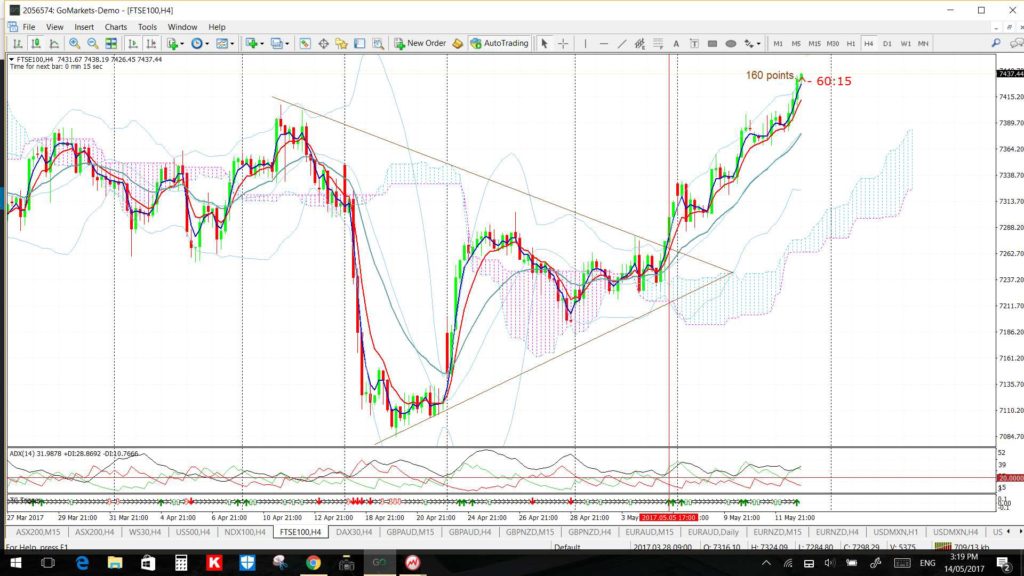
I had been stalking a triangle on the MT4 4hr chart of the FTSE-100 index for some sessions before the index finally gave a decent trend line breakout. Note how this trend line break, when it came, also triggered a new TC LONG signal.
FTSE-100 4hr: consolidating within a triangle prior to the breakout:
FTSE-100 4hr: shortly after the breakout. Note the new TC LONG signal that had triggered as well:
FTSE-100 4hr: this move went on for around 160 points.
Summary: Watching for longer-term trend line breakouts that evolve with, or near, new TC signals off shorter time frame charts offers opportunity to capture part of momentum-based breakout moves.
Further Examples: Further examples of applying TC with trend line breakouts can be found through the following links:
NB: I have received inquiries about my TC algorithm but please be patient as I explore options for sharing this.


