I recently had my TC algo coded for Trading View with the hope that I would be able to apply my algorithm to the trading of stocks as well as Forex. There have been a few teething issues that I have not been able to solve though. This post is a brief update on this project and my current thinking about the next steps worth taking.
The TC signals on Forex do not align across the Trading View and MT4 platforms; the signals are often out by a candle or two being consistently ‘late’ on the Trading View platform. The MT4 version of TC is more sensitive and, IMHO, works better. Back and forth communication with the Programmer did not solve this problem and I suspect it may be due to data feed issues. This was quite a disappointment to me and it undermined my confidence about the broader application of TC on the Trading View platform. I have also had the issue of how to narrow the universe of global stocks to those worthy of focus for any manageable day trading activity with TC. This has not been an easy task to grapple given my lack of experience and competence on the Trading View platform.
Over the last week or so though I have noted how the decline in the Telco sector of Aussie stocks seems to have slowed and, potentially, turned. I posted an article about Telstra and Tweeted about Vocus. Some weekly charts of Vocus are posted below.
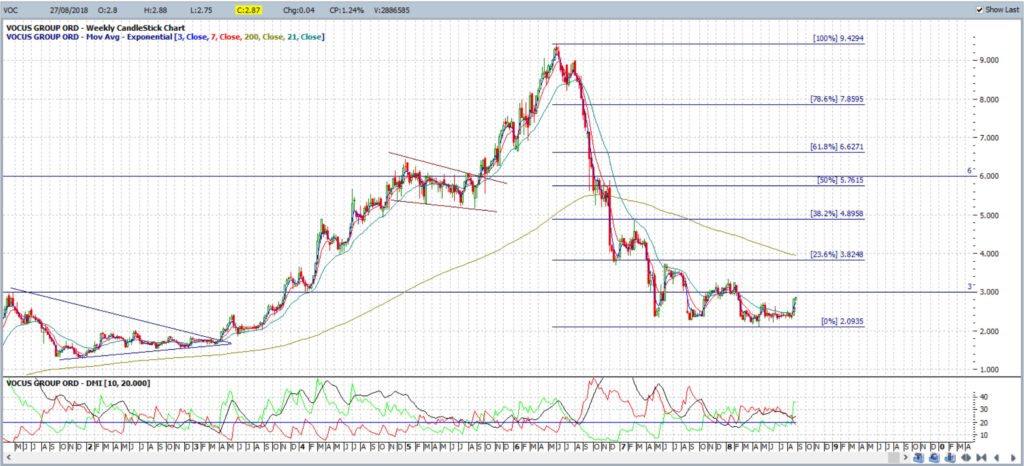
VOC weekly: this stock has been hammered but it might be about to turn. IMHO, a close and hold back above $3 would be bullish:
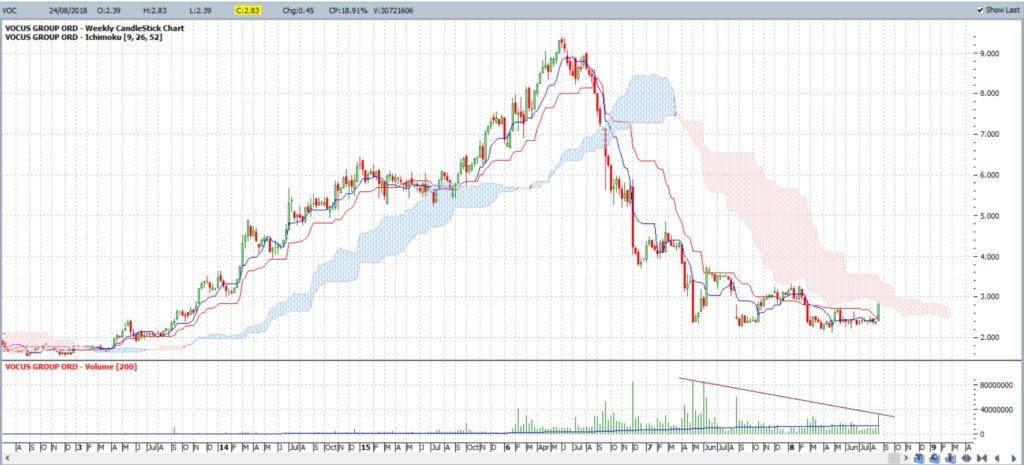
VOC weekly Cloud: a move back above the weekly Ichimoku Cloud on any Volume spike would be rather encouraging:
To this end I went back through the 15 min charts of Vocus on Trading View to see if there were any decent TC signals on the stock and was pleasantly surprised to see that a great TC signal did indeed trigger. Vocus is a fairly well know stock and trades with good volume which may help its suitability for TC.
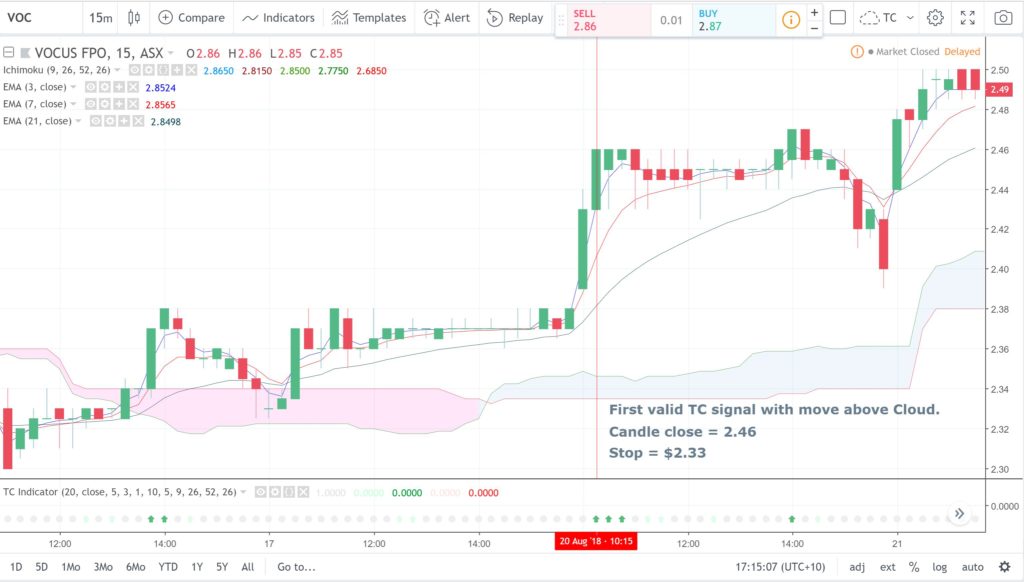
VOC 15 min: a TC signal to LONG triggered here on August 20th: The signal came at the candle close value of $2.46 and a Stop placed below the Cloud would be at $2.33, thus, the Risk = $0.13 cents.
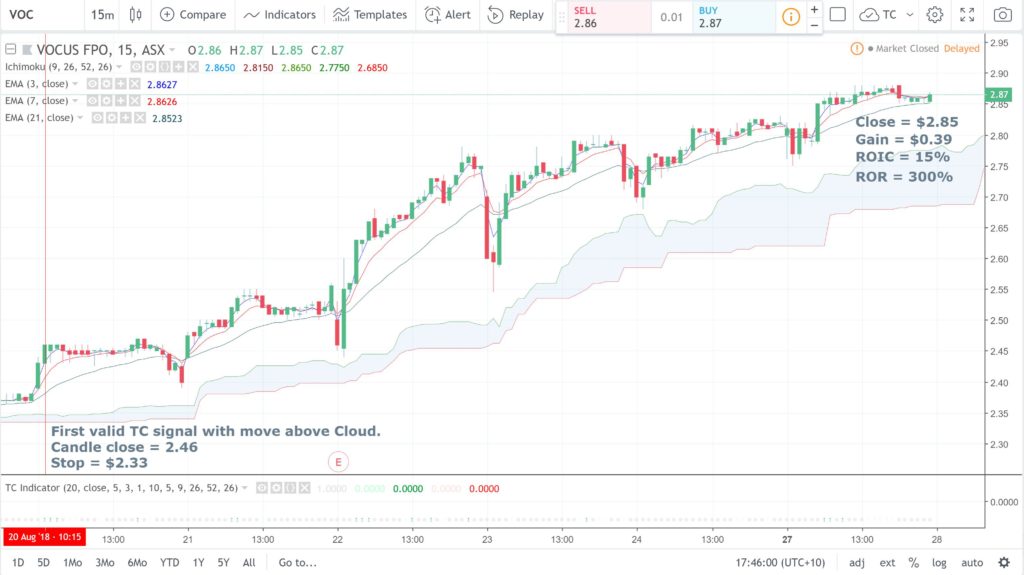
VOC 15 min: this TC signal is still open and the trade is up by $0.39 cents. A very conservative view of Return on Invested Capital (ROIC) would be 15% for the week: calculated as: [ (0.39/2.46) x 100]. However, the Return on Risk (ROR) is a huge 300%: calculated as: [( 0.39/0.13) x 100].
Conclusion: The success of the application of TC to this particular stock has encouraged me to persevere with working on ways to narrow the trading approach of TC on stocks. I will be exploring ways of scanning for stocks that trade with reasonable Volume for movement either above of below the Ichimoku Cloud as a way of culling in the first instance.


