This page contains TC trading hints designed to support members of my TC Trading Trial. I will add to this page throughout the 8-week TC Trial period.
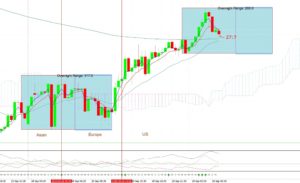
- Often best to wait for higher Volume: The 30 minute chart below shows that price action on this instrument was trying to push higher. There were two TC LONG signals but the one worked better than the other. Signals that trigger during the Asian session are always going to be more risky than ones that trigger during the higher volume later trading sessions. It all comes down to the risk that a trader is prepared to take.
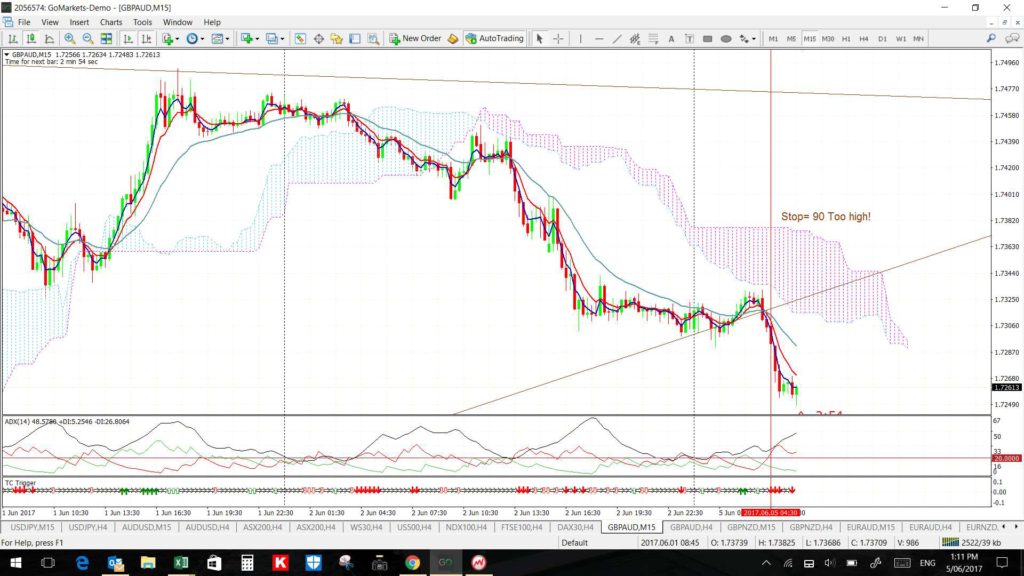
- Stop too big: so don’t take the trade! Here is an example of a valid TC signal from Mon 5th June on the GBP/AUD 15 min chart BUT, with a Stop needed of over 90, then this would be one I would skip:
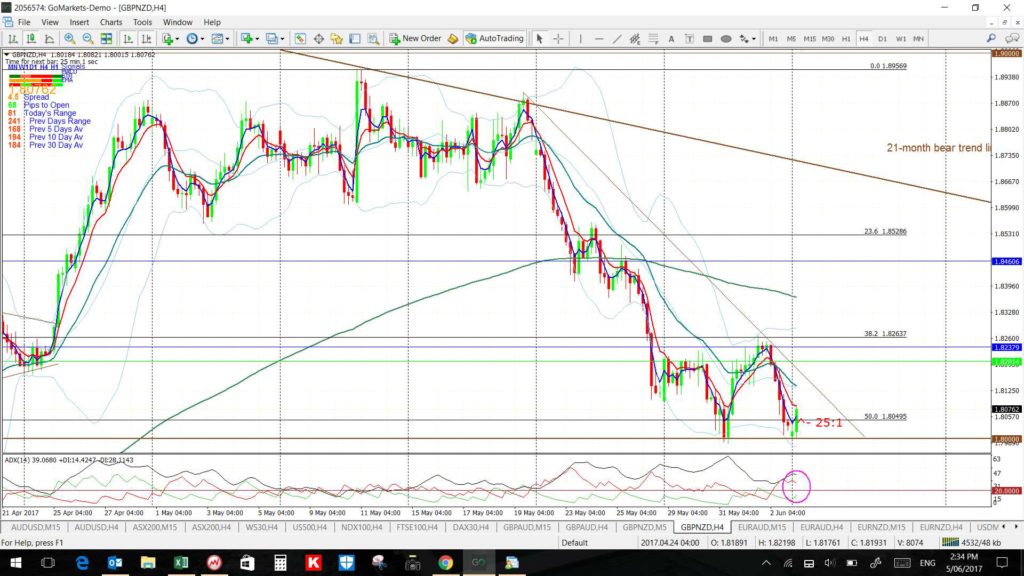
- Watching for the bounce off support: I’d noted the 1.80 support level on the GBP/NZD in my w/e write up and see on Monday that price was respecting this level:
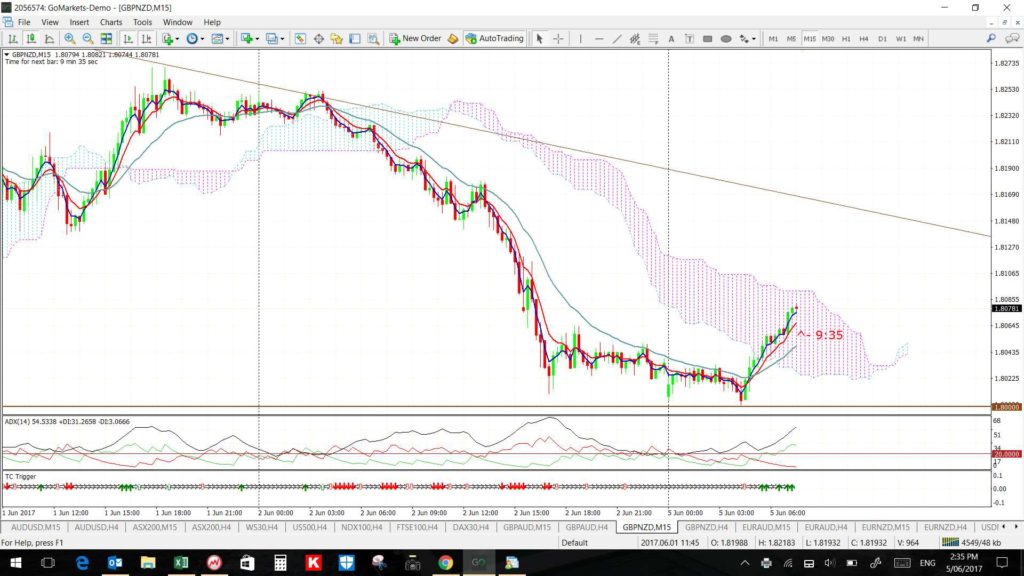
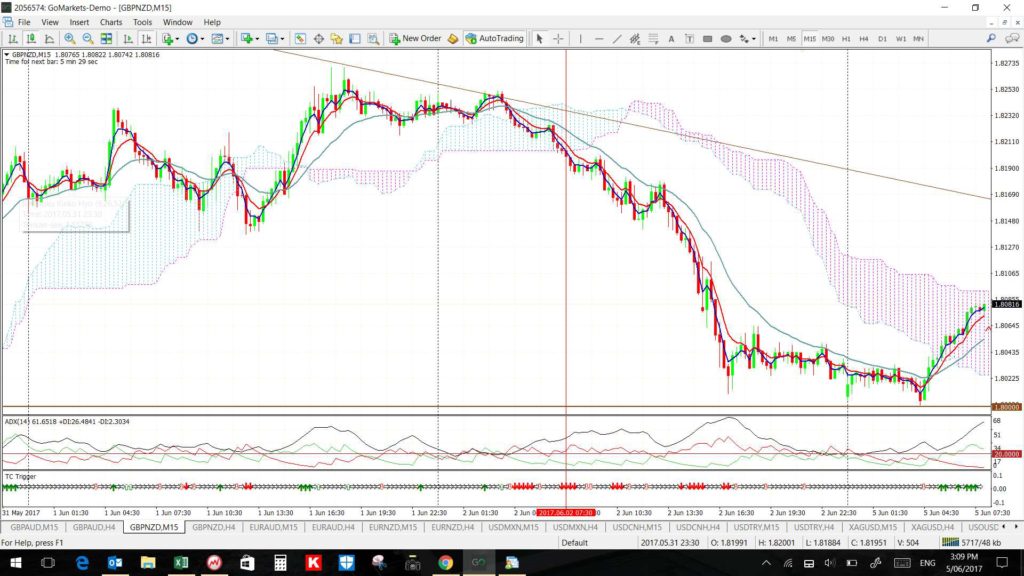
Looking to the 15 min chart though revealed it was going to take a while to get up through the Cloud:
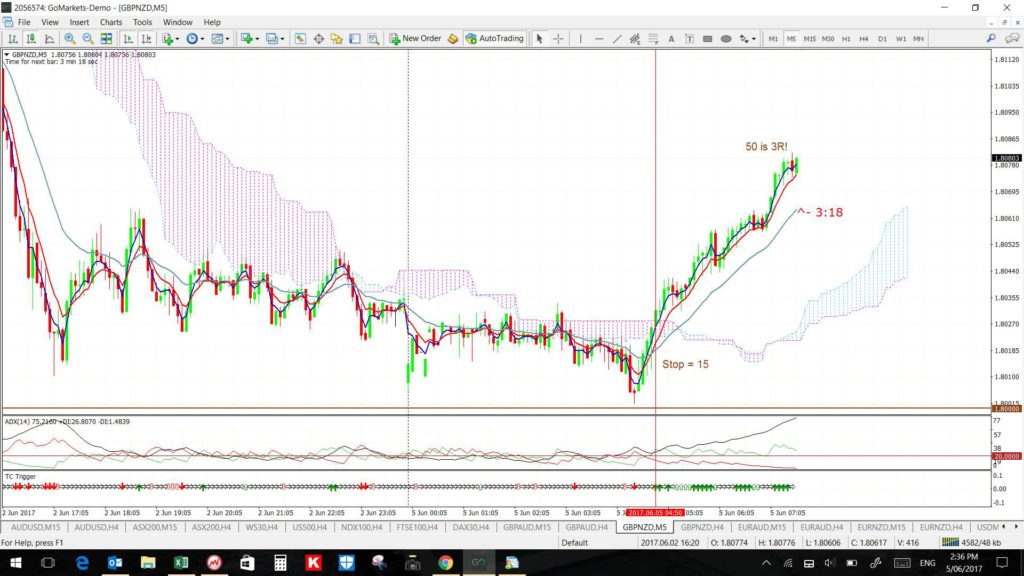
It’s times like these when drilling down to the 5 min chart can help though. In this situation there was a new TC signal and the Risk needed was only 15 pips. This may have been considered a reasonable Risk to take to capture some possible bounce move up from this support level. In this case, there has been a move through Asia already of 50 pips which is 3 x the Risk needed or 3R. Traders need to assess the Risk to potential Reward before considering each trade.
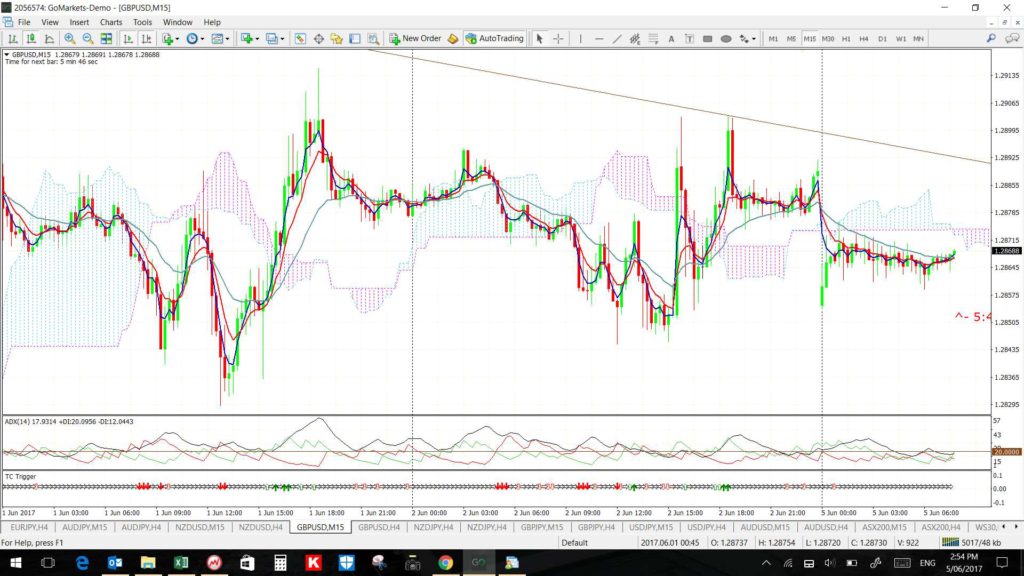
- Price Action that I don’t like! I’ve previously discussed that traders need to look for consolidation-style price action to potentially yield the best momentum breakout moves. I’ve also mentioned that if such price action bears large candles, with erratic movement and/or those with lots of shadows then that type of FX pair, despite the breakout pattern, is one best left. The 15 minute chart of the GBP/USD is an example of that for me today. This is not a chart that I would be keen to take ANY new TC signal from due to the erratic recent history, large candles and lots of shadows:
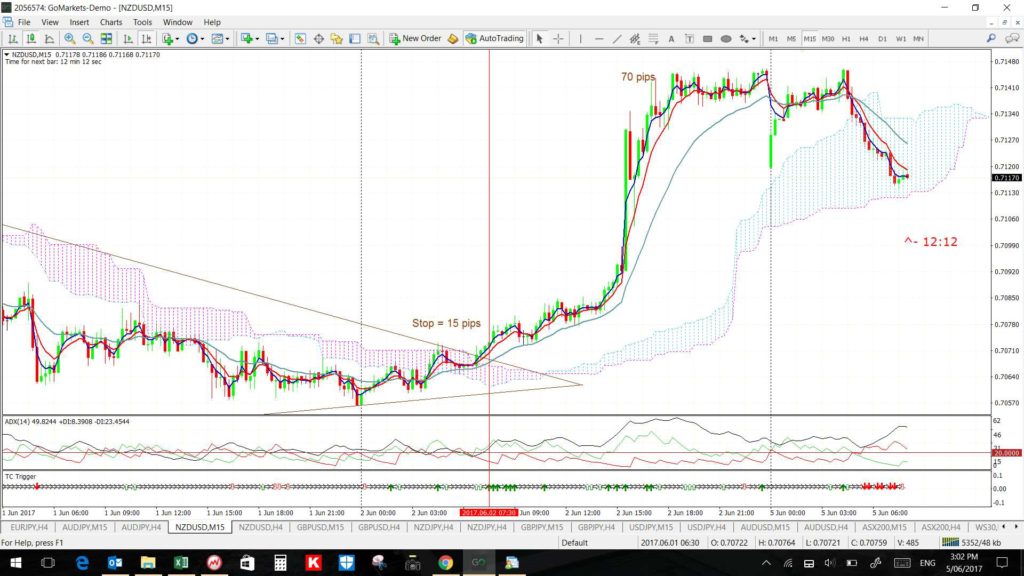
Now, compare this to the price action in the lead up to last Friday’s trend line breakout on the NZD/USD 15 min chart. The candles in the lead up to the breakout on the Friday were rather small, activity war rather ordered in a sideways fashion and the candle did not have many long shadows. This chart is the type of price action that would give encouragement to me with my TC system:
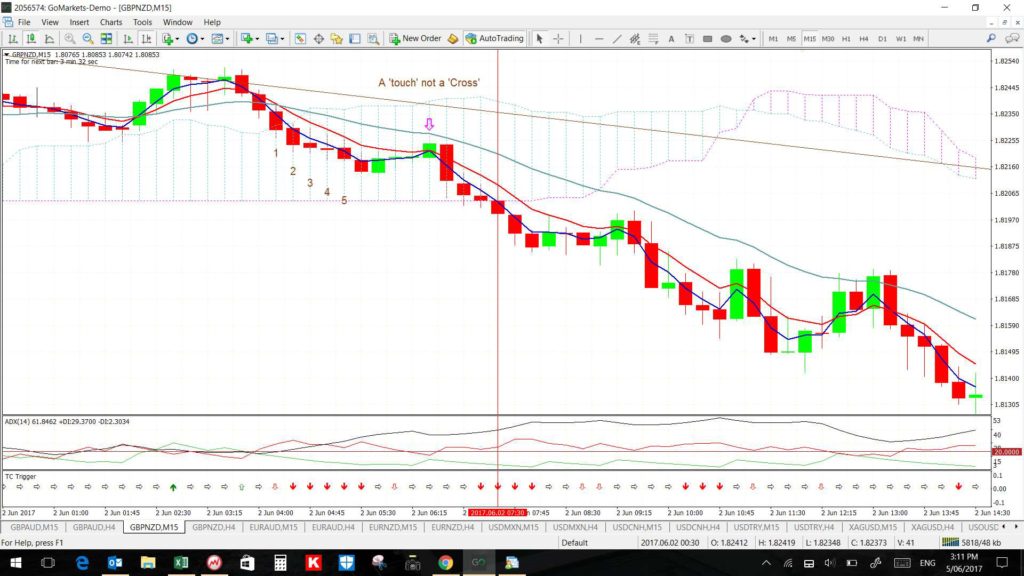
- EMA ‘Touch’ versus ‘Cross’: There have been examples of people mis-reading TC signals as they think there has been a new EMA ‘cross’ giving a TC Continuation signal. However, these are not actually EMA ‘Cross’ situations rather than EMA ‘Touch’ situations and they therefore DO NOT constitute a new TC signal. A recent example is below with the GBP/NZD 15 min chart. A vertical line is drawn through what is thought to be a valid new TC signal as it came within 5 candles of what was thought to be a new EMA cross.
When you magnify the chart, though, it is clear that this is not a new EMA ‘Cross’ but rather an EMA ‘Touch’. The 5 candle count from the proper EMA cross, when the candle first closed below the 3 EMA, is shown:


