Trade Charting, referred to as TC, is a system that can be applied over any time frame and this post illustrates how TC can be used for stocks on both the weekly and intra-day time frame using AMD as an example.
AMD and weekly TC trading: my TC trading system looks for stocks breaking out of weekly, or daily, chart-based congestion patterns. This example shows how this system was applied to AMD.
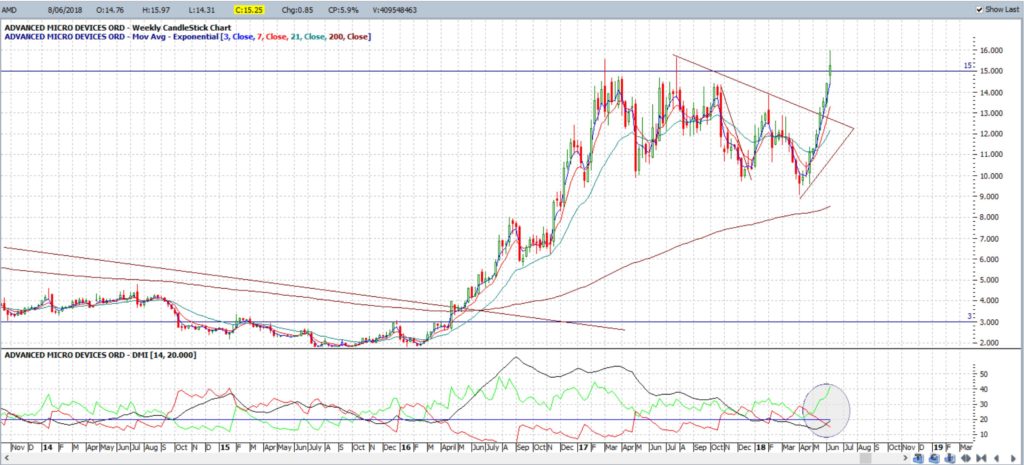
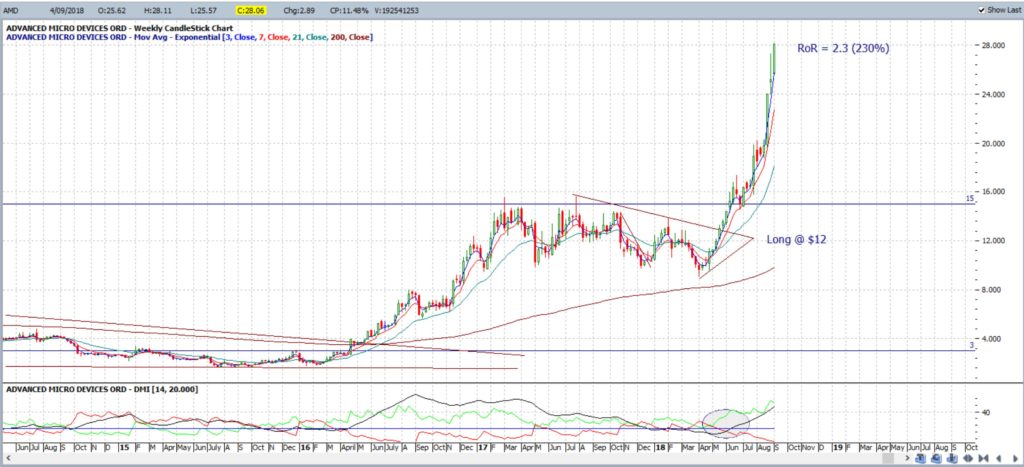
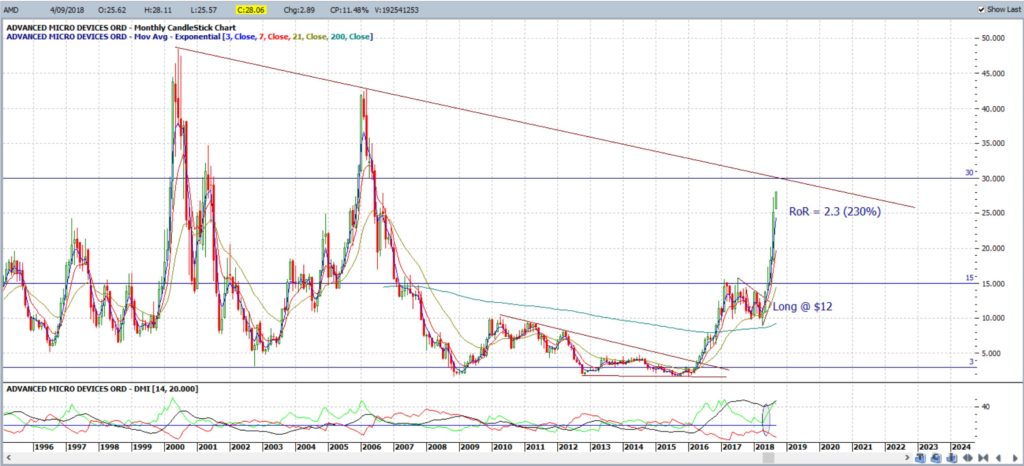
I wrote about AMD back in June suggesting traders watch for any monthly candle close above $15 to be a bullish signal. I have been LONG here since $12 following the triangle breakout and I am still holding stock.
AMD weekly June: this was how AMD appeared on the weekly chart back then:
AMD weekly Sept: this is the chart today showing a RoR of 2.3 R or 230%
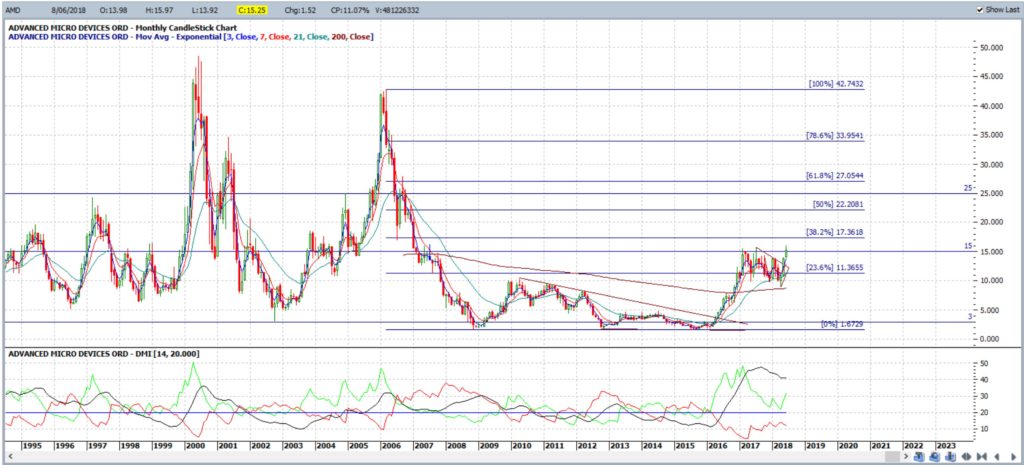
AMD monthly June: this was the monthly chart from June:
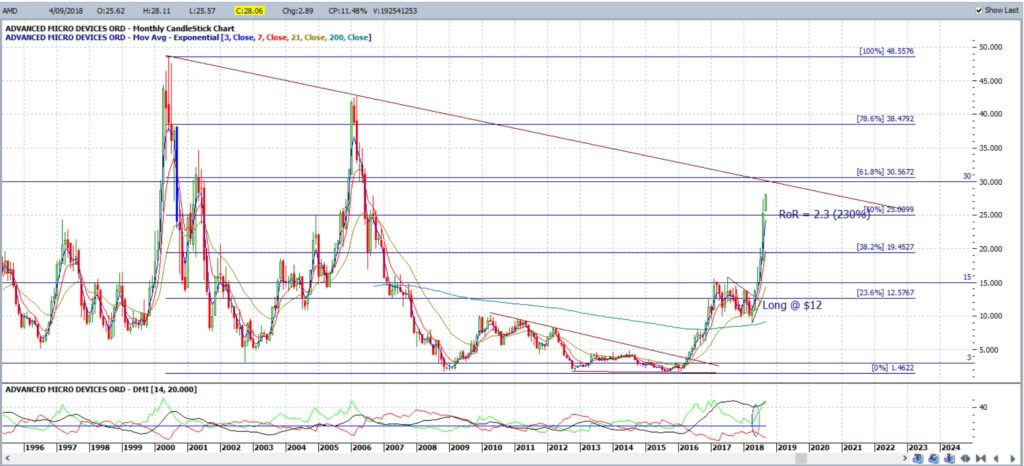
AMD monthly Sept: note the acceleration with this move after the monthly close above $15:
AMD monthly: targets? What are the levels to watch now? I would expect price action might slow, stall or even pullback as it nears the $30 level as this is previous S/R, is near a monthly bear trend line and and is near the monthly 61.8% fib.
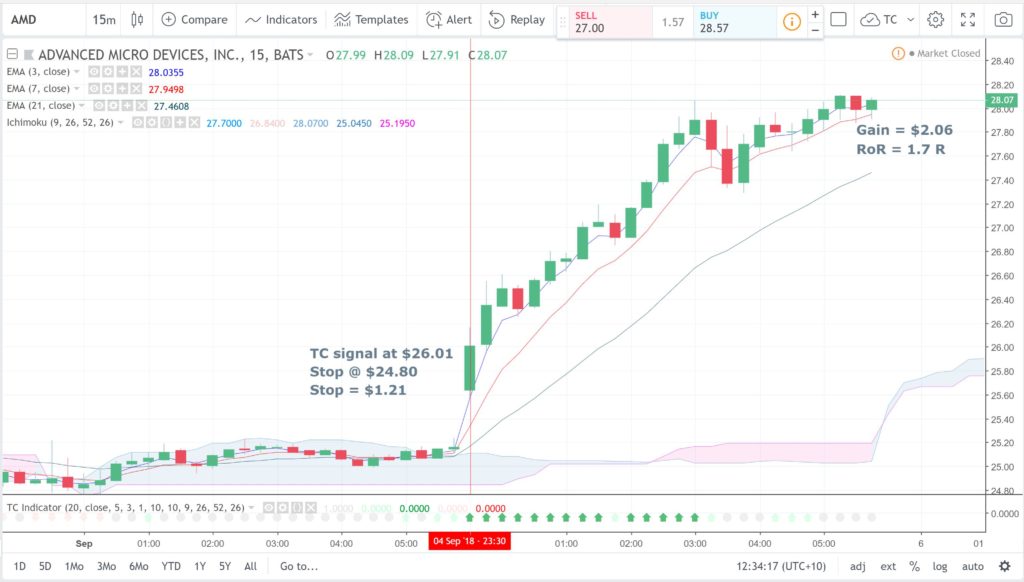
TC and Intra-Day trading: I have only recently had my TC Trigger coded for use on Trading View so that it can be applied to the trading of stocks. I have posted a few articles showing the benefit of this so far on Aussie ASX stocks but here is a great example on a US stocks; with AMD. Traders watch for a TC signal to trigger once price action moves out of a sideways congestion pattern.
AMD 15 min: Price action had been trading sideways within the Ichimoku Cloud but the breakout gave a new TC signal last session worth 1.7 R, or 170%.
Summary: TC is a successful system that can be applied over any time frame.


