TC© User Manual
TC User Manual: Contents
- IMPORTANT NOTICE: Trade Charting©
- Introduction
- Disclaimer
- Setting up your MT4 platform and preparing for trading
- TradeCharting FX Signal Entry Rules
- ‘New’ vs ‘Continuation’ TC trade signals
- Risk to Reward: A vital consideration for any new trade
- TC signals and the TC Trading system: choosing which signals to take
- Examples of Trade Charting TC signals
- Currency Strength Indicator (CSI): Narrowing the Trading Universe
- Summary Checklist for TC Trading System
- TradeCharting Trade Exit criteria: Take Profit levels and Stops
- Suggested Guidelines for Trade Charting trend trading
- Determining the overall market trend: Using Indices
- Risk Management and Correlation of trading pairs
- Trading regime: Using the TC Trading System to trade Forex
- Checklist: putting it all together
This edition was updated on 3rd September 2018.
1. IMPORTANT NOTICE: Trade Charting©
Thank you for your interest in the Trade Charting TC Trading System. Please understand that this document represents the culmination of many years of hard work and substantial financial investment. To this end, please respect the endeavour by keeping this work confidential and for your own individual use.
Please observe and adhere to the following instructions:
The information in this document is CONFIDENTIAL and PROPRIETARY and is not to be disclosed to any third party.
You acknowledge and agree that we are the sole and absolute legal and beneficial owner of the TC Trading System and TC Trigger and all of the information in the TC User Manual (Intellectual Property), and that all of the Intellectual Property shall remain our exclusive property notwithstanding the grant to you of the limited rights set out in this letter. You must not re-engineer or reverse engineer any of our Intellectual Property.
You further acknowledge that the grant to you of authority to use the TC Trading System, TC Trigger and the User Manual is non-exclusive and non-transferrable. We are entitled, without restriction to continue to make use of, and to permit others to use the Intellectual Property without reference to you.
You must not authorise or permit any other party access to or use of all or any of the Intellectual Property and you are not permitted to assign, transfer or sub-licence any of your rights to any other party. Reproduction or translation of any part of this work by any means, electronic or mechanical, including photocopying, beyond that permitted by the copyright law, without permission of the publisher, is unlawful. You must immediately notify us if you become aware of any unauthorised use or infringement of any of our Intellectual Property. Anyone found to be distributing illegal copies of this work will be prosecuted to the fullest existent of the law.
Questions: Any questions can be sent to: mary@tradecharting.com
2. Introduction
Thank you again for your interest in Trade Charting’s TC Trading System and we hope that this systematic approach to trading improves your trading performance.
This trend-trading technical system was developed over a number of years and after spending countless hours (and dollars!) reading and learning about trading from many different sources.
The TC Trading System provides trade entry signals applicable to any trading instrument. Trade Charting uses a combination of indicators and provides traders with a mechanical trade entry system. Does the system work 100% of the time? No, but the system is successful in a majority of trades and, with effective money management, this can then be very profitable.
The TC Trading System relies on catching strong, market-momentum moves with the aim of entering a trade that has sufficient volume and movement to provide a profitable result. It is not possible to continually pick entries at market bottom or tops and so traders need to be content to enter a moving trade and to try and catch a good slice of that movement.
Mechanical systems, such as The TC Trading System, offer an advantage in that they take out much of the anxiety and/or guess work from trading as a trade is only placed when all the indicators align at their optimum levels. The Trade Charting system is very visual and takes only moments to assess on any trading instrument (Forex, Stocks, ETFs, and Futures etc) and on any time frame.
Patience, discipline, a solid trade-plan and good money management are the other critical factors in any successful trading regime.
The TC Trading System is applicable to FX on any time frame and is useful with Stocks as well but this manual will focus on using TradeCharting to trade the Forex market.
A critical component for the TC Trading System is the TC Trigger Indicator. This indicator was developed in 2017 and submitted to two TC Trials that demonstrated correct and disciplined application of the TC system was profitable. The trading rules and guidelines have been refined since those TC Trials and form the rest of this revised TC Manual.
Please note that this TC Manual is presented with the assumption that you are already familiar with the basic concepts of Forex trading and charting. It is not our aim to teach about Forex basics, charting, indicators or technical analysis.
Aim: the aim of this endeavour is to provide a template of the Trade Charting trading system and explain how traders can use the Trade Charting approach in their trading.
We wish you every success with learning how to use the TC Trading System and improving your trading performance.
Mary McNamara,
Director at Trade Charting Pty Ltd.
B Sc (Hons) M.Ed.
RG146
3. Disclaimer
All Foreign Exchange (FX) trading and investing is speculative, involves risk and is not suitable for all investors and before trading FX you should consider your trading knowledge, trading competency and risk appetite to determine whether FX trading is suitable for you. Traders should only use risk capital in their trading and only use capital that they can afford to lose.
The author of The TC Trading System is certified with ASIC compliance RG 146 but is not a professional money manager/advisor and is not licenced to provide personal investment advice. The information that we provide to you does not, and is not intended to, constitute personalised investment advice, but is made available solely for general and educational purposes. If you require investment advice, this must be obtained by you independently of us.
The information provided by us is made available to you in good faith. We not liable or responsible for any errors or omissions in the TC Trading System, TC Trigger or the User Manual, whether due to our negligence or otherwise.
The TC Trading System materials showing example trades are given for illustration purposes only and are not to be taken as suggestions for trades.
All information provided in these materials is offered in good faith and any errors that arise are entirely accidental. Trade Charting is not liable for any errors or omissions that may have occurred. The information provided alone should not be relied upon for the purposes of carrying out a transaction or trade; nor does in constitute any form of investment-, tax-, or legal advice, or as a recommendation regarding particular stocks, options, financial instruments or other investments.
You acknowledge and agree that neither this Company nor any of its Directors, officers or employees makes, or has made any warranties or representations with regard to any aspect of our Intellectual Property or the usability, viability, accuracy or practical application thereof.
Relying on your own skills, experience and ability, you are permitted to use our Intellectual Property solely at your own risk, acknowledging that Foreign Exchange trading is speculative, involves risk, and is not suitable for all investors. You are expected to consider and rely on your own trading knowledge, trading competency, and your risk appetite when dealing with the TC Trading System.
You should not embark on Foreign Exchange trading using a ‘live’ account until you have developed and tested your own trading plan and you are comfortable with what you are doing, using only such risk capital as you can afford to lose. Before doing so, please ensure that you thoroughly read and understand the TC User Manual and practice its use in simulation mode, for a reasonable period of time before using the TC Trading System in live trading.
Neither this Company nor any of our Directors, officers or employees shall be liable for any losses or damage which you may suffer or which may result from your trading, relying on the TC Trading System, TC Trigger, our User Manual or any other information which you may have obtained from us. You recognise that losses are a normal part of any trading program, and it is your responsibility to develop a risk management program before you undertake any trading.
You indemnify us from all and any claims which may be made as a result of or in connection with your access to or use of our Intellectual Property.
4. Setting up your MT4 platform and preparing for trading
- Indicators Used in my TC system:
- Exponential Moving Average: EMA 3 day (blue)
- Exponential Moving Average: EMA 7 day (red)
- Exponential Moving Average: EMA 21 day (teal)
- Exponential Moving Average: EMA 200 day (sienna)
- ADX / +DMI/-DMI
- TC Trigger: this is my proprietary indicator and will be supplied to you.
- Template used in my TC system:
- The template will be supplied to you and is called: TC Trigger Template
- Once the template is loaded in your MT4 you will then need to load the TC Trigger indicator (supplied separately).
You will be provided with the following items via a separate email:
- A dll file
- This enables your MT4 program to communicate with the database that manages the TC Trigger indicator
- This is loaded in MT4 > File > Open Data Folder > MQL4 > Libraries.
- The TC Trigger Indicator
- This will need an access code
- This is loaded in MT4 > File > Open Data Folder > MQL4 > Indicators.
- A TC Trigger Template
- This is loaded in MT4 > File > Open Data Folder > Templates.
- An access code
- This access code is loaded into the ‘TC Trigger’ indicator when you open the indicator on your MT4 chart
- This access code can only be used on one machine by one user
- The TC Trigger can be placed onto on all charts within your single MT4 platform.
5. Trade Charting FX Signal: Entry Rules
LONG TC Signal
- Look for 3 EMA (blue) moving UP through 7 EMA (red)
- Look for the 3 EMA to be above both the 7 and 21 EMAs (3>7>21 is best BUT 3 must be on top)
- Look for an upward green arrow on the TC Trigger indicator
- Look for ADX to be on the incline
- All the above signals must align within a range of 5 candles from the first candle close above the 3 EMA
- Check that there is no current or impending major news announcement
- If all of the above criteria have been met: enter the trade
- Set STOP below the Ichimoku Cloud or at a pre-defined pip value
Examples
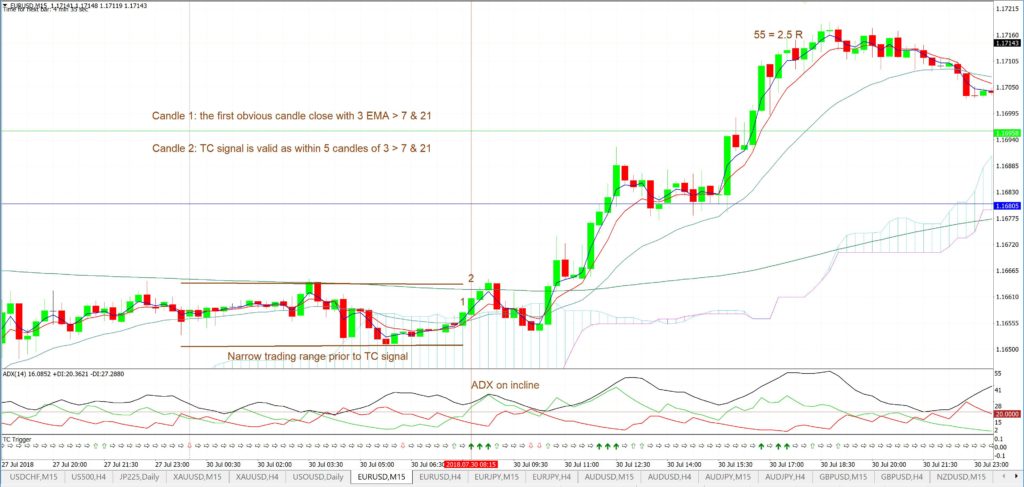
EUR/USD 15 min: a valid TC signal: note on the following chart how the TC signal triggered after price action had been trading within a quiet and sideways manner within a narrow range. The TC signal triggered on the second candle to make an close where the 3 EMA was clearly above the 7 and 21 EMAs. The required Stop was relatively small and so this was a valid TC signal:
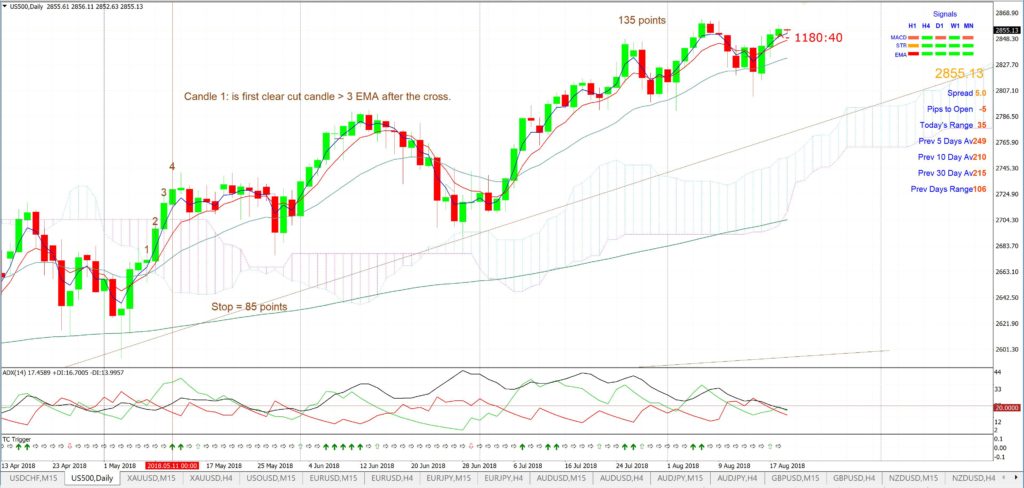
S&P500 daily: a valid TC signal: this is an example of a TC signal off a daily time frame chart. Note the candle numbering here. One could have started the candle count from the previous candle; traders just need to be consistent. This trade was off a daily chart and, thus, the required Stop is relatively large:
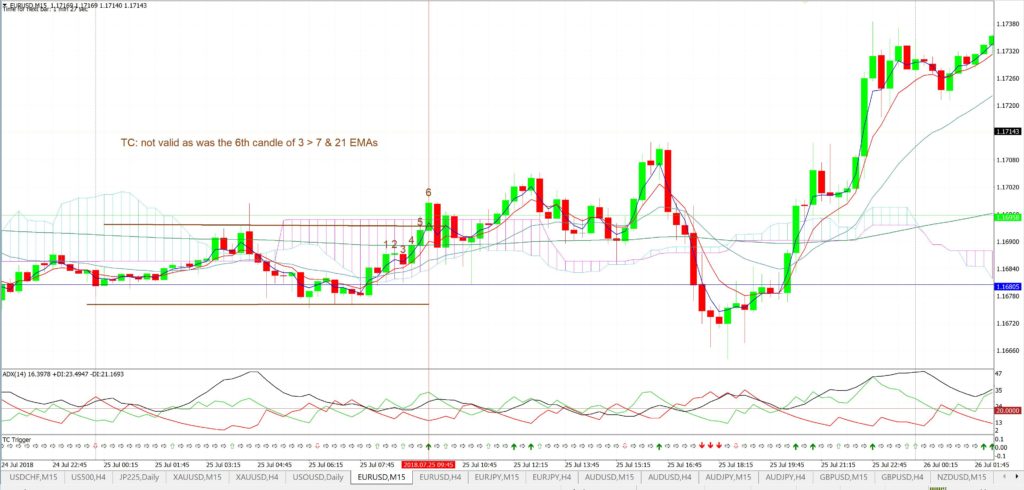
EUR/USD 15 min: a non-valid TC signal: the following TC signal is not valid. This is because the TC Triggered on the 6th candle after the first candle close where the 3 EMA was clearly above the 7 and 21 EMAs:
SHORT TC Signal
- Look for 3 EMA (blue) moving DOWN through 7 EMA (red)
- Look for the 3 EMA to be below both the 7 and 21 EMAs (3<7<21 is best BUT 3 must be on the bottom)
- Look for a downward red arrow on the TC Trigger indicator
- Look for ADX to be on the incline
- All the above signals must align within a range of 5 candles, or less, from the first candle close above the 3 EMA
- Check that there is no current or impending major news announcement
- If all of the above criteria have been met: enter the trade
- Set STOP below the Ichimoku Cloud or at a pre-defined pip value
Examples
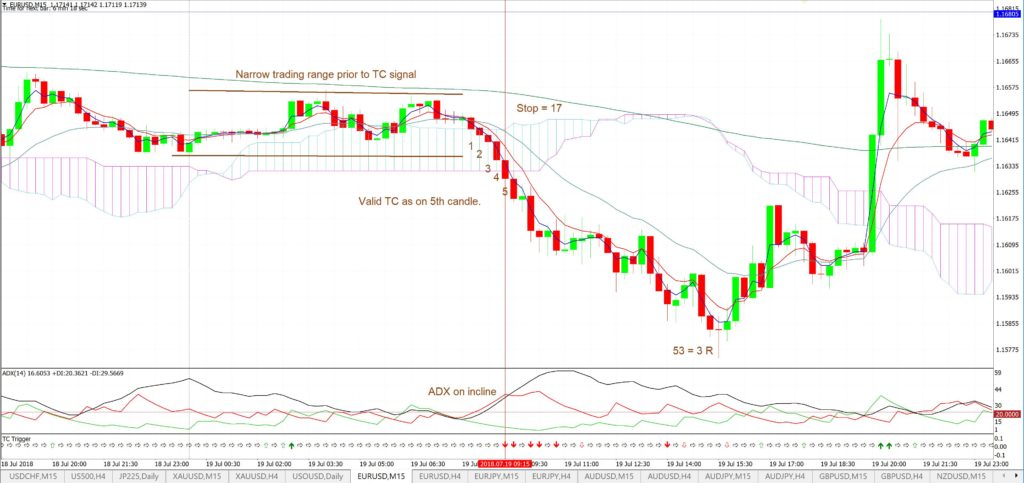
EUR/USD 15 min: a valid TC signal: This is an example of a valid SHORT TC signal. Prior price action was quiet and sideways and the TC triggered on the 5th candle following an obvious close where the 3EMA was clearly below the 7 and 21 EMAs. The ADX was on the incline.
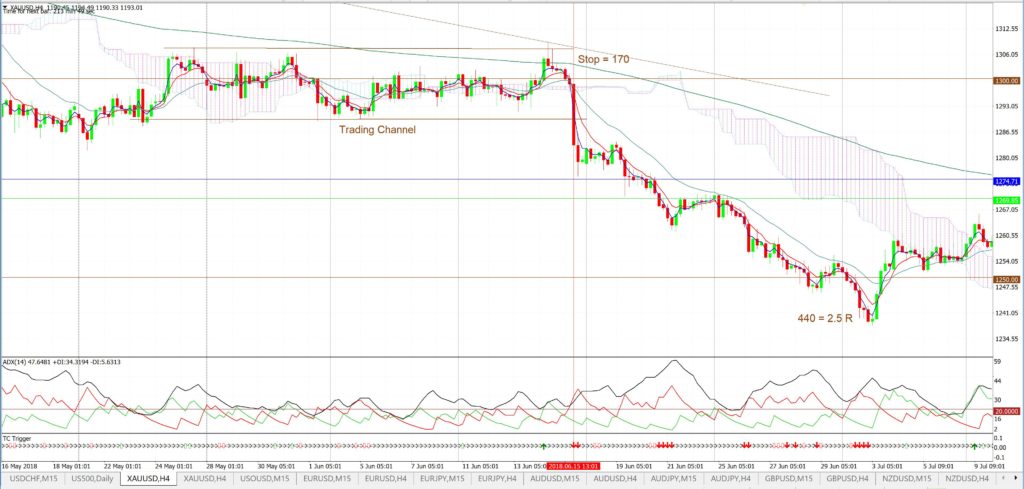
Gold 4hr: a valid TC signal: This TC signal evolved after a breakout from a trading range. However, note how the longer time frame trading requires larger initial Stops:
EUR/USD 15 min: a non-valid TC signal: this TC signal is not valid as the ADX is not on an incline:
6. ‘New’ vs ‘Continuation’ TC trade signals
TC signals can be classified into two types of trades: New or Continuation.
New TC signals
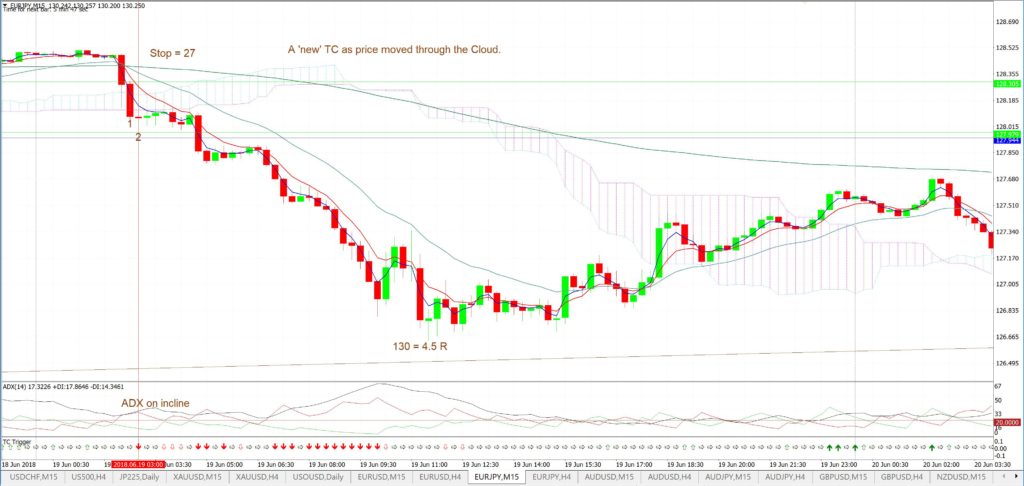
- This is where the TC signal (a 3, 7 & 21 EMA proximal crossover) forms after a NEW move through the Ichimoku Cloud. Note on this EUR/JPY 15 min chart below that a new SHORT TC signal formed after a move down through the Cloud.
Continuation TC signal
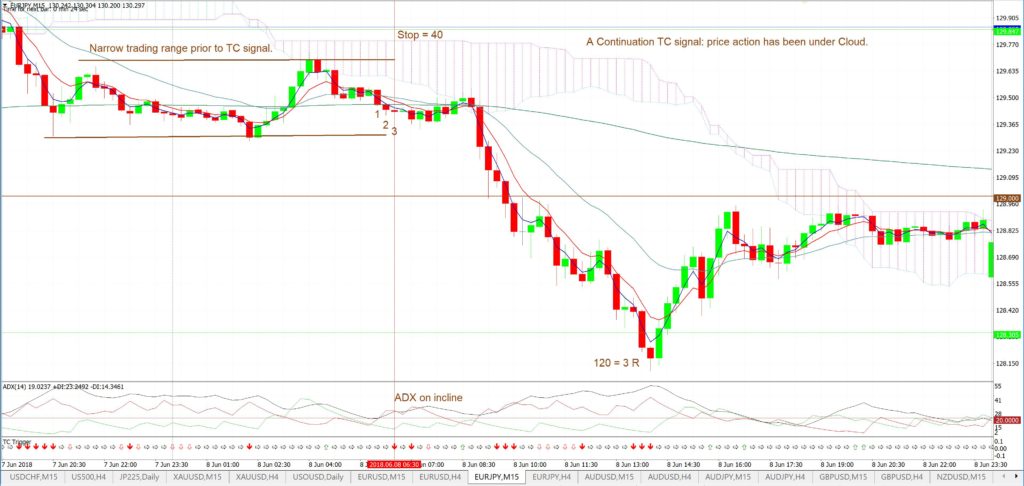
This is where a subsequent TC signal forms whilst price has held its position either above or below the Ichimoku Cloud. This can be in the form of either just a 3 & 7 EMA cross above or below the 21 EMA or a completely new 3, 7 & 21 EMA crossover. Note on this 15 minute chart of the EUR/JPY that the first valid TC signal is a Continuation TC signal.
7. Risk to Reward: A vital consideration for any new trade.
The concept of Risk to Reward is an important one when considering taking any trade and any new TC signal. Traders need to be aware of potential Support and Resistance levels for any instrument they are trading as these may impact the decision on whether to take a TC signal or not.
Risk to Reward has been covered in detail on my blog site and this can be found through the following link. Please read through this section before proceeding.
One important aspect to stress with my focus on TC trading since 2017 is the shift to lower time frame trading that helps to reduce the risk taken per trade. There are two important factors that make up this revised focus:
- Traders should never risk more than 2% or 3% of their trading capital per trade.
- TC Trading System focuses on looking for trades that trigger with small initial Stops. This is discussed in more detail in Section 8 below.
8. TC signals and the TC Trading system: choosing which signals to take.
There are many TC signals that may be noted triggering on charts but discretion needs to be applied to determine the highest probability trade set up from these signals. I refer to this method of discretion as my TC Trading System. This section contains advice about how to seek out the best TC signals.
8.1: Look for ‘Optimal TC signals’: TC signals with 4hr chart trend line breakouts:
One of the most successful applications I have been having with my TC indicator is as follows and is what I refer to as an ‘Optimal TC signal’. An Optimal TC signal is one that forms with:
- A New TC signal.
- A 4hr chart pattern trend line breakout: Traders need to study charts and note any consolidation pattern on the 4hr or higher time frame chart. I analyse charts over the weekend and revise technical patterns throughout the week.
- A breakout move from sideways prior price action, that is, out of a relatively quiet market.
- Then, watch for any new 15’ chart TC signal that evolves alongside / near any trend line breakout from this congestion pattern.
- Look for an initial Stop that is less than 40 pips: that is, the distance to other side of the Ichimoku Cloud or trend line is 40 pips or less. This is a very important factor when deciding upon which signal to take. I prefer signals where the Stop ise even much smaller; around 10-25 pips.
Example: USD/TRY
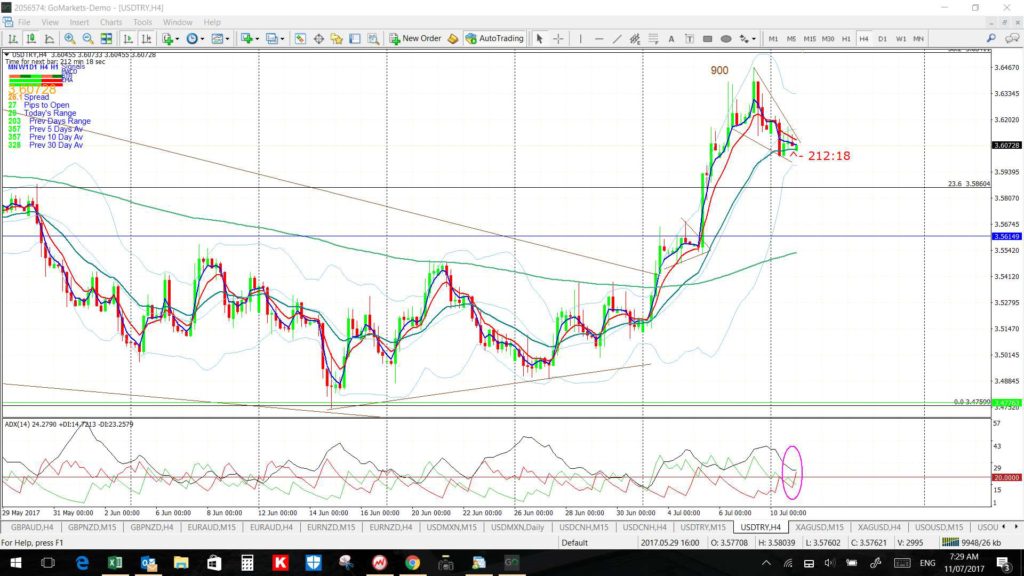
The USD/TRY had been forming up within a 4hr chart flag pattern during July 2017 as noted in the following post.
USD/TRY 4hr: There was a Bull Flag type pattern setting up on the USD/TRY as shown below. I would have expected traders to monitor these trend lines on the lower time frame 15 minute chart and to watch for any New TC signal that might form along with a tend line breakout. A ‘New’ TC signal is one that forms when price action moves through the Cloud and these types of signals generally offer the need for a smaller Stop and, thus, offer better Reward to Risk advantage:
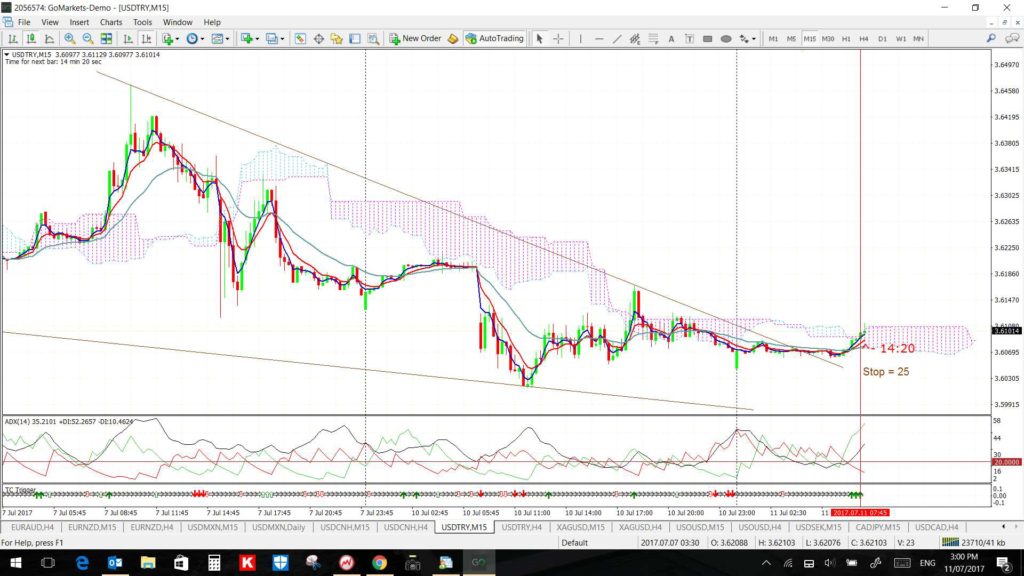
USD/TRY 15 min: Following the chart update in the blog article there was a subsequent trend line breakout that was closely followed by a NEW TC LONG signal. The required STOP for this trade was just 25 pips and this was an ideal set up or what I refer to as an OPTIMAL TC trade.
Recall that an OPTIMAL TC signal trade is one:
- that triggers with a NEW TC signal.
- where the TC signal evolves with a new 4hr chart-based trend line breakout.
- that emerges out of relatively quiet and sideways price action.
- that only needs a small initial STOP: less than 40 pips.
Note how this particular trade set up ticked ALL of those boxes!
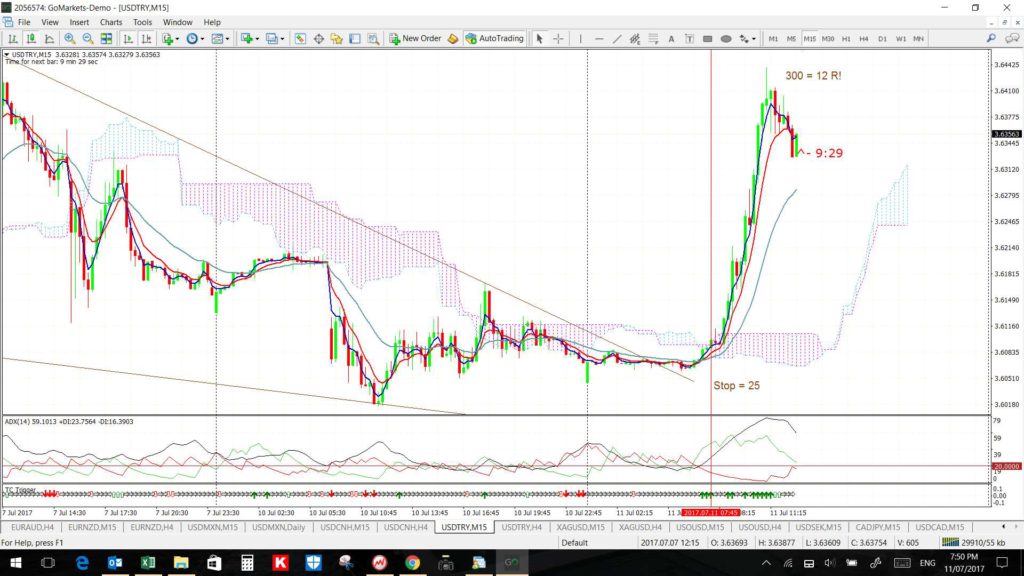
USD/TRY 15 min: this trade went on to give 300 pips for a 12 R trade. The value of R is calculated as the ratio of the REWARD for the amount of RISK taken. The REWARD on this trade was up to 300 pips and dividing this value by the Stop value of 25 pips gives an outcome of 12. That means the REWARD was 12 x the required RISK:
In summary, an OPTIMAL TC signal trade is one:
- that triggers with a NEW TC signal.
- where the TC signal evolves with a new 4hr chart-based trend line breakout.
- that emerges out of relatively quiet and sideways price action.
- that only needs a small initial STOP: less than 40 pips.
8.2: Look for breakout TC signals: a breakout from a recent congestion pattern.
Sometimes there can be a lengthy absence of 4hr chart trend line breakouts as price action often trades within a range or consolidates within a chart pattern for a lengthy period of time. This can be most frustrating! However, TC signals can sometimes trigger when price action breaks out from narrow trading ranges within these larger, 4hr chart patterns. An example of this type of TC signal is shown below.
Example 1:
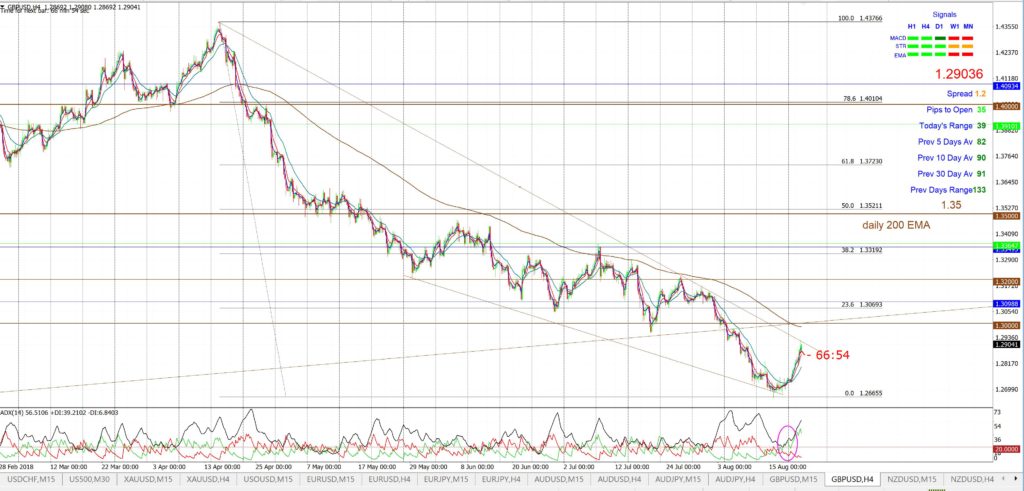
GBP/USD: Throughout April through to August 2018 the Cable was trading within a descending wedge pattern as shown below. Waiting for a 4hr chart trend line breakout here was a source of much frustration:
GBP/USD 4hr: the lengthy descending wedge pattern evolving over many months:
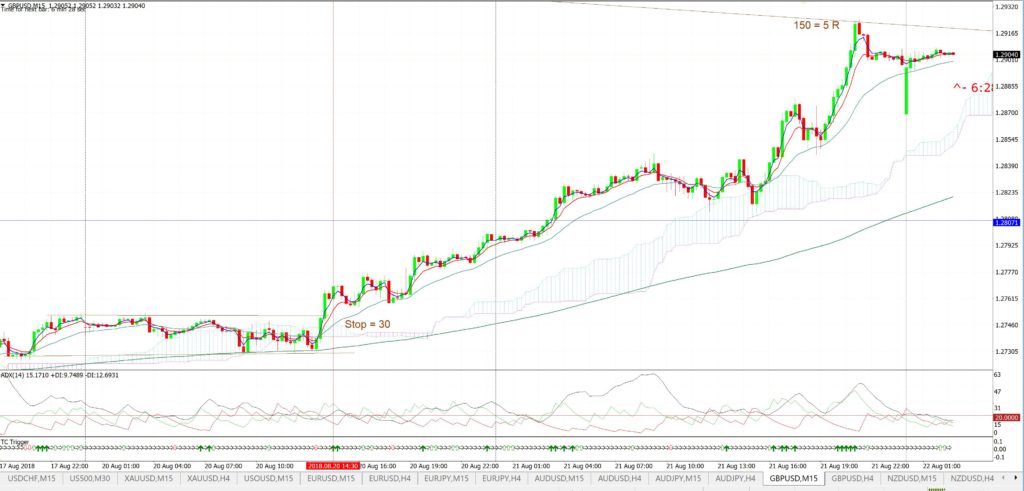
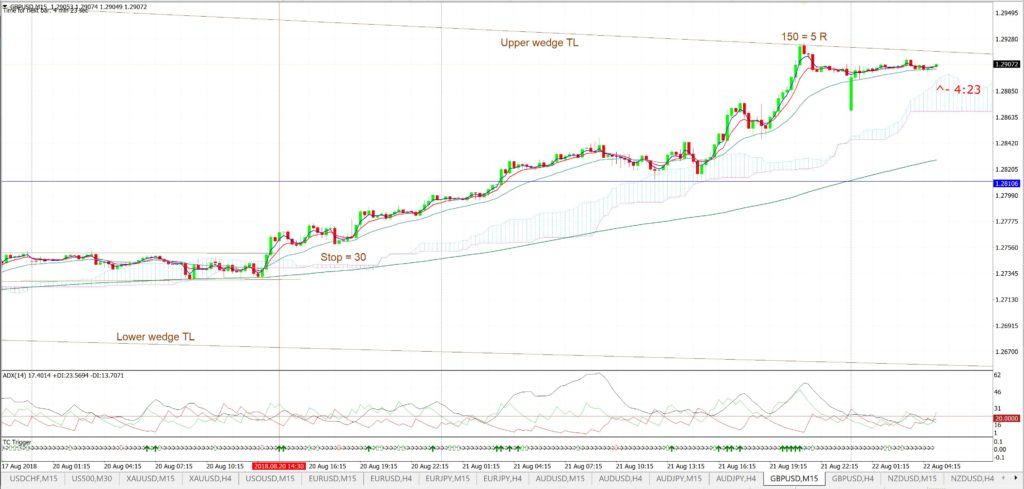
GBP/USD 15 min: However, within this ranging price action there were opportunities for low-risk TC signals to evolve. The two charts below show that as price traded down near the bottom of the descending wedge, it consolidated within a narrow sideways channel for a time before recovering to the upside. The eventual breakout to the upside came with a new TC signal with a Stop needed of just 30 pips and this went on to give 150 pips and 5R before stalling at the upper wedge trend line:
The 15 min chart condensed to show the upper and lower wedge trend lines:
Example 2:
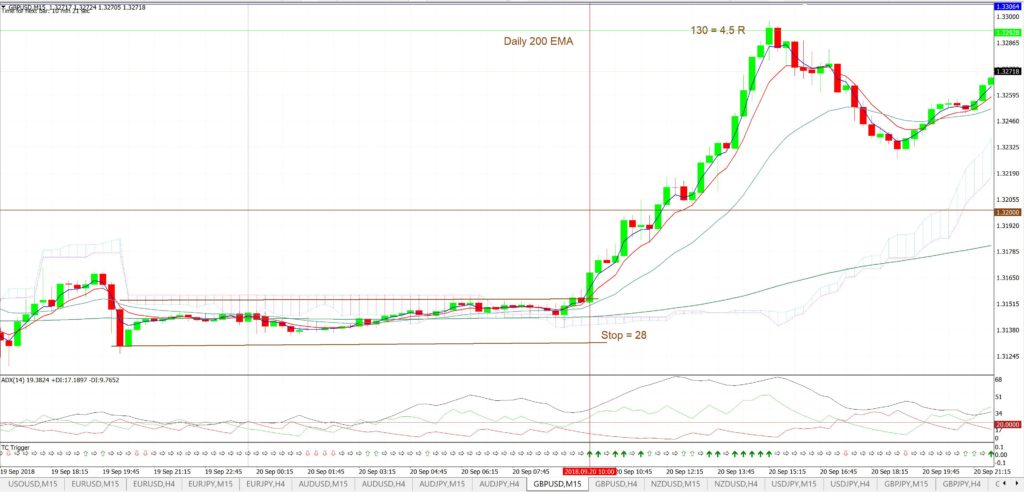
GBP/USD: this gave another great TC signal off the 15 min with another move higher following the descending wedge breakout. Price action stalled at the daily 200 EMA and this would have made an obvious ‘Take Profit’ target on the day::
Example 3:
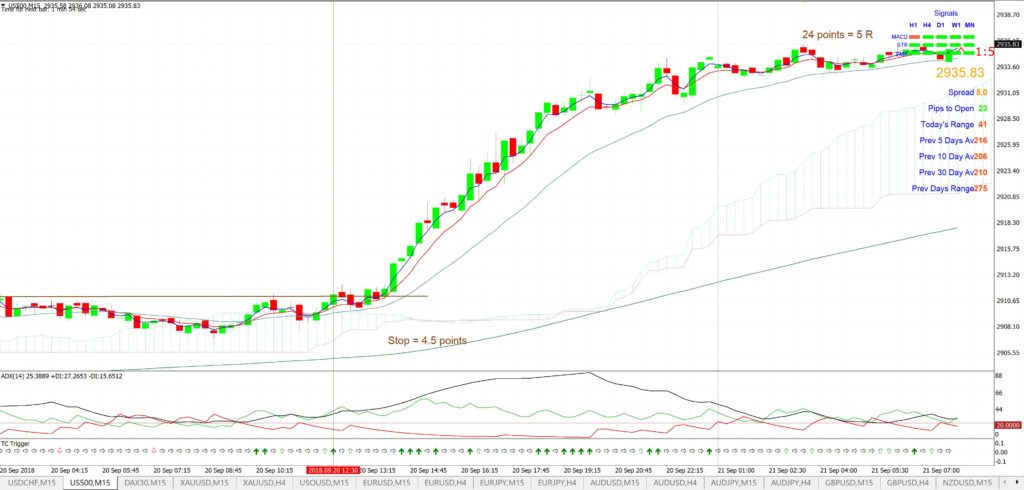
S&P500 15 min: note the great TC signal after a breakout from a narrow trading range. This gave 24 points for 5 R and, at the time of printing this chart, it was still going!
Example 4:
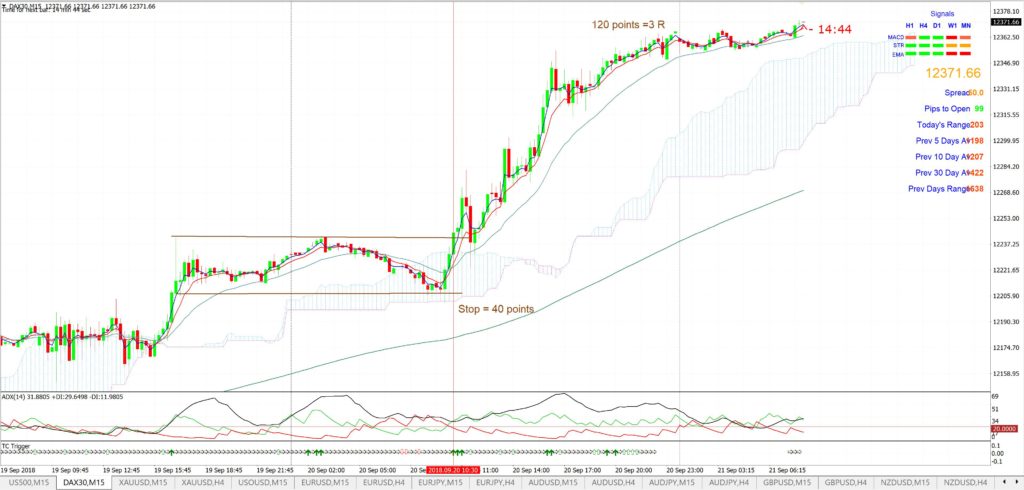
DAX-30 15 min: note the great TC signal after a breakout from a narrow trading range here too. This gave 120 points for 3 R and, like above, at the time of printing this chart it was still going!
Summary:
In summary, TC Traders are urged to look for either an OPTIMAL TC signal or a Range breakout TC signal:
An OPTIMAL TC signal trade is one:
- that triggers with a NEW TC signal.
- where the TC signal evolves with a new 4hr chart-based trend line breakout.
- that emerges out of relatively quiet and sideways price action.
- that only needs a small initial STOP: less than 40 pips.
An Range breakout TC signal trade is one:
- that triggers with a New or Continuation TC signal.
- where the TC signal evolves with a breakout from a narrow trading range.
- that emerges out of relatively quiet and sideways price action.
- that only needs a small initial STOP: less than 40 pips.
8.3: The best FX pairs to choose:
TC is a system that works best when the trader has developed a good understanding of the entity being traded. My Trial of TC during 2018 revealed that the best MT4 pairs for me to focus on where the EUR/USD, Gold, Oil and the stock indices. The following pairs required more discretion before trading: AUD/USD, NZD/USD and USD/JPY. I found the GBP/USD to be often rather erratic and thus I would only consider trading this pair if the TC set up was optimal and the risk very low.
Different FX traders will differ in their experience and may find other pairs more suitable to their trading. I simply mention the above pairs that I prefer.
Traders need to develop a watch list of their own preferred FX pairs that suit their trading, expertise and location.
8.4: Consider Momentum & time of day:
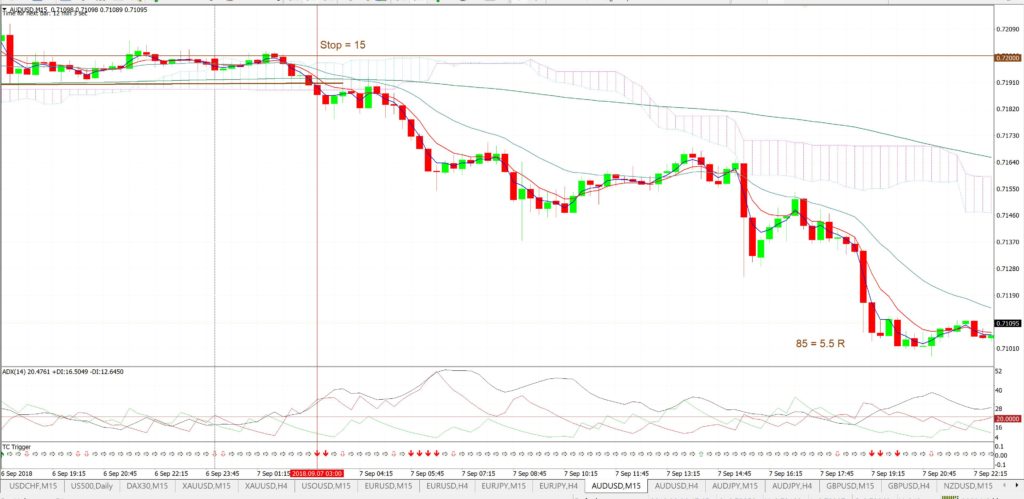
Trade Charting is a momentum based system and, thus, signals often perform better during the more heavily traded markets such as the European and, especially, the USA sessions. There can sometimes be decent trend line breakout moves during the Asian session but these are not as frequent as moves that trigger during the later sessions. However, at times, the Asian currencies, AUD, NZD and JPY can sometime offer decent Risk to Reward TC signals during the Asian session. An example of this is shown below with the Aussie on Friday 7th September 2018:
AUD/USD 15 min: This signal triggered during the Asian session on an NFP Friday. However, the small initial Stop of just 15 pips may have been deemed worth the risk given the break of range and the hold below major 0.72 support:
8.5. The 5 min chart:
There are some situations when dropping down to the 5 min chart is appropriate for the TC trading system.
- Exotics: Some of the more exotic Forex pairs work better in the US session off the even shorter 5 min chart time frame. USD-based exotics may be safest to trade in the US session.
- To reduce Stop size: Sometimes a TC signal will trigger on the 15 min chart but the required Stop is too large. Dropping down to the 5 min chart may offer a TC signal needing a lower Stop and may be appropriate. This may be best limited to the likes of Gold and Oil though, rather than usual Forex pairs. The following example shows Gold from September 2018 when a TC signal on the 5 min chart gave a better Risk to Reward outcome than the 15 min chart (click on charts a few times to enlarge).
- Gold 4hr: break of TL
- Gold 15 min: Stop too large
- Gold 5 min: better R/R
8.6. ATR:
Another very important factor to consider when considering a trade is the issue of the average daily trading range (ATR). If a currency pair has already moved by an amount near to, or equal or above, the average daily range (ATR) then any new TC signal should be considered with caution. This is because the next major move for such a currency pair may not take place until the next trading day.
8.7. Volatility:
Another consideration for trend traders when considering which pairs to focus on is Volatility. Better trends generally evolve out of sideways markets and so New TC signals are best considered under such consideration. Some currency pairs go through periods of greater volatility and they are often best avoided as these times. Volatility can be recognised by the presence of multiple larger candles, candles with long upper and lower shadows and by widening Bollinger bands (if used). In a situation where two TC signals have formed, but one was on pair coming out of a low volatility sideways market versus another with high volatility, I would prefer to take the former.
9. Examples of Trade Charting TC signals
There are many more examples posted in these two pages and the images are more easily magnified for closer inspection: TC Trigger and TC Trigger + TL: Some Lessons
10. Currency Strength Indicator (CSI): Narrowing the Trading Universe.
One of the most challenging issues I find is filtering which currency pairs to watch at any given time given pairs can sometimes trade in narrow ranges, making for fewer trading opportunities and then at other times offer great trading potential. A Currency Strength Indicator (CSI) may be of use to traders when trying to determine which particular FX pairs to focus on in any given week. A tool that helps you to identify which currencies are diverging from each other may help you to narrow the FX pairs in your analysis.
11. Summary Checklist for TC Trading System:
Putting all the above information together leads to what I refer to as an ‘Optimal’ TC signal for the TC Trading system. An ‘Optimal’ TC signal within the TC Trading System is one that triggers with the following features:
- A New TC Signal: A ‘New’ TC signal is always preferable to ‘Continuation’ TC signal as the former helps to improve the Risk to Reward ratio.
- Trend line breakout: the best TC trade outcomes usually result when a TC signal triggers with a 4hr chart-derived trend line breakout.
- Quiet Markets: the best TC trade outcomes usually result when a signal triggers out of relatively quiet sideways market action. Look for smaller candles and ones with few long upper or lower shadows (aka spikes).
- With only a small Stop required: ‘Small’ is a relative term but look for Stops of less than 40 pips or so.
- ATR: Prior to large daily move. If the ATR for that particular trading day has already been achieved on a currency pair then the probability for any TC signal is greatly diminished so discretion is needed in such circumstances.
- TC Signals within technical patterns: If taking a TC signal WITHIN a technical pattern make sure there is sufficient scope for movement based of Risk to Reward potential.
- Exotics: If trading USD based exotics check to see whether these are best traded during the US trading session. EUR based exotics may be best traded in the European session.
- Trading Calendar: remember to check your trading Calendar and avoid trading signals in the lead up to significant news events.
- TC pair selection: consider using a Currency Strength Indicator (CSI) to help select currency pairs to monitor for trend trading potential.
- London Open: my observation and TC Trial feedback to me is that the ‘London Open’ can be a period of fake outs so this is a period to exercise more caution.
12. Trade Charting Trade Exit criteria: Take Profit levels and Stops
It is vitally important to know where you are going to get out of a trade; as much as knowing where you will get in! There are numerous methods that you can use to determine when to Exit a trade and much of this will depend on a traders personal risk appetite and the type of trader they are as well as the time frame chart they are trading from. Short-term traders may set a small top; as they are closely monitoring the trade. Traders will need to experiment with a trade exit strategy that best suits their risk tolerance, trading rules, trading time frame and trading style.
Take Profit Target Examples
- Preference: at a multiple of the Stop: for example, if the Stop is 20 pips then set Profit Target at 3 times the Stop = 60 pips. Assuming this amount of movement falls within the available trading range left for that day.
- When the ADX tips downwards to have a negative gradient
- When price crosses back over the 21 EMA
- At previous support / resistance levels
- At whole number or psychological number levels
- At a significant Fibonacci level
- At a pre-determined pip level. e.g. 50 pips
Stop Loss Examples
- When price closes back on the other side of the Ichimoku Cloud. This is more appropriate for New TC Signals as they generally form up not too far removed from the Cloud.
- A ‘Hard stop’: at a pre-determined pip level.
- When a new and opposite TC signal is received
- A ‘Trailing Stop’: at a pre-determined pip level.
13. Suggested Guidelines for Trade Charting trend trading
- Check the overall trend on the USDX & EURX indices first:
- Long USDX= Long USA
- Long EURX= Long EUR
- Check whether the FX Indices are aligned. You can read more about FX Index alignment and implications for trading here:
- FX Index Alignment: supports TC trend trading off all time frames.
- FX Index Divergence: supports TC trend trading off shorter time frames during the European and US sessions.
- Trading off shorter time frame charts: TC signals received during the Asian session are often less reliable that those received during the higher volume and higher momentum European and US trading sessions. Thus, where possible, look for trend line breakout and new TC signal combinations during these sessions.
- Trade with the dominant trend. This is when trading off 4hr charts or higher.
- Risk per trade: Use between 2 and 5% risk per trade.
- Check for economic announcements etc. on an FX calendar before placing trades.
- Don’t trade over major news items e.g. FOMC, NFP.
- Avoid trading the afternoon US session on a Friday (optional).
- Avoid trading before London Open on a Monday.
- Manage your % risk with correlated pairs.
- Check for correlation between the pairs via http://www.forexticket.co.uk/en/tools/01-01-correlation
- Plan the trade and trade the plan.
- Keep accurate records / log / screenshots of each trade.
14. Determining the overall market trend: Using Indices
Using the USD and EUR indices to help track the direction of the pairs
Part of the TC Trading System trading regime at the beginning of each week, and of each day, is to assess and monitor the 2 major indices, the USD dollar index (USDX) and the Euro dollar index (EURX). This is useful to help with determining the possible trend directions on the major FX pairs. For example, if the USDX is trending up then traders should look towards a bias of LONG on the USD and SHORT on the currencies that make up this index. Similarly, if the EURX is trading up then look to go LONG on the Euro against pairs that make up this index.
Description of the components of the USDX and the EURX
The US Dollar Index (USDX) is a measure of the value of the US dollar compared a basket of foreign currencies. It is a weighted mean of the USD value compared to:
EUR, 58.6%, JPY 12.6%, GBP, 11.9%, CAD, 9.1%, SEK, 4.2% and CHF 3.6% weight
The Euro dollar Index (EURX) is a measure of the value of the Euro compared a basket of foreign currencies. It is a weighted mean of the EUR value compared to:
USD, 31.5%, JPY 18.9%, GBP, 30.5%, SEK, 7.9% and CHF 11.2% weight
An example of how to use the indices to help track trade direction on currency pairs is given below along with charts. Note: The vertical dotted lines on the chart separate each month.
A look at the daily chart for the GBP/USD below shows that this pair was pretty choppy with no real clear direction throughout July and August. A look at the USDX chart for this same period shows that it was also fairly choppy. The USDX had been trading during this time within a symmetrical triangle and you can see that the USDX did eventually break out, in an upwards direction, at the beginning of September. The ADX indicator (bottom of chart) supported the momentum move on the USD trend as being Long (or, moving upwards) from the beginning of September. This observation would then give a trader more confidence with tracking the direction of US currency pairs. Thus, looking to the GBP/USD chart for the start of September you can see that the new trend for this pair was down, that is, SHORT for the GBP (and long on the USD) and this trend was in sympathy with the observations made from the USDX chart. That is, the bias was to look to go LONG on the USD, relative to other currencies.
In summary, if the USDX is trending up, look for confirmation to trade LONG on the USD, relative to other currencies. If the USDX is trending down, then look for confirmation to trade SHORT on the USD. The same theory applies to the Euro dollar index, EURX, in confirming EUR pair direction.
15. Risk Management and Correlation of trading pairs
Traders need to have an understanding of the correlation between the different Forex pairs to be able to adhere to their risk management regime. Some Forex pairs move in tandem, that is, in the same direction during trending moves. This means that trading one such pair is essentially the same as trading that other pair. For example, the AUD/USD pair often moves in the same direction as the EUR/USD. Thus, they are essentially the same trade and so you need to adjust and manage your risk on these trades accordingly.
There is a web site that you can search for the most recent values of correlation between the Forex pairs. This site is: http://www.forexticket.co.uk/en/tools/01-01-correlation
Essentially though, the following groups represent Forex pairs that are often + correlated:
- Gp 1: USD/JPY EUR/JPY
- Gp 2: EUR/USD GBP/USD AUD/USD AUD/JPY
- Gp 3: USD/CHF USD/CAD
The following pairs are often inversely or – correlated:
- Gp 4: USD/CAD & NZD/USD
- Gp 5: EUR/USD & USD/CHF
For example, this means that the AUD/USD and AUD/JPY essentially move in the same direction. Thus, if your risk per trade was 2 % and you wanted to trade both of these pairs you would need to ensure that you only risked 1 % on each pair; which will total 2 % risk per trade for that particular trade direction.
Similarly, the inverse correlation means that a long trade on the EUR/USD is essentially the same trade as a short trade on the USD/CHF. Thus, if your risk per trade was 2 % and you wanted to trade both of these pairs you would need to ensure that you only risked 1 % on each pair; which will total 2 % risk per trade for that particular trade direction.
16. My Trading Regime: Using the TC Trading System to trade Forex
A: Weekend analysis: carried out prior to trading week
- Check trading calendar: note any Red Flag news that affects the pairs traded
- Check various news sites to assess most recent market sentiment (bearish/bullish)
- Check MT4 charts for the current trend on the USDX and EURX indices
- Check MT4 FX charts: Check through each of the currency pairs traded, in a similar way as with the Indices
B: Daily regime: starting each morning
- Check news sites for overnight events. (CNBC /FXLive /Reuters /Bloomberg)
- Open platform and check on the indices: EURX and USDX
- Scroll through pairs and assess whether any signals look like they are setting up
- Continue to check charts for New and/or Continuation TC signals.
17. Check list: putting it all together:
Traders may find the following checklist useful to assess the worthiness of any new TC signal:
| Item | TC Check list | Yes or No |
| 1 | TC Trigger gives a signal? | |
| 2 | TC triggers on breakout from 4hr pattern or a narrow trading range? | |
| 3 | Did TC Trigger within 5 candles of a 3/7/21 EMA cross? | |
| 4 | ADX: sloping upwards? | |
| 5 | Stop < 40: Distance from signal candle to the other side of Ichimoku Cloud or key S/R level <40 pips? | |
| 6 | No impending News or Announcements? | |
| 7 | Trade not correlated with other open trades? | |
| 8 | ATR check: the ATR range left for session is sufficient to allow Profit target to be achieved? | |
| 9 | Did signal trigger in the European or US trading session? Asian session generally has lower reliability. Exceptions sometimes for Gold, Oil, AUD, NZD or JPY pairs if news triggers movement. | |
| Tally | Tally is 9 for YES: then take the trade with max 2% of capital at Risk. |


