This article is a reminder lesson for TC traders when the US$ is choppy and keeping many Forex pairs range-bound. Two examples of US$ choppiness are profiled with suggestion for where potential trades might have been able to be found. The first deals with a great TC signal of the GBP/JPY and the second off the NZD/JPY.
Example 1: October 26 2018.
This example was posted in an update on October 26th 2018 and the original article can be found through this link. The US$ had been chopping back and forth near some major resistance levels around this time and this had kept a number of the Forex pairs that I usually focus on quite choppy. I’ve previously mentioned that the Forex Cross pairs render greater attention at such times and recent movement on GBP/JPY underscores that warning. I just need to follow my own advice!
Regular followers of my blog updates will be aware that I used to cover a larger number of Forex pairs including the EUR/AUD, EUR/NZD, GBP/AUD and GBP/NZD as just some. I found that charting such a large number of Forex pairs was too time consuming though and so culled the number of pairs on my watch list. In fact, there are some traders that only monitor one or two pairs and I currently monitor nine pairs as well as Gold, Oil and a number of Stock Indices! There is only so much that one head, one pair of eyes and a small brain can do! I have always thought that the ideal arrangement would be to have a small team working together where each member focuses on charting a few pairs but the broader wisdom and insight is shared among the group.
I bring this all up because my focus on US$ pairs of late, with the EUR/USD, Aussie, Gold and Kiwi, meant that I missed a decent move on one of the Cross Pairs that is still on my watch list; the GBP/JPY. This pair is not usually one that I prefer though as the Stop size for moves is generally too large for my liking. However, there was a decent move over the last two days that I missed which was a great short term trade requiring a relatively small Stop.
The point of this article is to remind traders, including myself, that perhaps it is wise to have at least a short list of Cross Pairs that you give greater attention to when the US$ is range bound keeping USD-based Forex pairs rather choppy. The charts below are testimony to this warning.
US$ index: the trend for the week has been up but price action has been choppy as it navigated near whole-number resistance from the 96 level, the monthly chart’s bear trend line and the 96.50 S/R level. Price is now heading to 97 which is a whole-number and a recent High so might have some ‘Double Top’ resistance (click on charts to enlarge the view):
- 4hr: is this a bullish Inv H&S?
- Daily: watch for any Double Top.
- Weekly: A break of the bear TL is bullish.
USD-based Forex pairs: these USD-based Forex pairs have been choppy over recent sessions and, as a result, have not offered set ups for decent trend trading:
- Gold 4hr
- AUD/USD 4hr
- NZD/USD 4hr
- USD/JPY 4hr
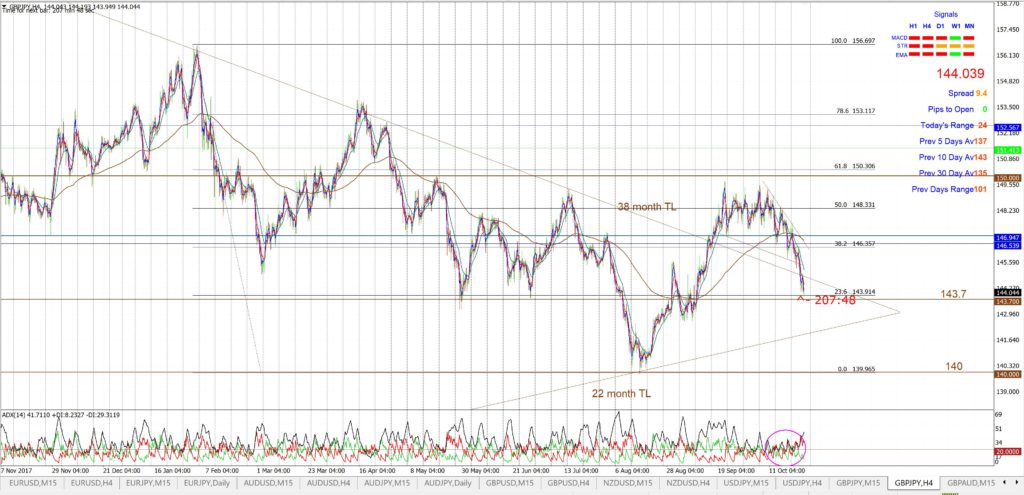
GBP/JPY: The GBP/JPY moved lower this week and broke down from a Flag pattern to head back to test the 143.7 S/R level:
GBP/JPY 4hr: price has been drawn back to 143.7 S/R. Watch this region for any new make or break activity:
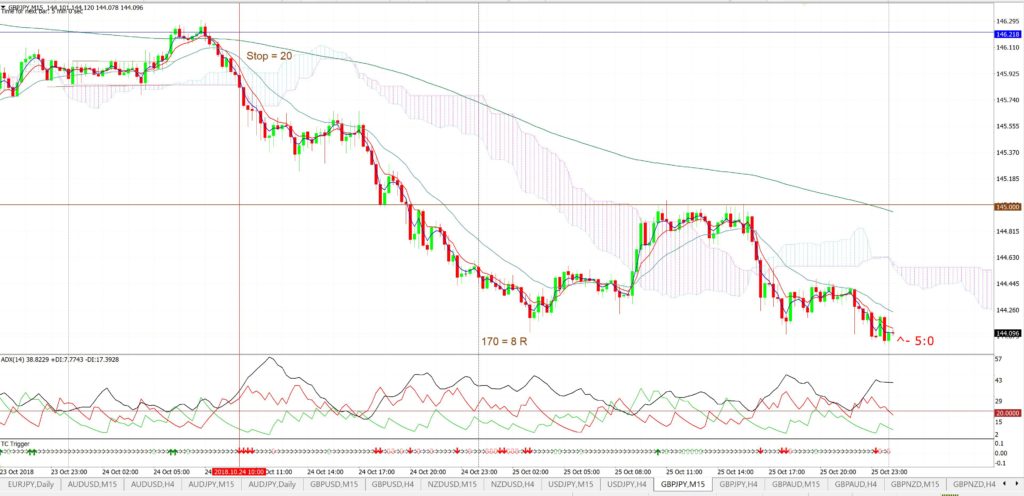
GBP/JPY 15 min: This weakness resulted in a range breakout TC signal triggering on Wednesday but that I missed picking up. The first valid TC signal needed only a 20 pips Stop and this is relatively small for this currency pair. The maximum move generated a result of 170 pips for 8 R:
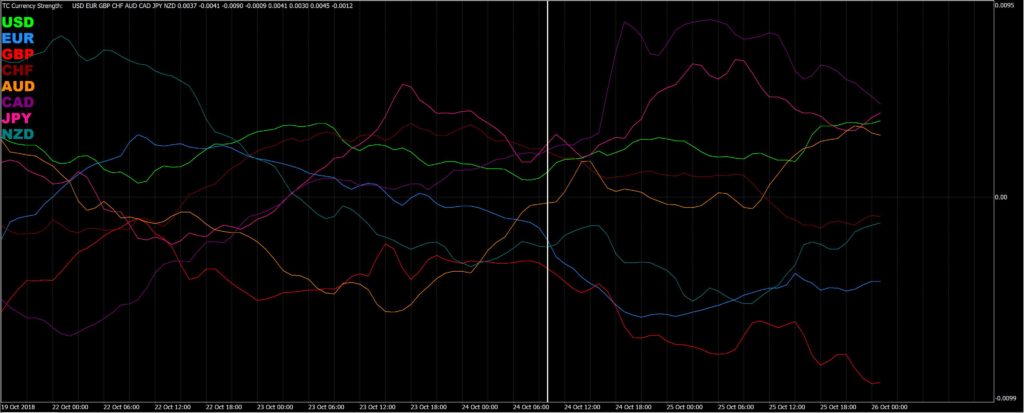
TC Currency Strength Indicator: The 60 min chart of the Currency Strength Indicator shows that the TC signal triggered after there was obvious divergence between the GBP and JPY; the TC signal is marked with a vertical white line. A reference to this chart should have supported faith in the TC signal.
Example 1 Summary: There are particular times when USD-based Forex pairs trend well and times when they are choppy. During periods when the USD-based Forex pairs are choppy traders should pay greater attention to a select number of Cross pairs to check whether any low-risk trend trading set ups evolve that can be harnessed. Reference to a Currency Strength Indicator can help to gauge any divergence between the components of a currency pair.
Example 2: October 30th 2018.
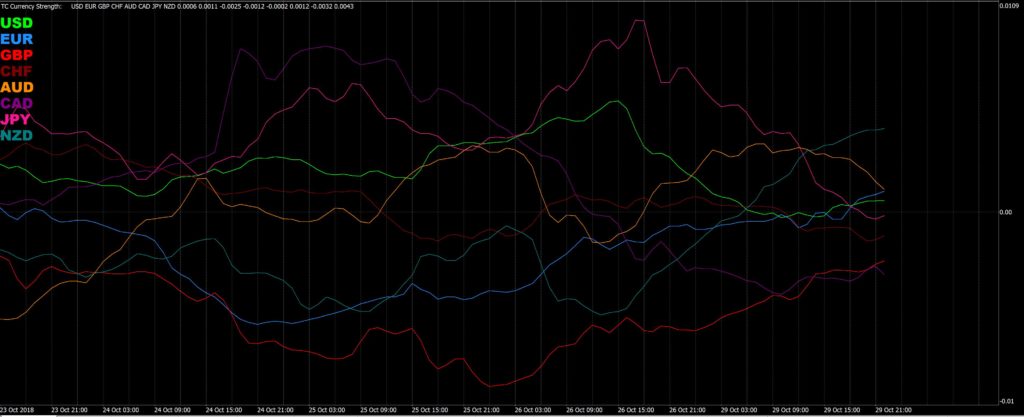
The US$ was continuing to be choppy and I noted as much in my post that can be found through this link. In this article I drew attention to the TC Currency Strength Indicator and note how this chart revealed divergence between the NZD and JPY and that perhaps that would be a good Forex pair to monitor on the day. I also Tweeted about this observation and the link to that tweet is here.
TC Currency Strength Indicator 60 min: this is the chart I posted on that morning and, if you click on the chart to enlarge, you will notice the obvious divergence between the NZD and JPY.
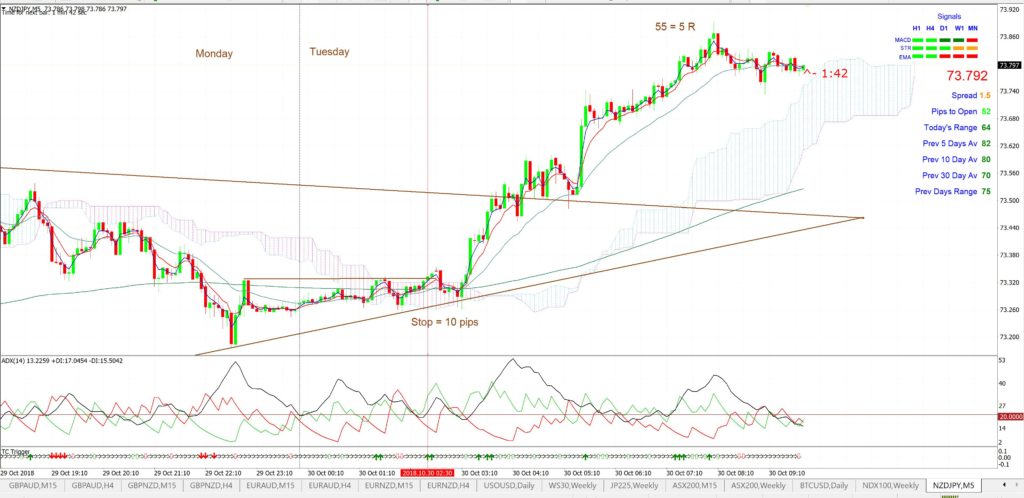
NZD/JPY 5 min: This is a chart of the NZD/JPY from later in the afternoon following my morning post. The NZD/JPY gave a great low-risk TC signal off the 5 min chart following a range-breakout. This signal went on to deliver 55 pips for a 5 R return on risk or a 500% return on risk.
Example 2 Summary: When traders are struggling to find decent trend across the Forex majors it might pay to check a Currency Strength Indicator to find any divergence that might exist across currency pairs. Traders then need to check for low-risk momentum trade set ups that might evolve.


