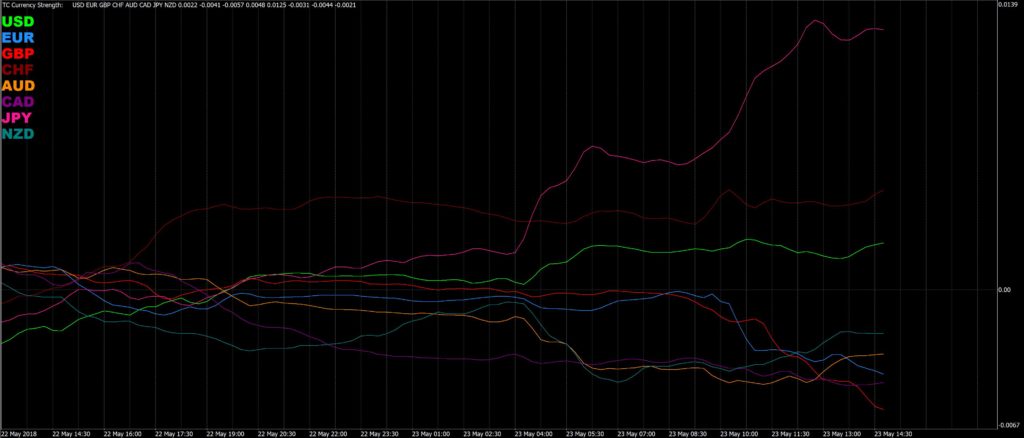
The latest tool in my shed is the TC Currency Strength Indicator. I’m hoping this will give a bit of a visual ‘heads up’ about which currencies are opposed for their strength /weakness and, thus, about which Forex pairs on which to focus. The potential advantage for such an indicator came recently when I noticed the opposing relative strengths of the GBP£ versus the AUD$ and this had led to a great trading opportunity on the GBP/AUD. I decided to get an relative strength indicator coded for Trade Charting and this is know as the TC Currency Strength Indicator.
The chart of the TC Currency Strength Indicator below shows that as of the evening of Wednesday 23rd May that the JPY¥ was strong and the GBP£ was relatively weak:
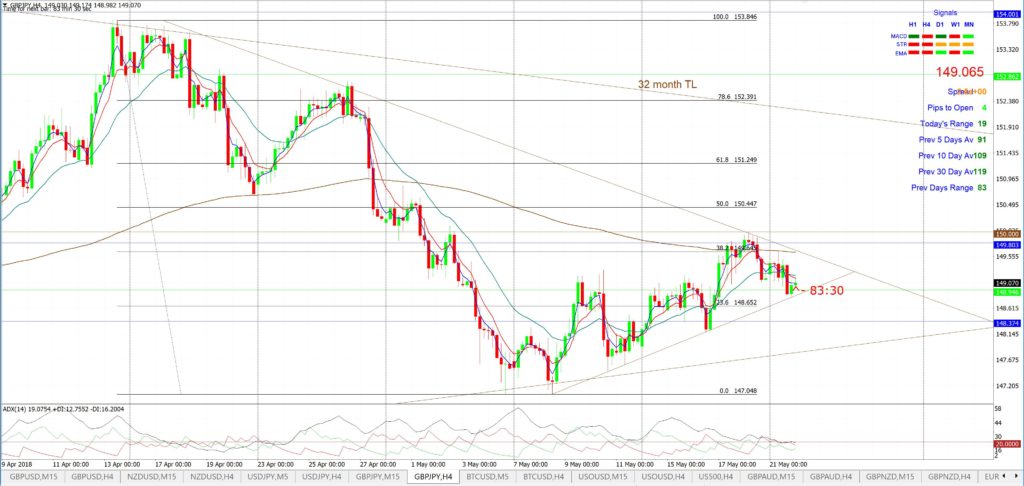
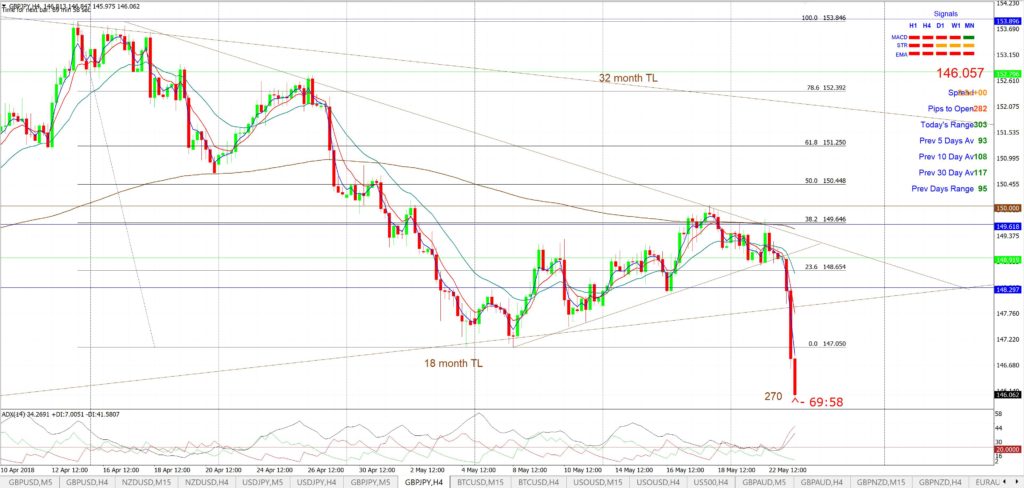
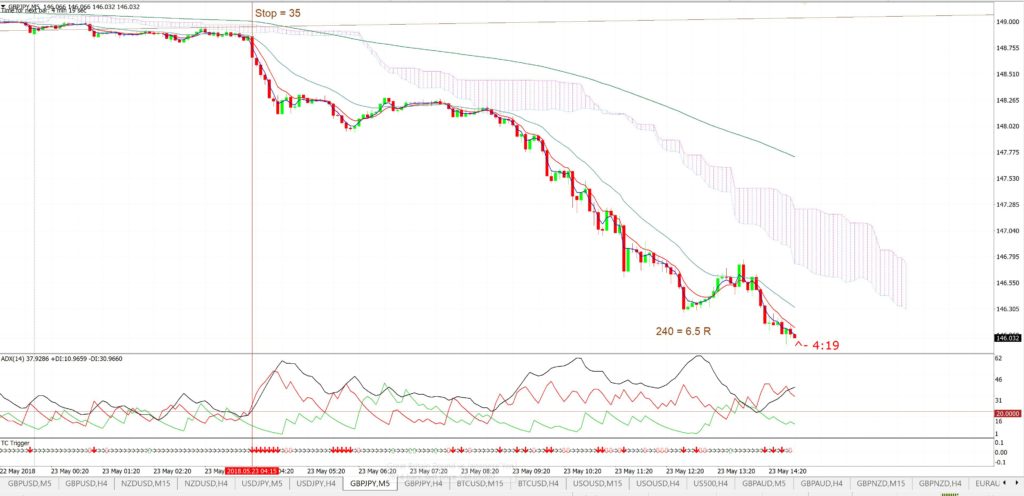
The charts of the GBP/JPY for Monday May 23rd confirm this divergence in strength:
GBP/JPY 4hr: this was the GBP/JPY on the morning before the divergence and any breakout:
This is the 4hr chart on the evening showing a breakout for 270 pips:
GBP/JPY 5 min: there was a new TC signal with this breakout that has given 240 pips for 6.5 R:
Summary: The example above shows how the Currency Strength Indicator confirms the opposing strength of the GBP and JPY currencies. The hope is that this TC Currency Strength tool might help in future to focus concentration on those currencies that are starting to diverge and, thereby, enable traders to better focus on the Forex pairs likely to give the best breakout trading opportunity.


