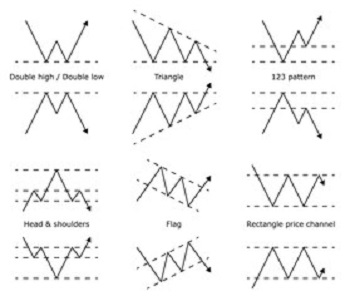
My charting analysis always includes looking out for particular technical patterns that may be setting up on either Forex pairs, stocks, ETFS and indices.
TC signals that occur with technical pattern breakouts are always preferred as this gives added support to the signal.
There are many different types of technical charting patterns and some of these, with hyperlinks to further information, include:
- Descending Wedge
- Symmetrical triangles.
- Ascending triangles.
- Descending broadening wedge.
- Ascending wedge.
- Head and Shoulder pattern.
- Inverse Head and Shoulder pattern.
Some of the successful technical trade set up across Forex pairs are discussed on subsequent pages within this drop down menu. The technical pattern that I find to be most successful is that of the descending wedge and links to examples of these breakouts can be found here and here.


