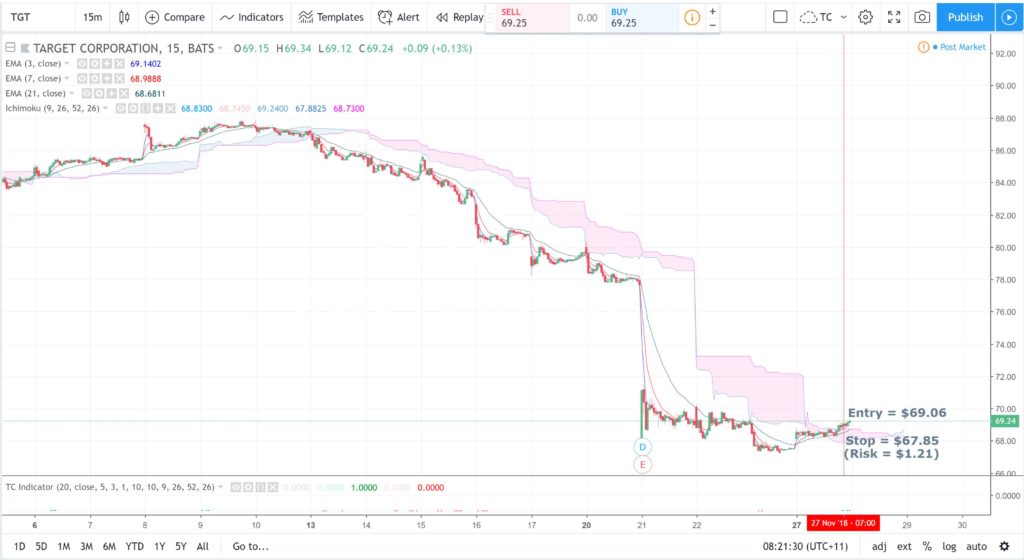
Target (TGT) peaked at $90 back in September 2018 but has fallen sharply since then and the last time Target was above the 15 min Ichimoku Cloud was back on November 9th, some two weeks ago. Since then, price has fallen from the $88 region down to near $67, a drop of around $21. Price action broke back above the 15 min Cloud during trading on Monday 26th November though and this move triggered a new TC LONG signal. The application of TC to stocks is relatively new so I’ll be watching to see how this signal on Target fares.
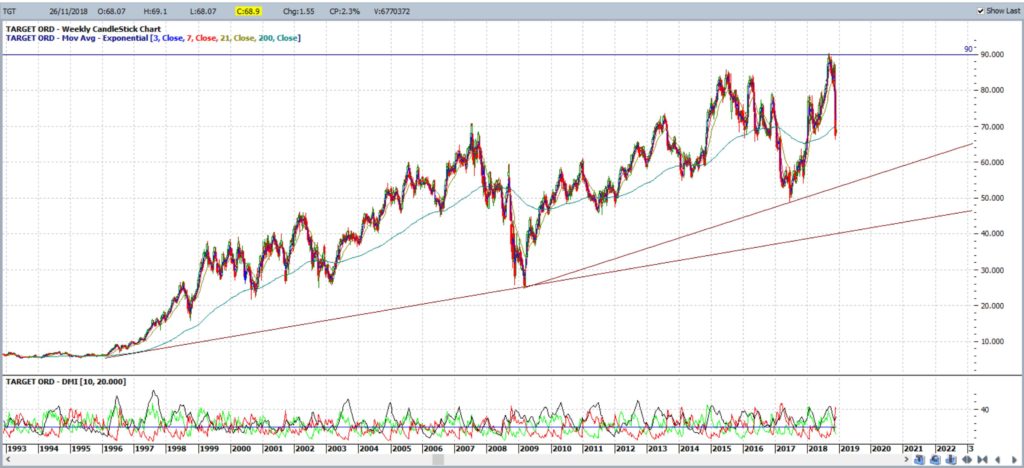
TGT weekly: Price action has been in an uptrend since the late 1990s and peaked at $90 in September 2018. There has been a sharp pullback since then though, however, longer-term support trend lines remain intact for the time being:
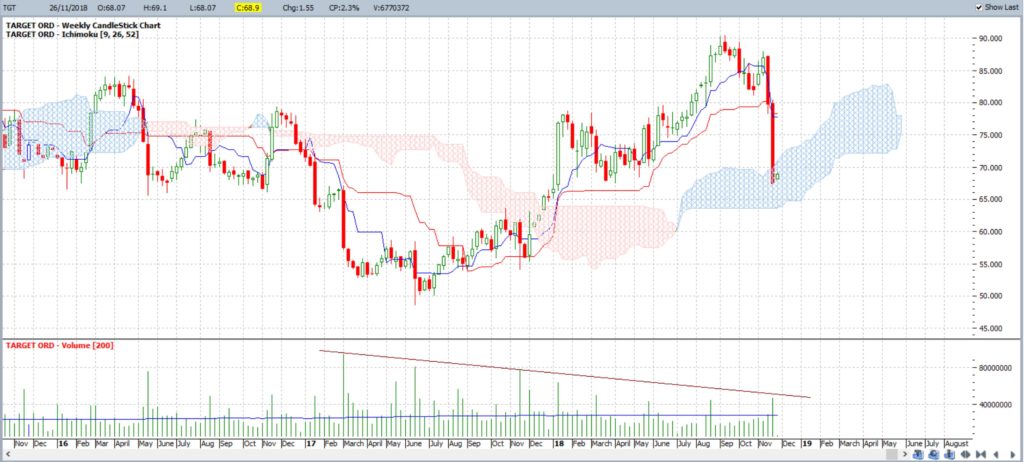
TGT weekly Cloud: price action remains above the support of the weekly Ichimoku Cloud for now but note the most recent two large bearish weekly candles:
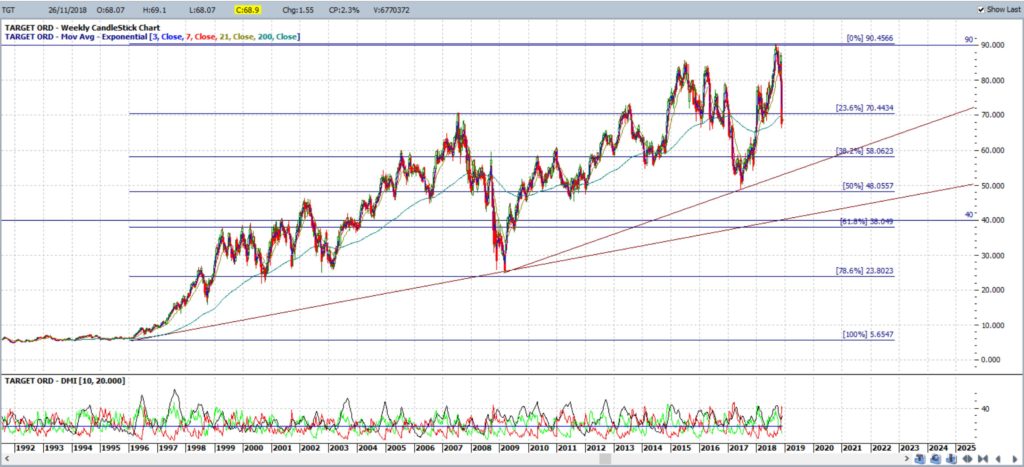
TGT weekly retracement: this has been a long swing High move on Target and, yes, it’s been made up of a few smaller swing High moves. The longer-term move though has a 61.8% retracement level down near $40 so, IMHO, that would be the worst case scenario pullback region to monitor:
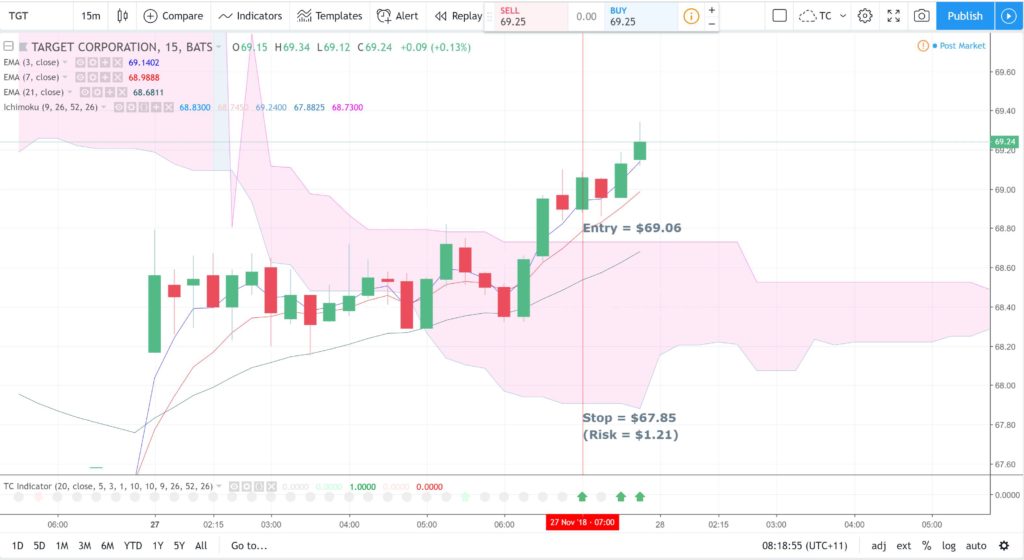
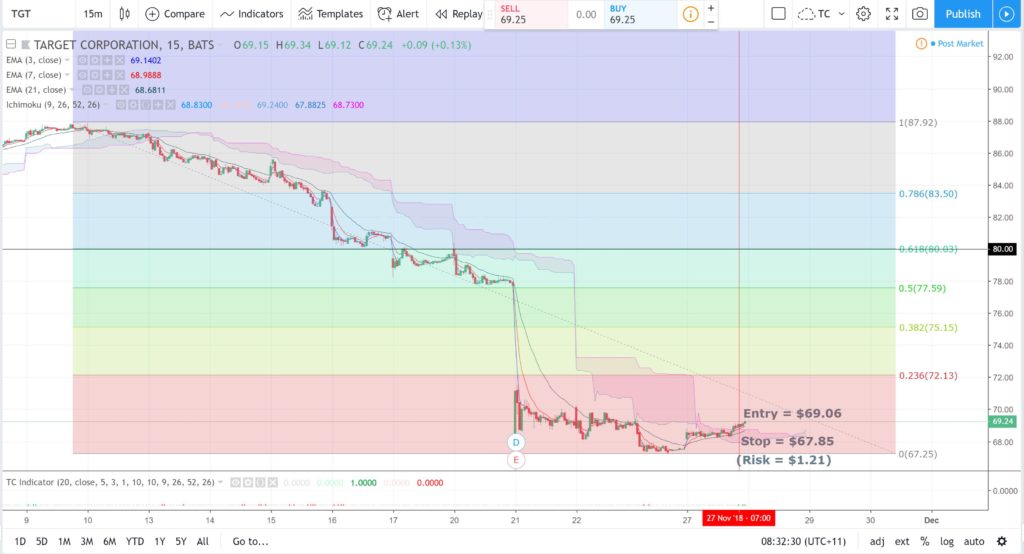
TGT 15 min: there was a new TC signal here during Monday’s trading session. This triggered after the close of the candle at $69.06. The Stop would need to be placed below the Cloud and this would be at $67.85 for a total Risk of $1.21:
TGT 15 min: the last time price action was above the 15 min Cloud was back on November 9th. Thus, there is potential for some relief rally ,even if the overall trend continues lower:
TGT 15 min: The 61.8% fib retracement of this latest swing Low move is up near $80 S/R and so that would be the target (no pun intended) for any continued recovery move or relief rally. Any peak at $80 would mean a price gain of $10.94 (from the $69.06 Entry). Thus, the Return on Risk factor, R, would $10.94/$1.21 = 9 R.
Summary: Target has been in a downtrend since peaking at $90 last September but has had a very bearish last two weeks. Price action has been below the 15 min Cloud during this time but popped above on Monday and this shift triggered a new TC LONG signal. The Risk with this TC signal is $1.21 and the target for any continuation is up near $80 which, if achieved, would offer a Return on Risk of 9 R.
However, any break and hold below the weekly Cloud would be a further bearish signal and I would then look to $40 as the target.


