After a bumpy start to October, global stock indices staged a bit if a recovery last week and so I thought I’d check on some charts as we head into the final week of the month.
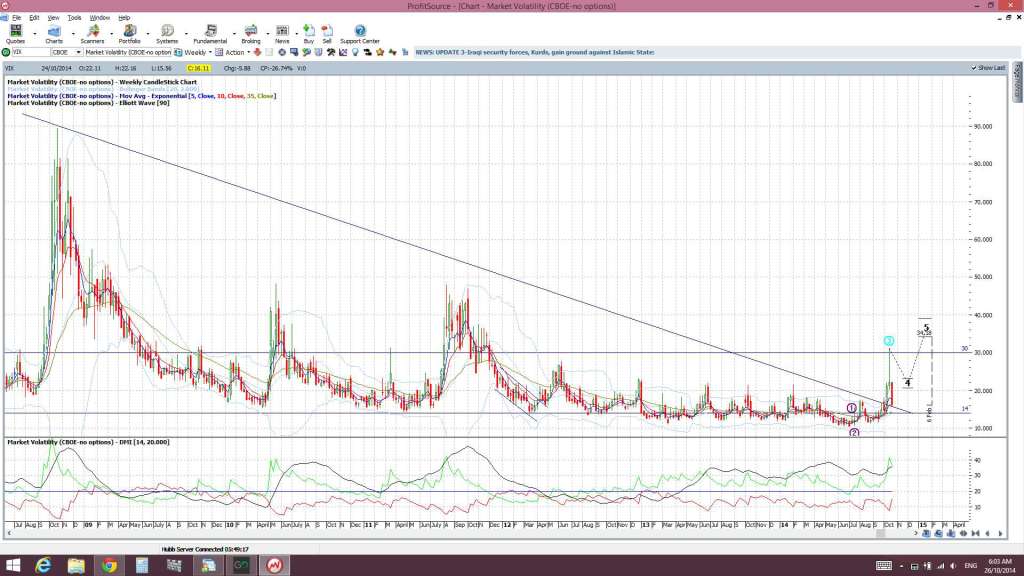
I had been hoping that we would get a deeper pull back here but this doesn’t seem to be the case at present with the VIX, or ‘fear’ indicator, now back down to below 20. Added to this, AAPL looks to have started a bullish breakout and I’m wondering if this is a clue for the broader market. Some indices and stocks are back to looking bullish! Given I am an Aussie I’ve profiled quite a few Aussie stocks at the end of this report.
VIX weekly: still on a bullish triangle breakout BUT back below 20 for now:
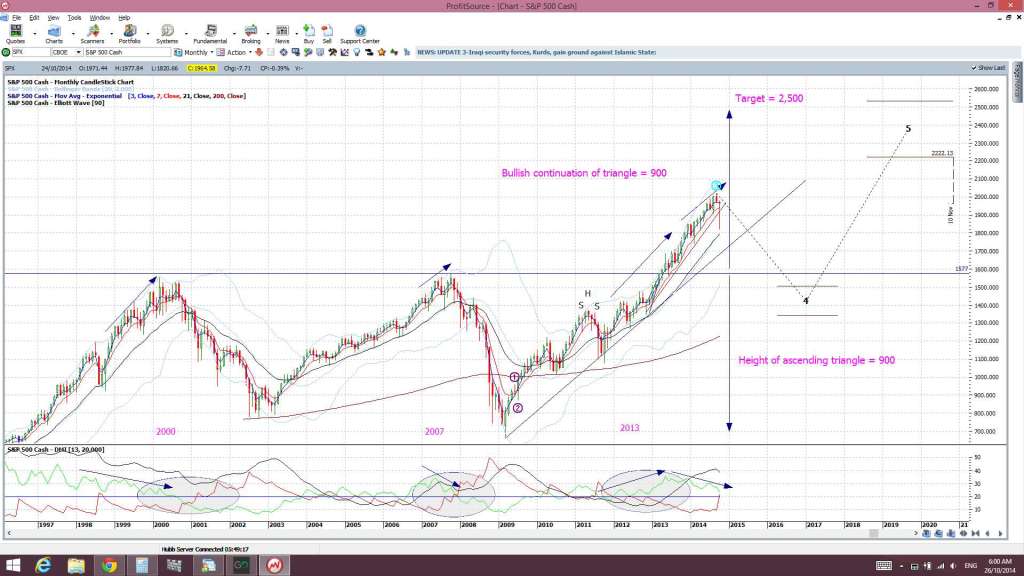
S&P500 Monthly: we didn’t get much of a pull back and I had thought the 1,577 might be tested.
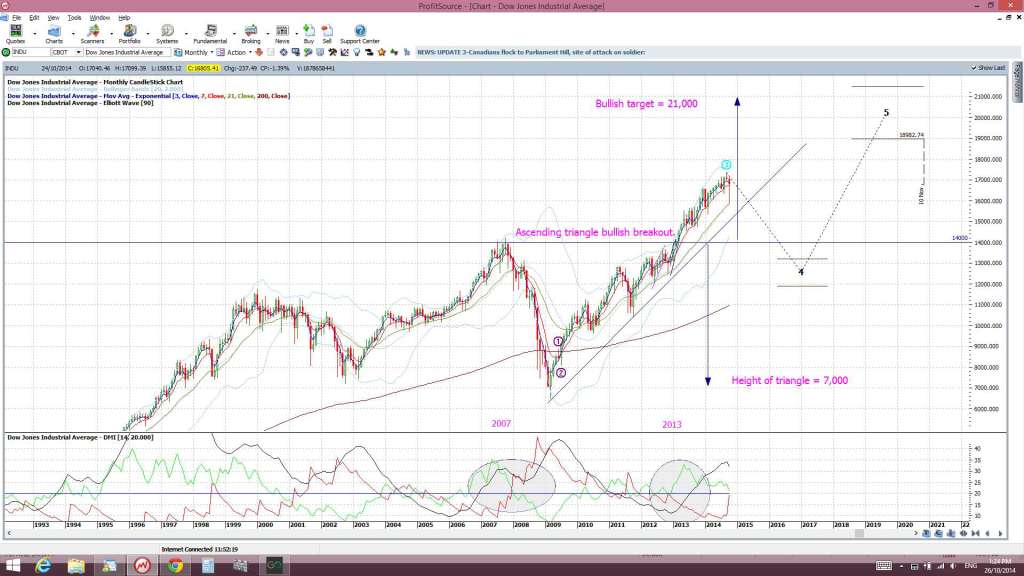
DJIA monthly: I was expecting more of a pull back here too:
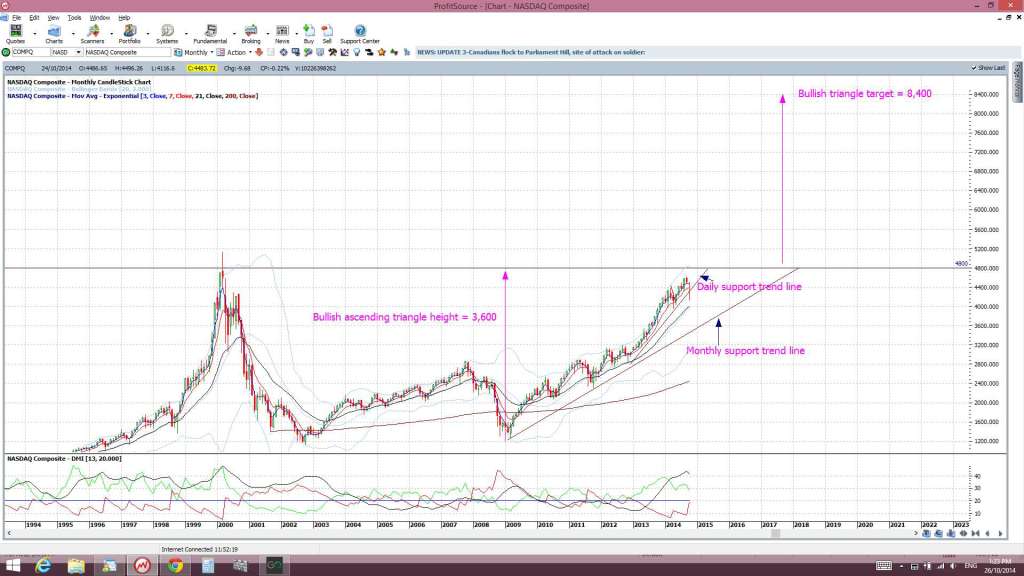
NASDAQ monthly: the 4,800 level is a key one to watch here.
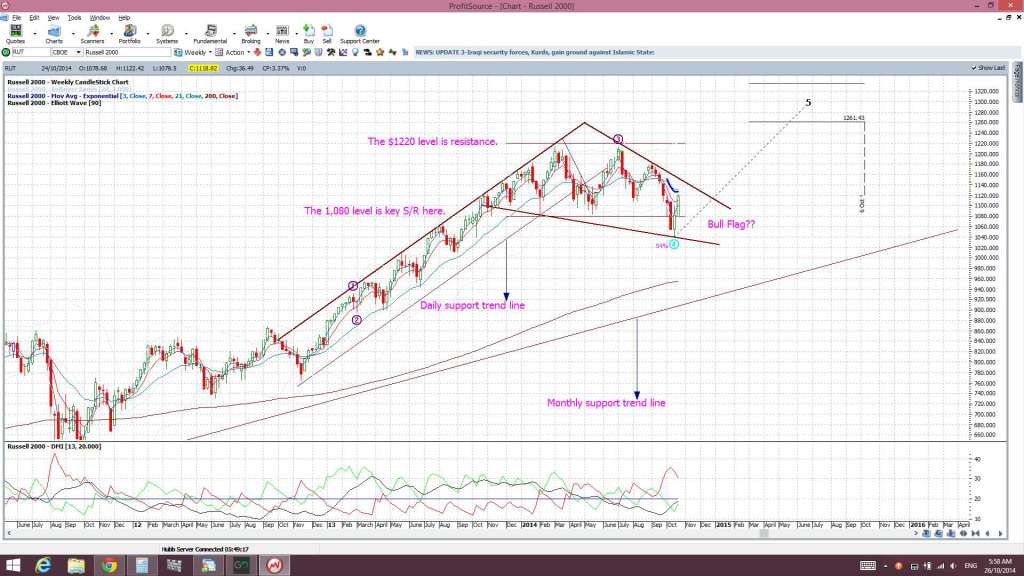
Russell 2000 weekly: much has been made of the bearish pull back here but the chart has a bit of a ‘Bull Flag’ look to it now!
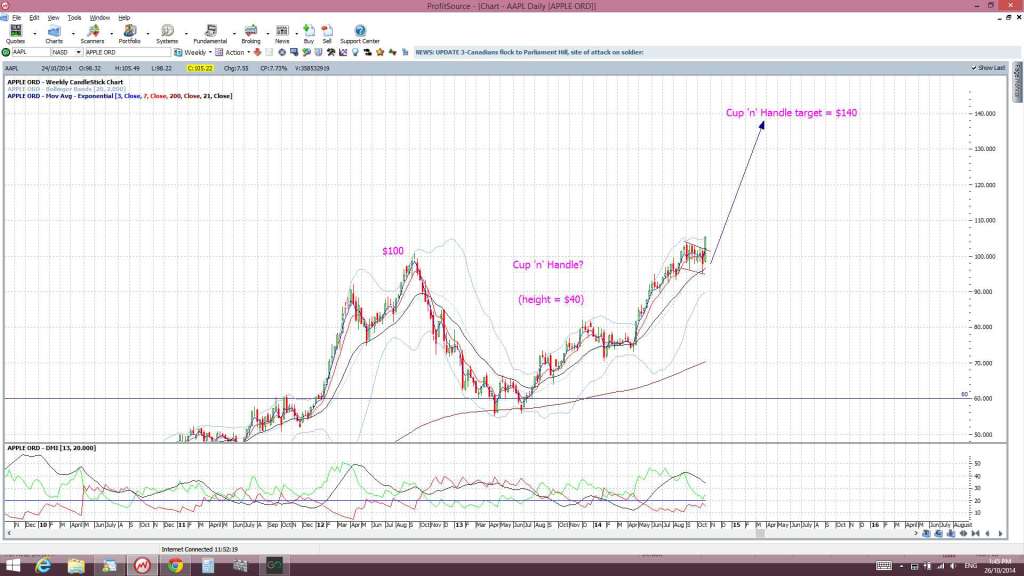
AAPL: the bullish Cup ‘n’ Handle pattern seems to have started! Is this trying to tell us the pull back is over?
A few of the key US ‘bellwether’ stock/ETFs are back to looking bullish again now too:
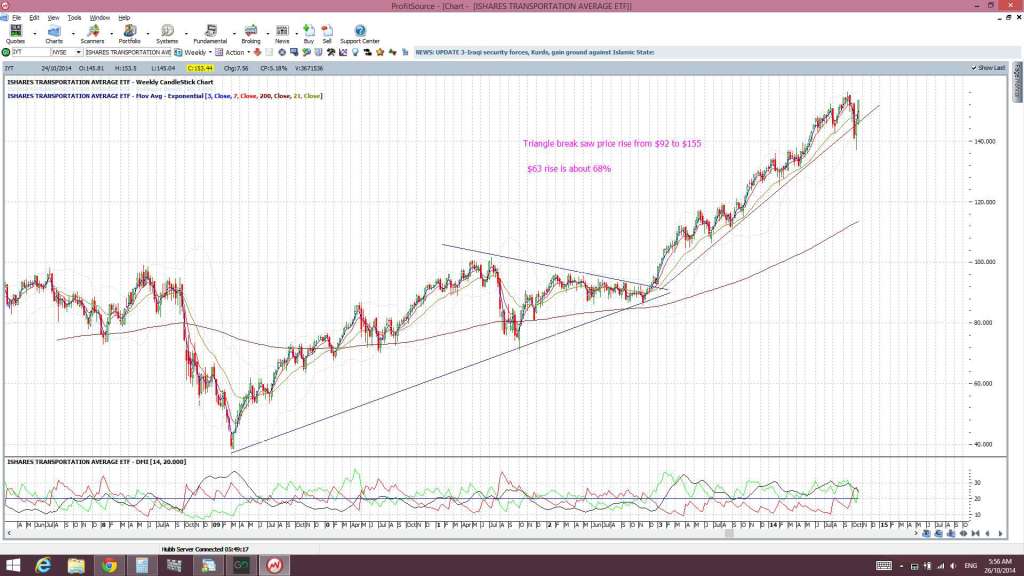
IYT transport ETF: back above a major trend line:
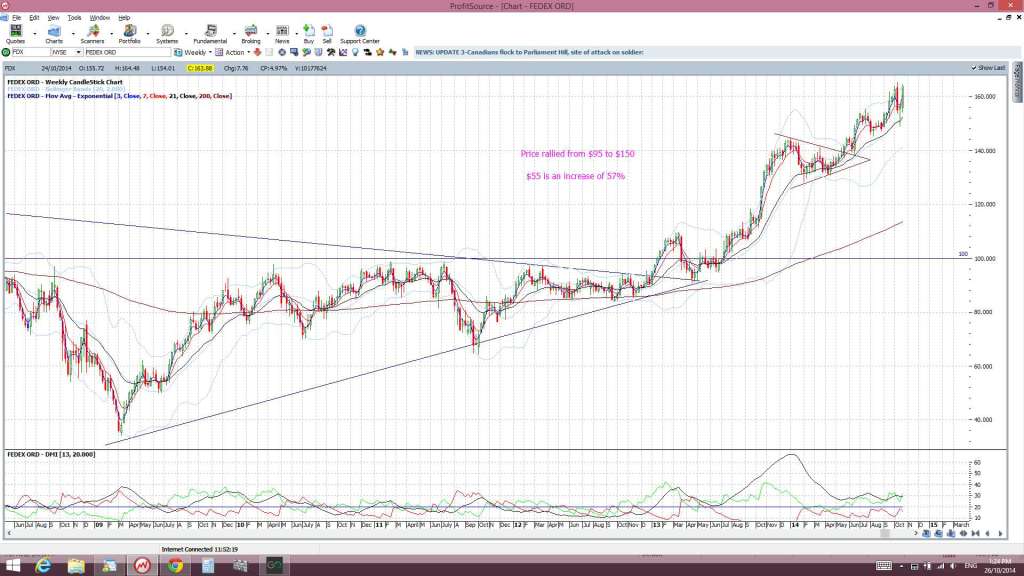
FDX Fedex weekly: continuing higher here too:
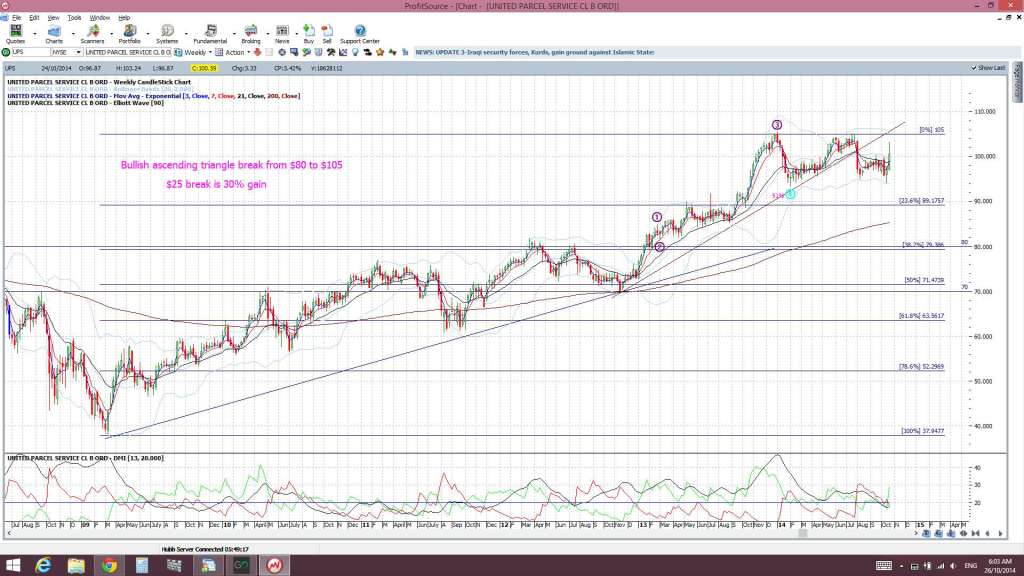
UPS weekly: this has been consolidating sideways for a while now BUT any close and hold above the $105 would be bullish:
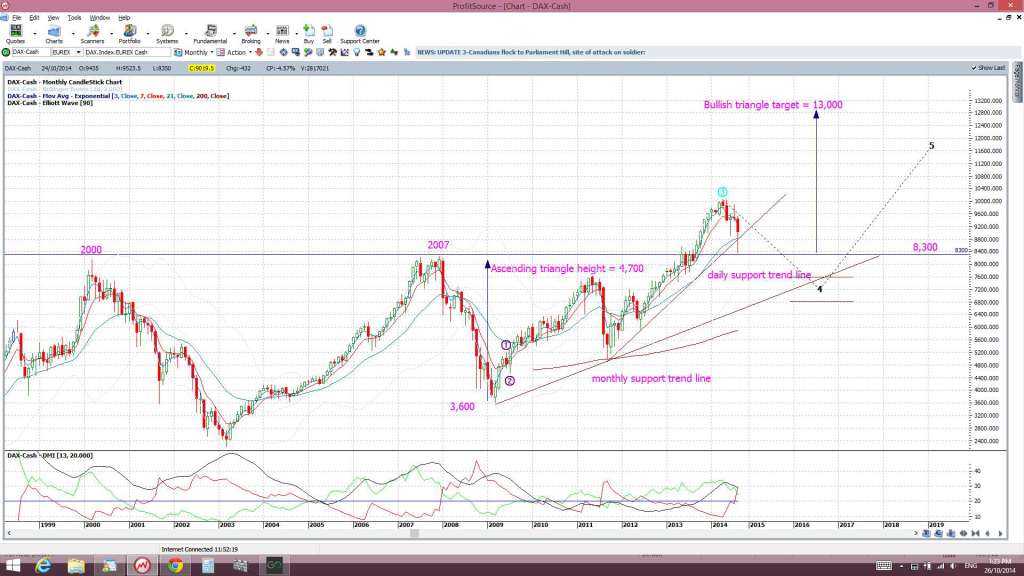
DAX monthly: The German stock Index has tested major support and bounced back up from there:
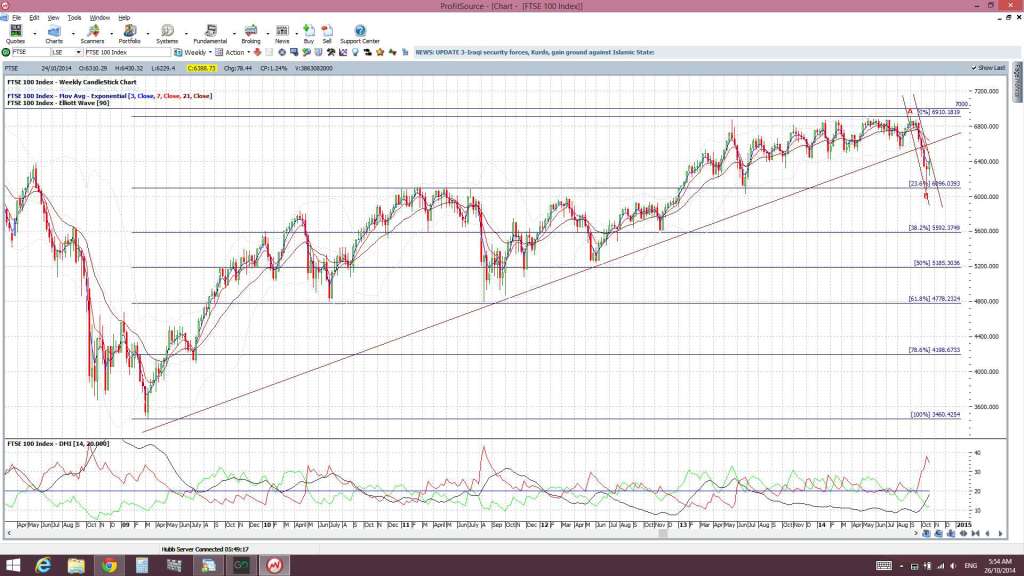
FTSE weekly: is that a possible ‘Bull Flag’ building here?
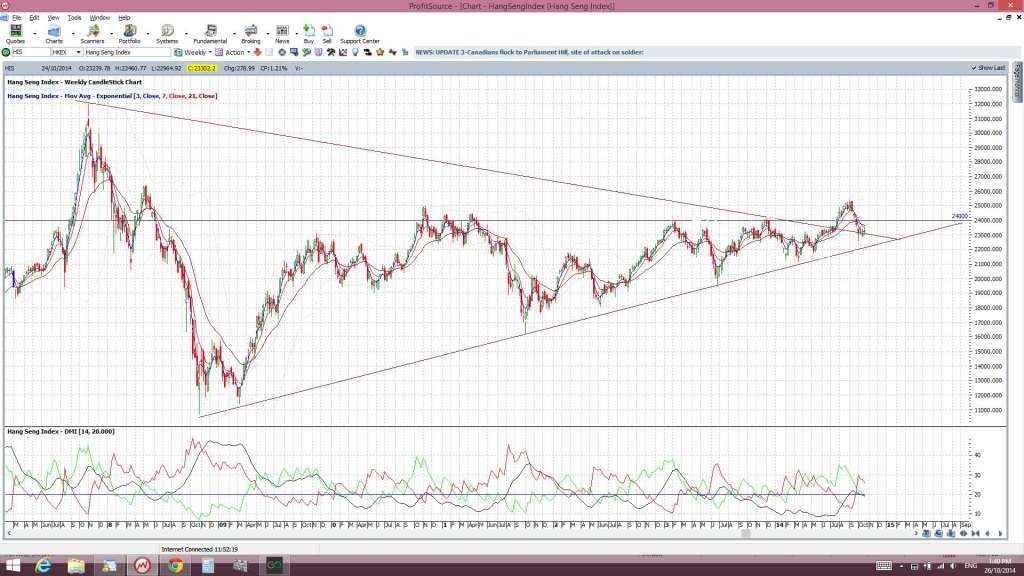
Hang Seng Index: any new close and hold above the 24,000 level would be bullish:
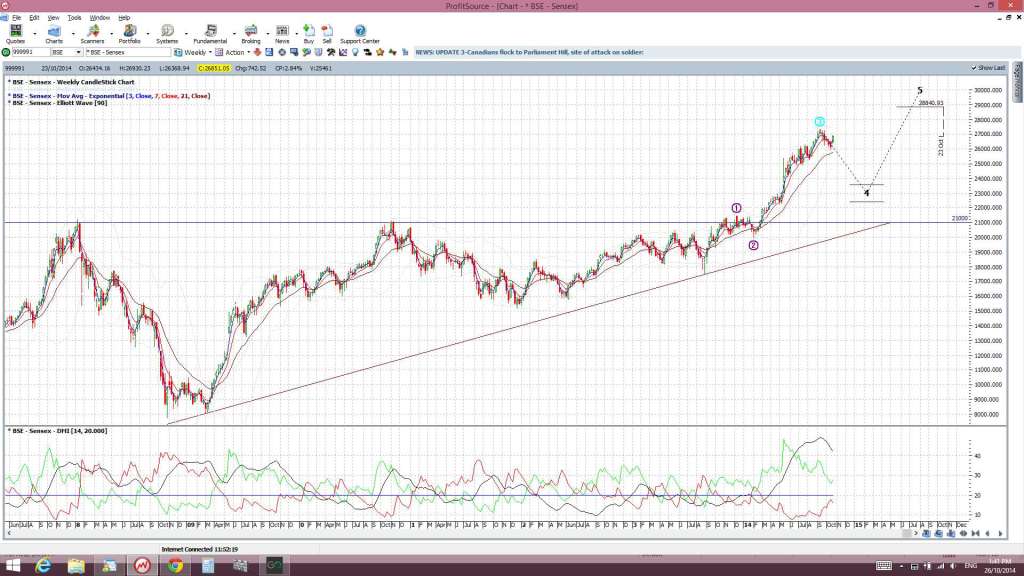
India’s SENSEX is still bullish:
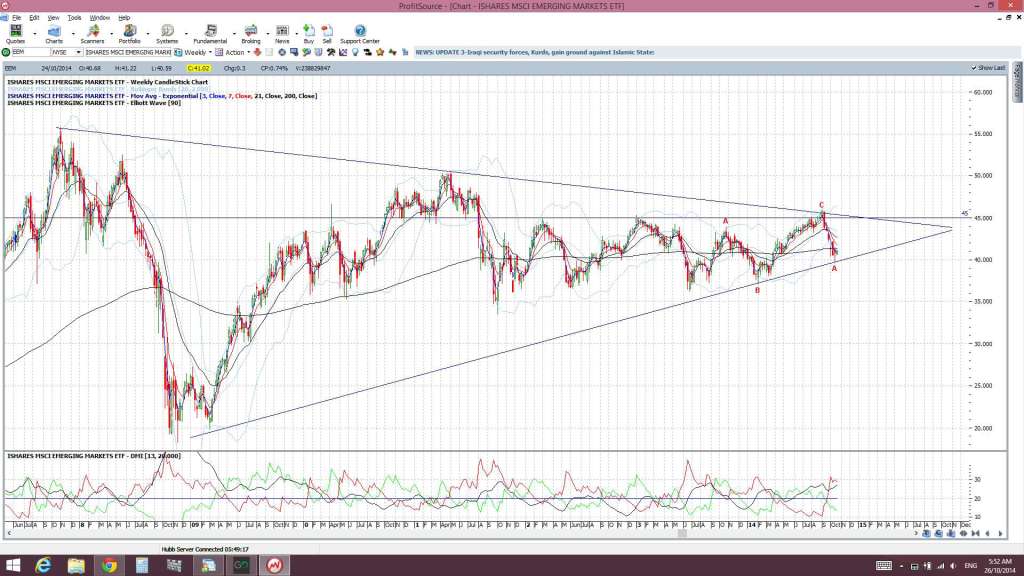
EEM: the Emerging Market ETF has tested support and I’m watching for any possible bounce here:
Aussie Stock Indices and Stocks:
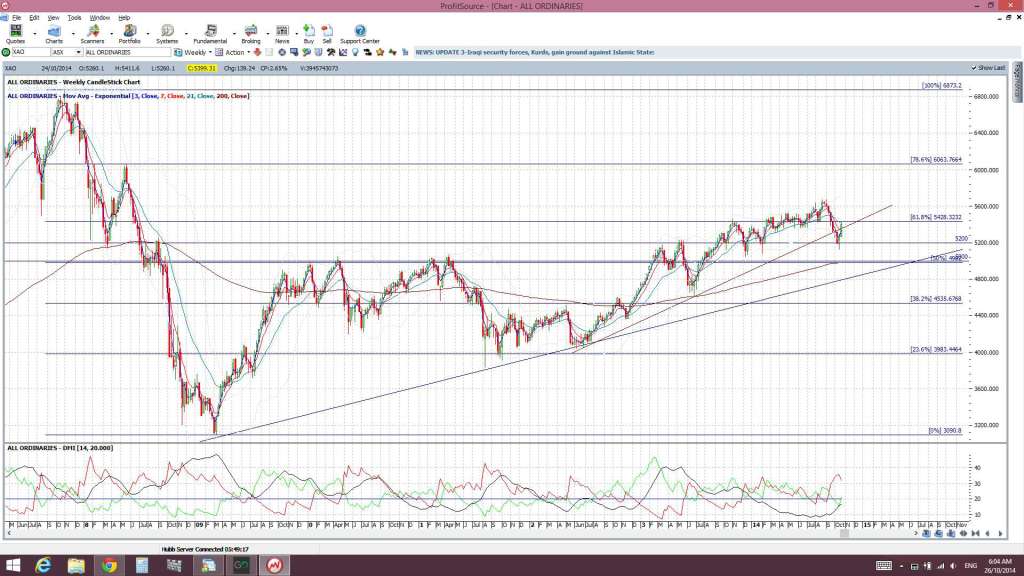
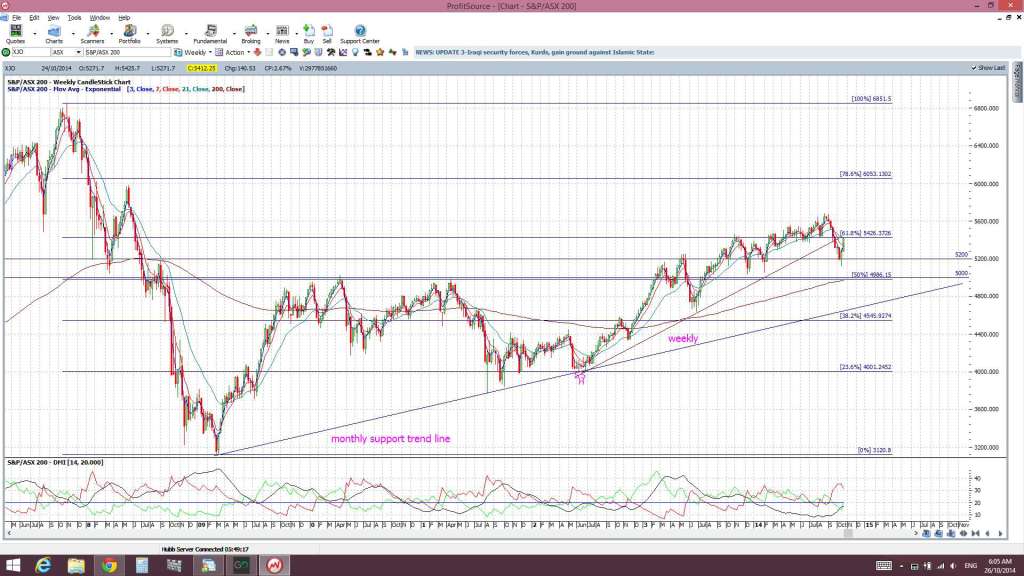
XAO weekly (Aussie All Ordinaries): price made a bullish channel/flag breakout and is back to the key 61.8% fib level near the 5,400 area:
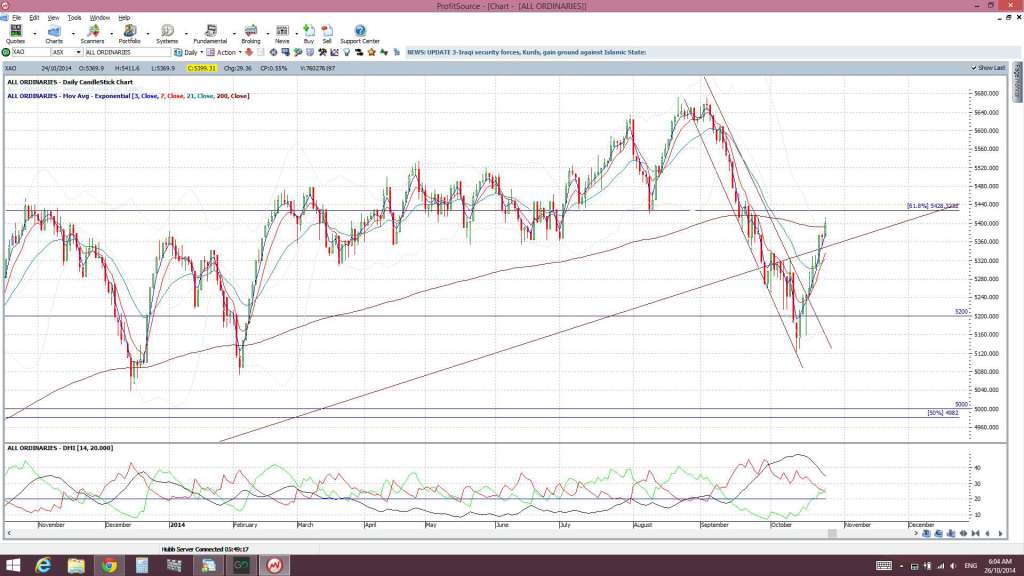
XAO daily:
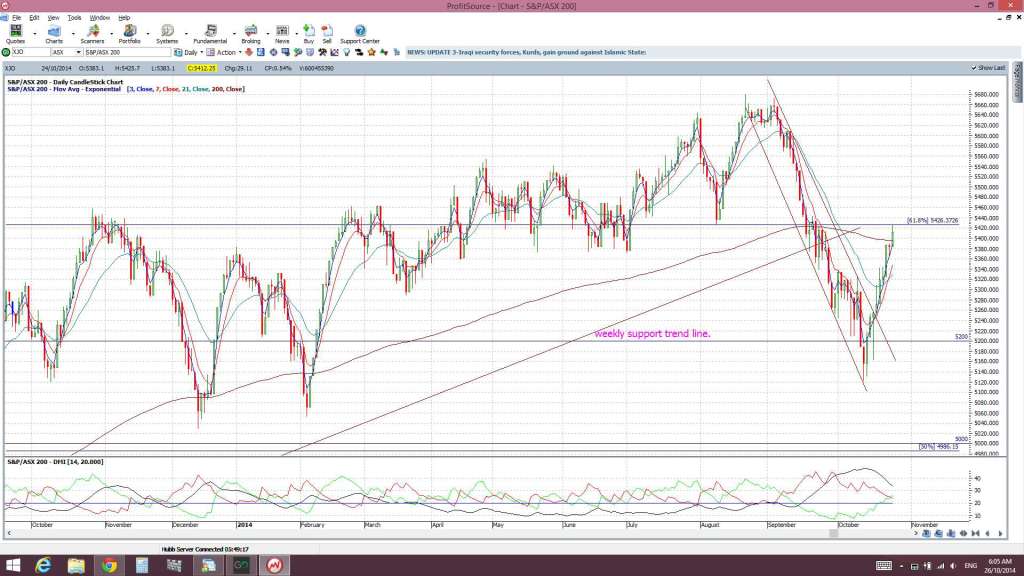
XJO weekly (ASX 200): ditto here too
XJO daily:
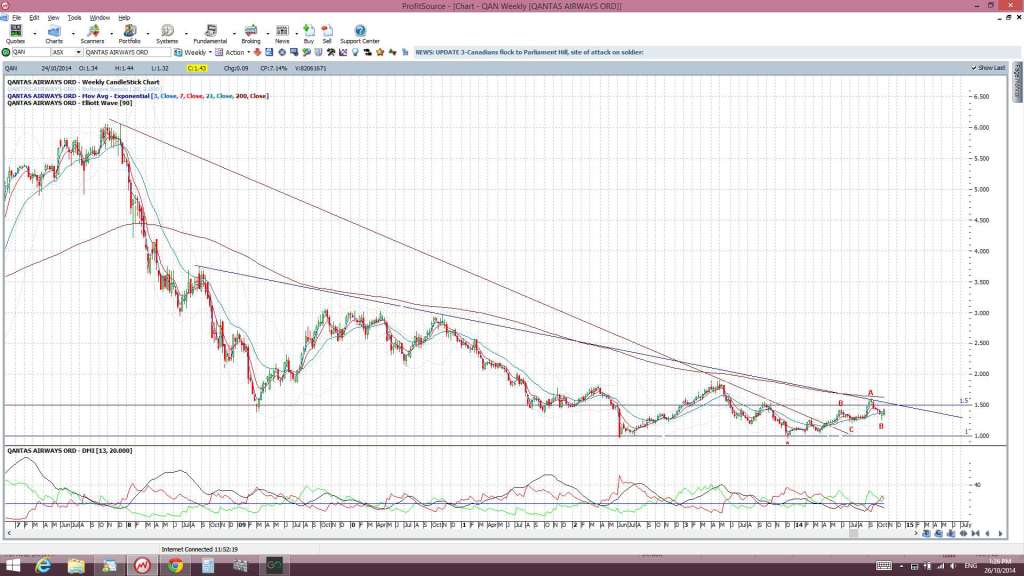
QANTAS: I still consider and close and hold above the $1.50 level to be bullish:
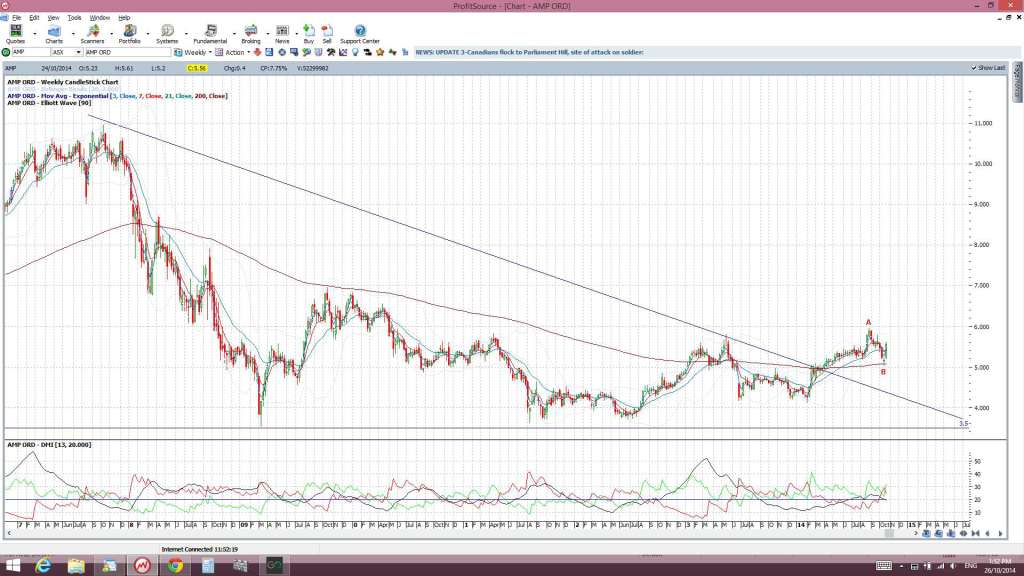
AMP: a close above $6 would be bullish:
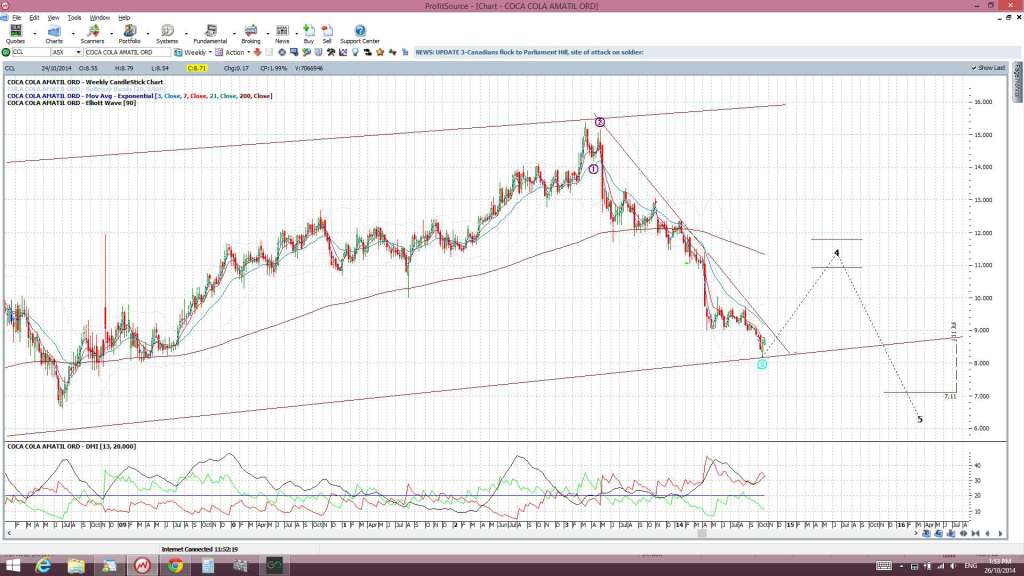
CCL weekly: watching Coca Cola for any trend line break here:
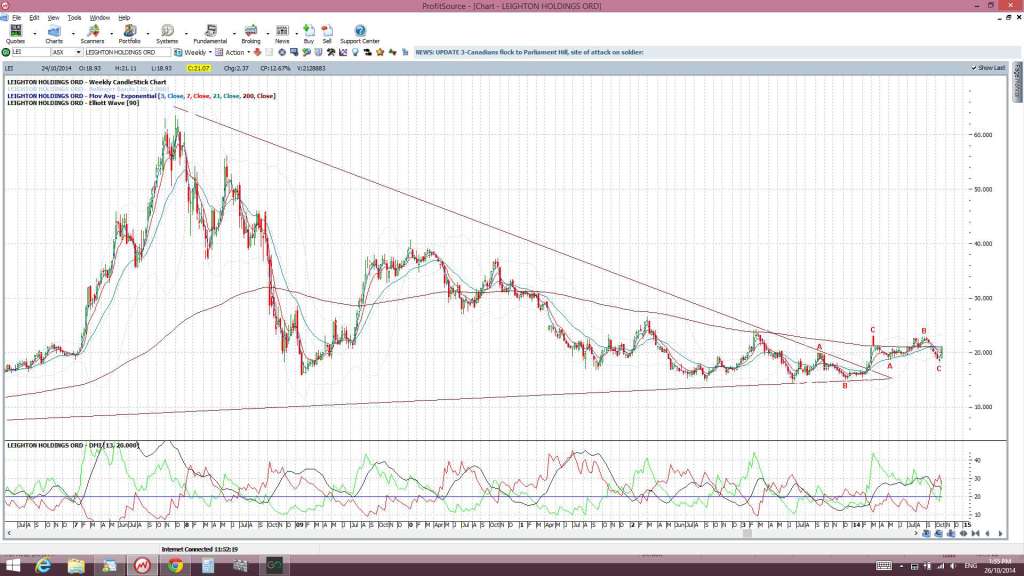
LEI weekly: I’m keeping an eye on this for a bullish breakout move:
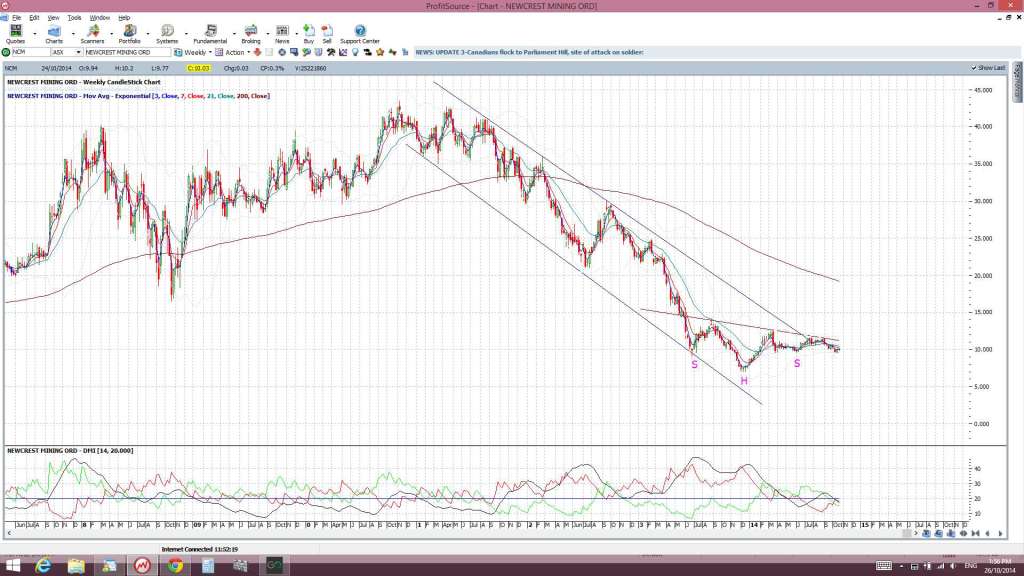
NCM weekly: keeping an eye on the ‘neck line’ here:
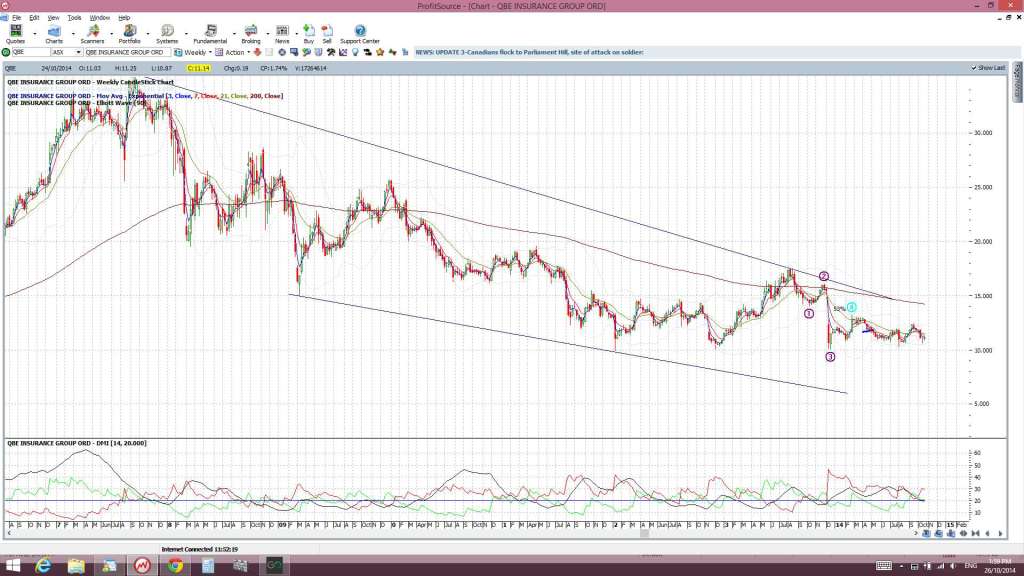
QBE: this is still within a bullish ‘descending edge’:
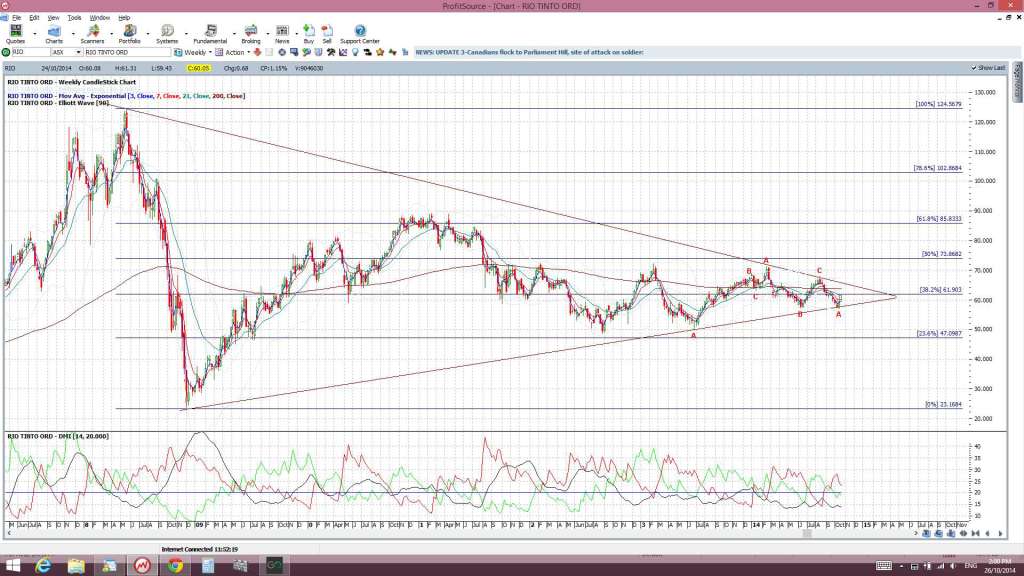
RIO weekly: still conforming to a triangle:
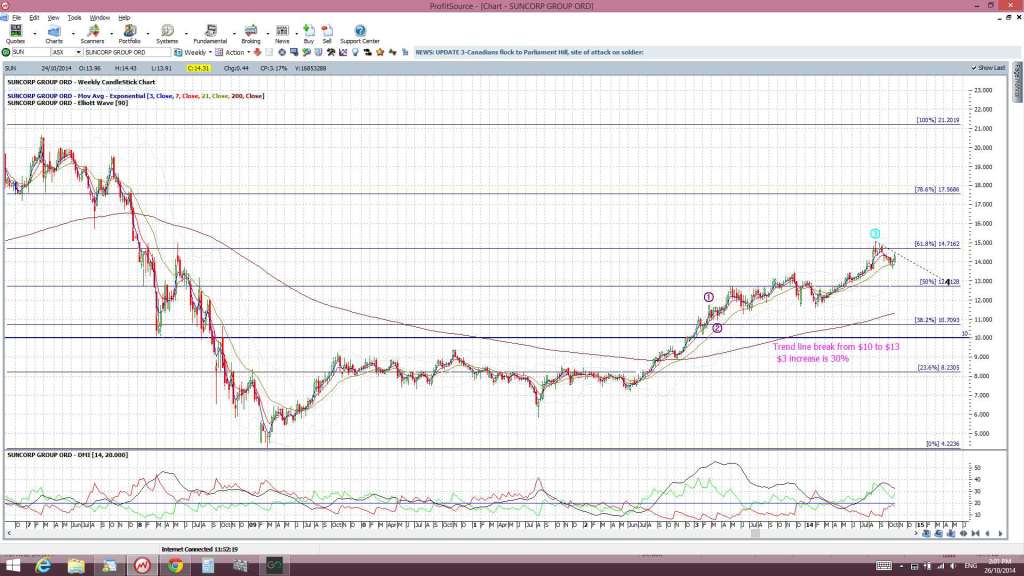
SUN weekly: any new close and hold above $15 would be bullish:
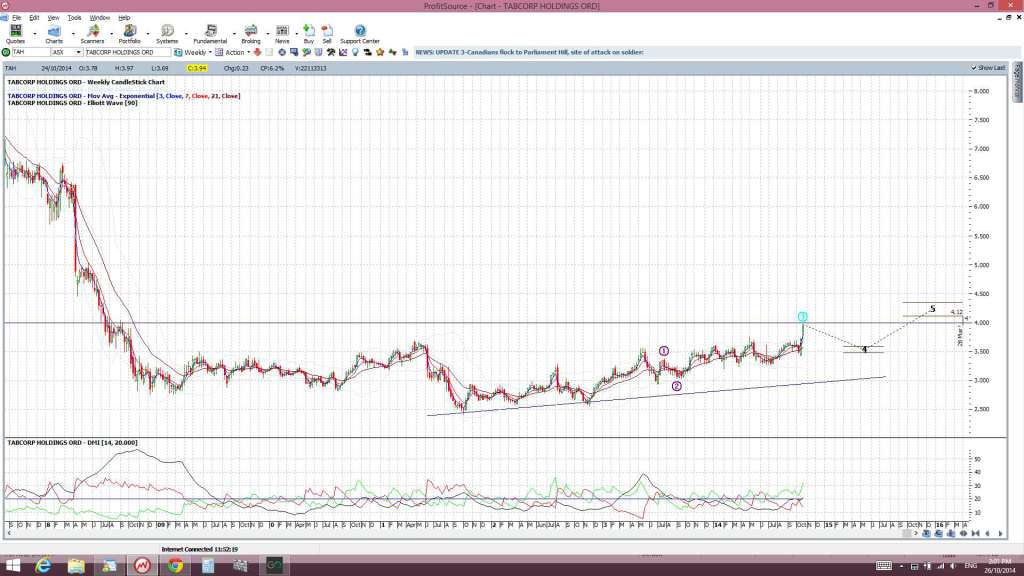
TAH weekly: any new close and hold above $4 would be bullish here:
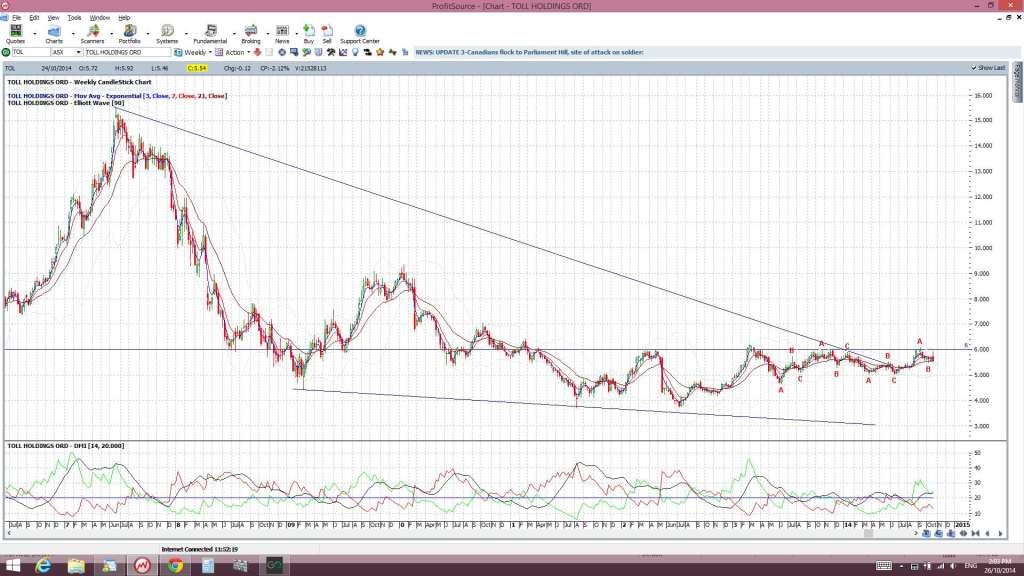
TOL weekly: any new close and hold above $6 would be bullish here:
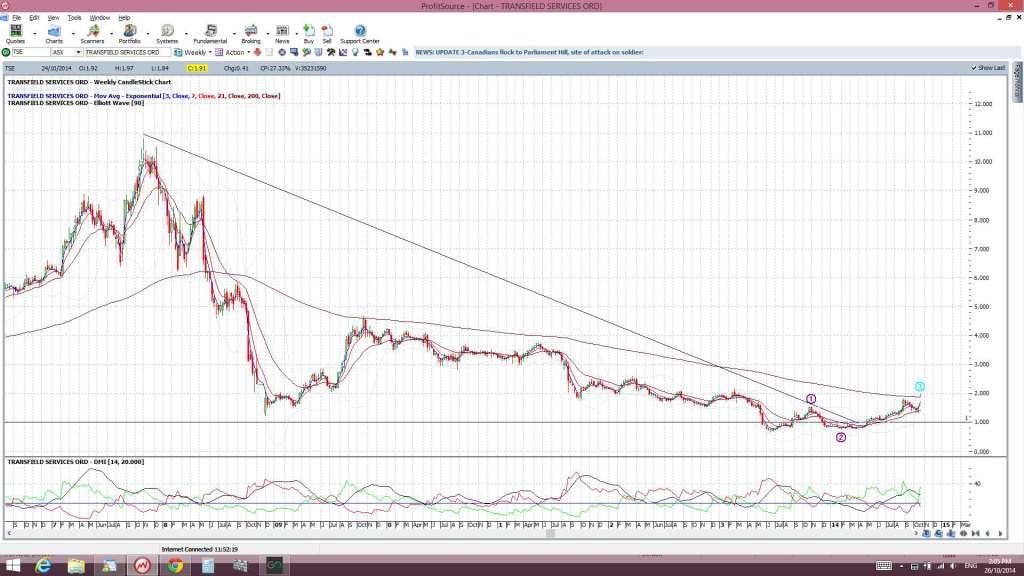
TSE weekly: any new close and hold above $2 would be bullish here:
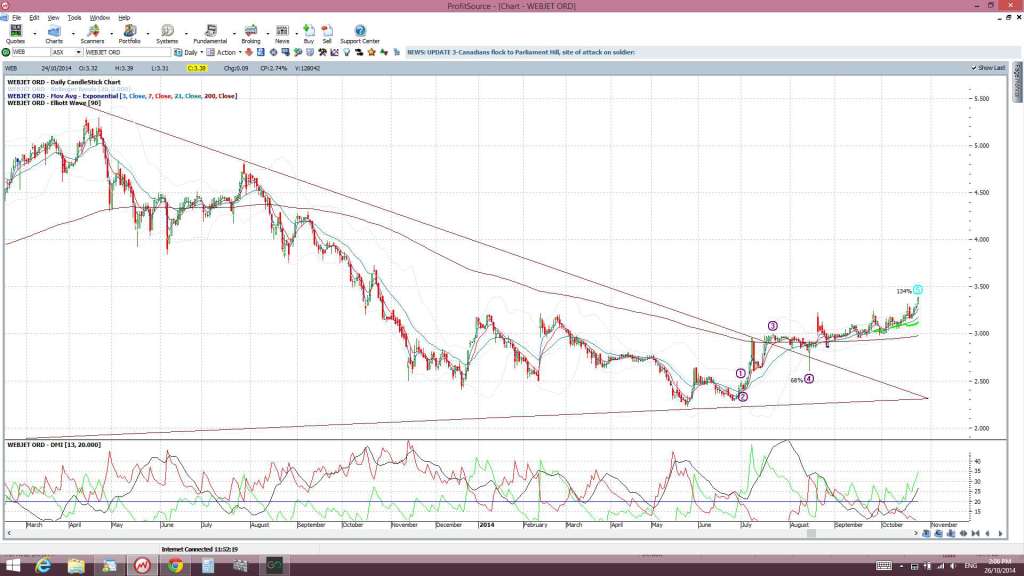
WEB weekly: Webjet continues with its bullish breakout:


