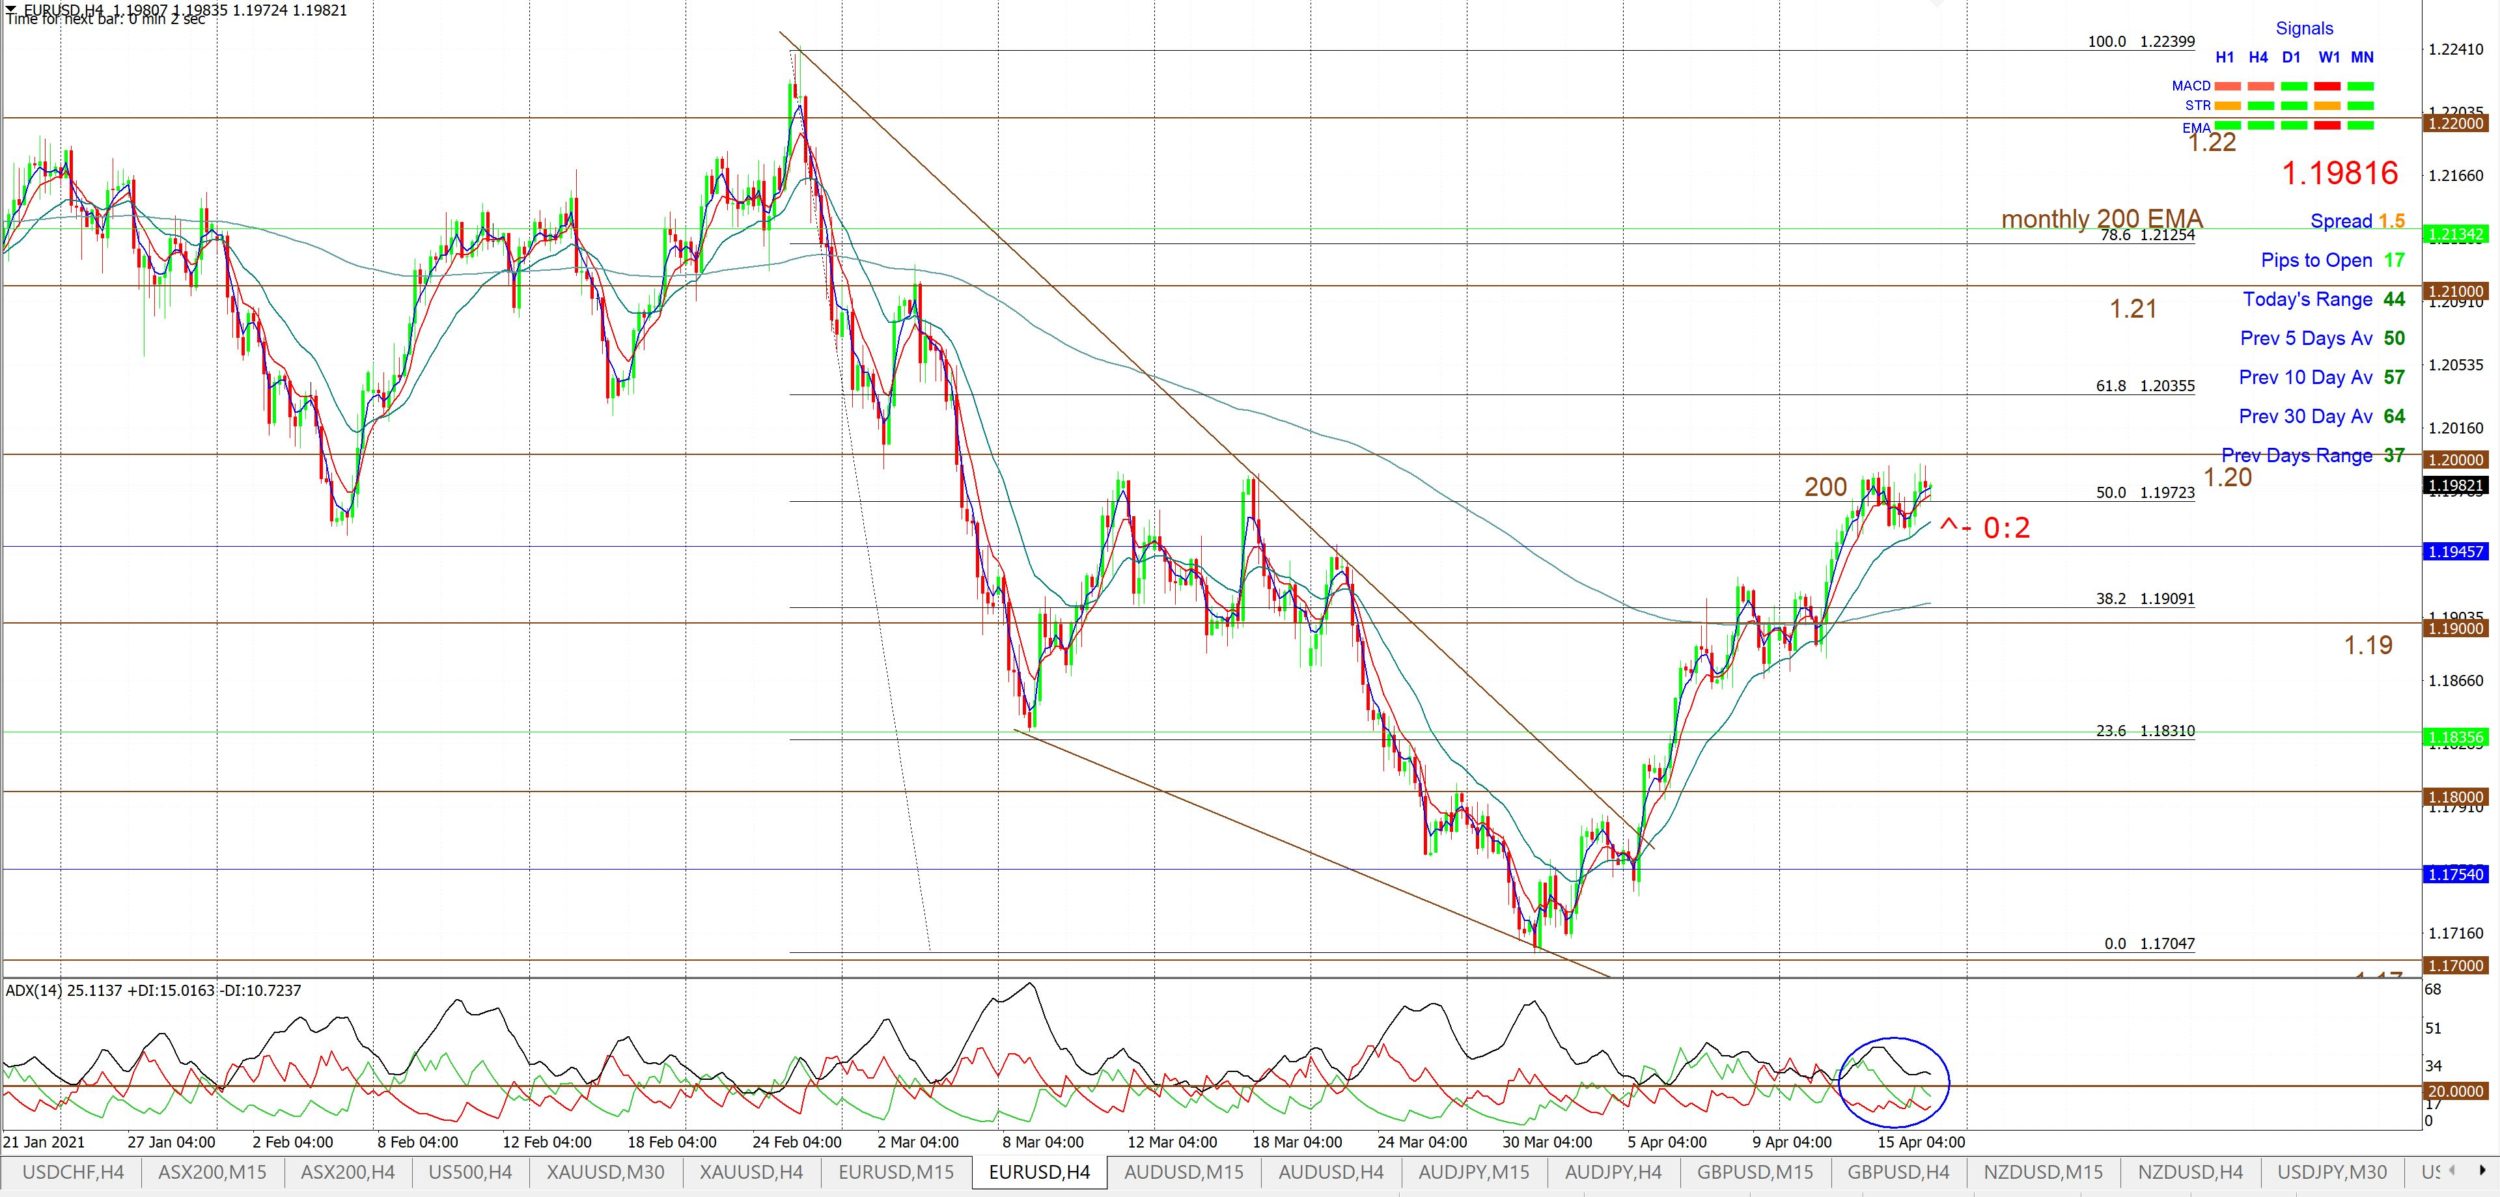
Last week: In my weekend update from two weeks ago, on April 4th 2021, I noted bullish-reversal descending wedge patterns on the 4hr charts of Gold, the EUR/USD, AUD/USD, NZD/USD and GBP/USD (see screen shot below). Since that update, bullish wedge breakouts have triggered and yielded $40 on Gold, 200 pips on the EUR/USD, 120 pips on the AUD/USD and 130 pips on the NZD/USD so I hope you all caught some of this action! The GBP/USD looks like it is getting ready to make a bullish wedge breakout so might be worth monitoring this week. These breakout moves were no doubt helped by the weaker US$ and US Treasury yields also closed lower for the week. The melt up with US stocks has continued with the S&P500, DJIA, NASDAQ and Russell-2000 all closing higher for the week and the first two, yet again, printing new all-time Highs. However, the more risk-sensitive Russell-2000 was the laggard of the four which should be noted with some element of caution. The other cautionary point to keep in mind is that divergence continues on the S&P500 between volume and momentum; with volume lower but bullish momentum higher. However, for the ASX-200 both volume and bullish momentum were on the rise last week. Earnings season ramps up this week so watch for any impact of results on overall market sentiment.
Screen shot: the warning from my post published on April 4th 2021. The warning on Gold was separate from this:
 |
NB: I am away this Wednesday 21st, overnight, so there won’t be any daily update published on Thursday 22nd April.
Technical Analysis: It is important to keep in mind that this analysis is Technical and chart-based but that any major Fundamental news items, as recently seen with Covid-19, have the potential to quickly undermine identified chart patterns. This is why it is critical that traders appropriately manage their trade exposure and risk per trade during these volatile market conditions.
Trend line breakouts: There were quite a few breakouts last week with most aligned and aided by the weaker US$. Updates posted throughout last week can be found through the links here, here, here and here:
- Gold: a TL b/o now over $40.
- EUR/USD: a TL b/o now up 200 pips.
- AUD/USD: a TL b/o up 120 pips.
- NZD/USD: a TL b/o now up 130 pips.
- AUD/JPY: a TL b/o now up 80 pips.
- USD/JPY: a TL b/o for 60 pips.
- ASX-200: a TL b/o for 80 points.
This Week: (click on images to enlarge):
-
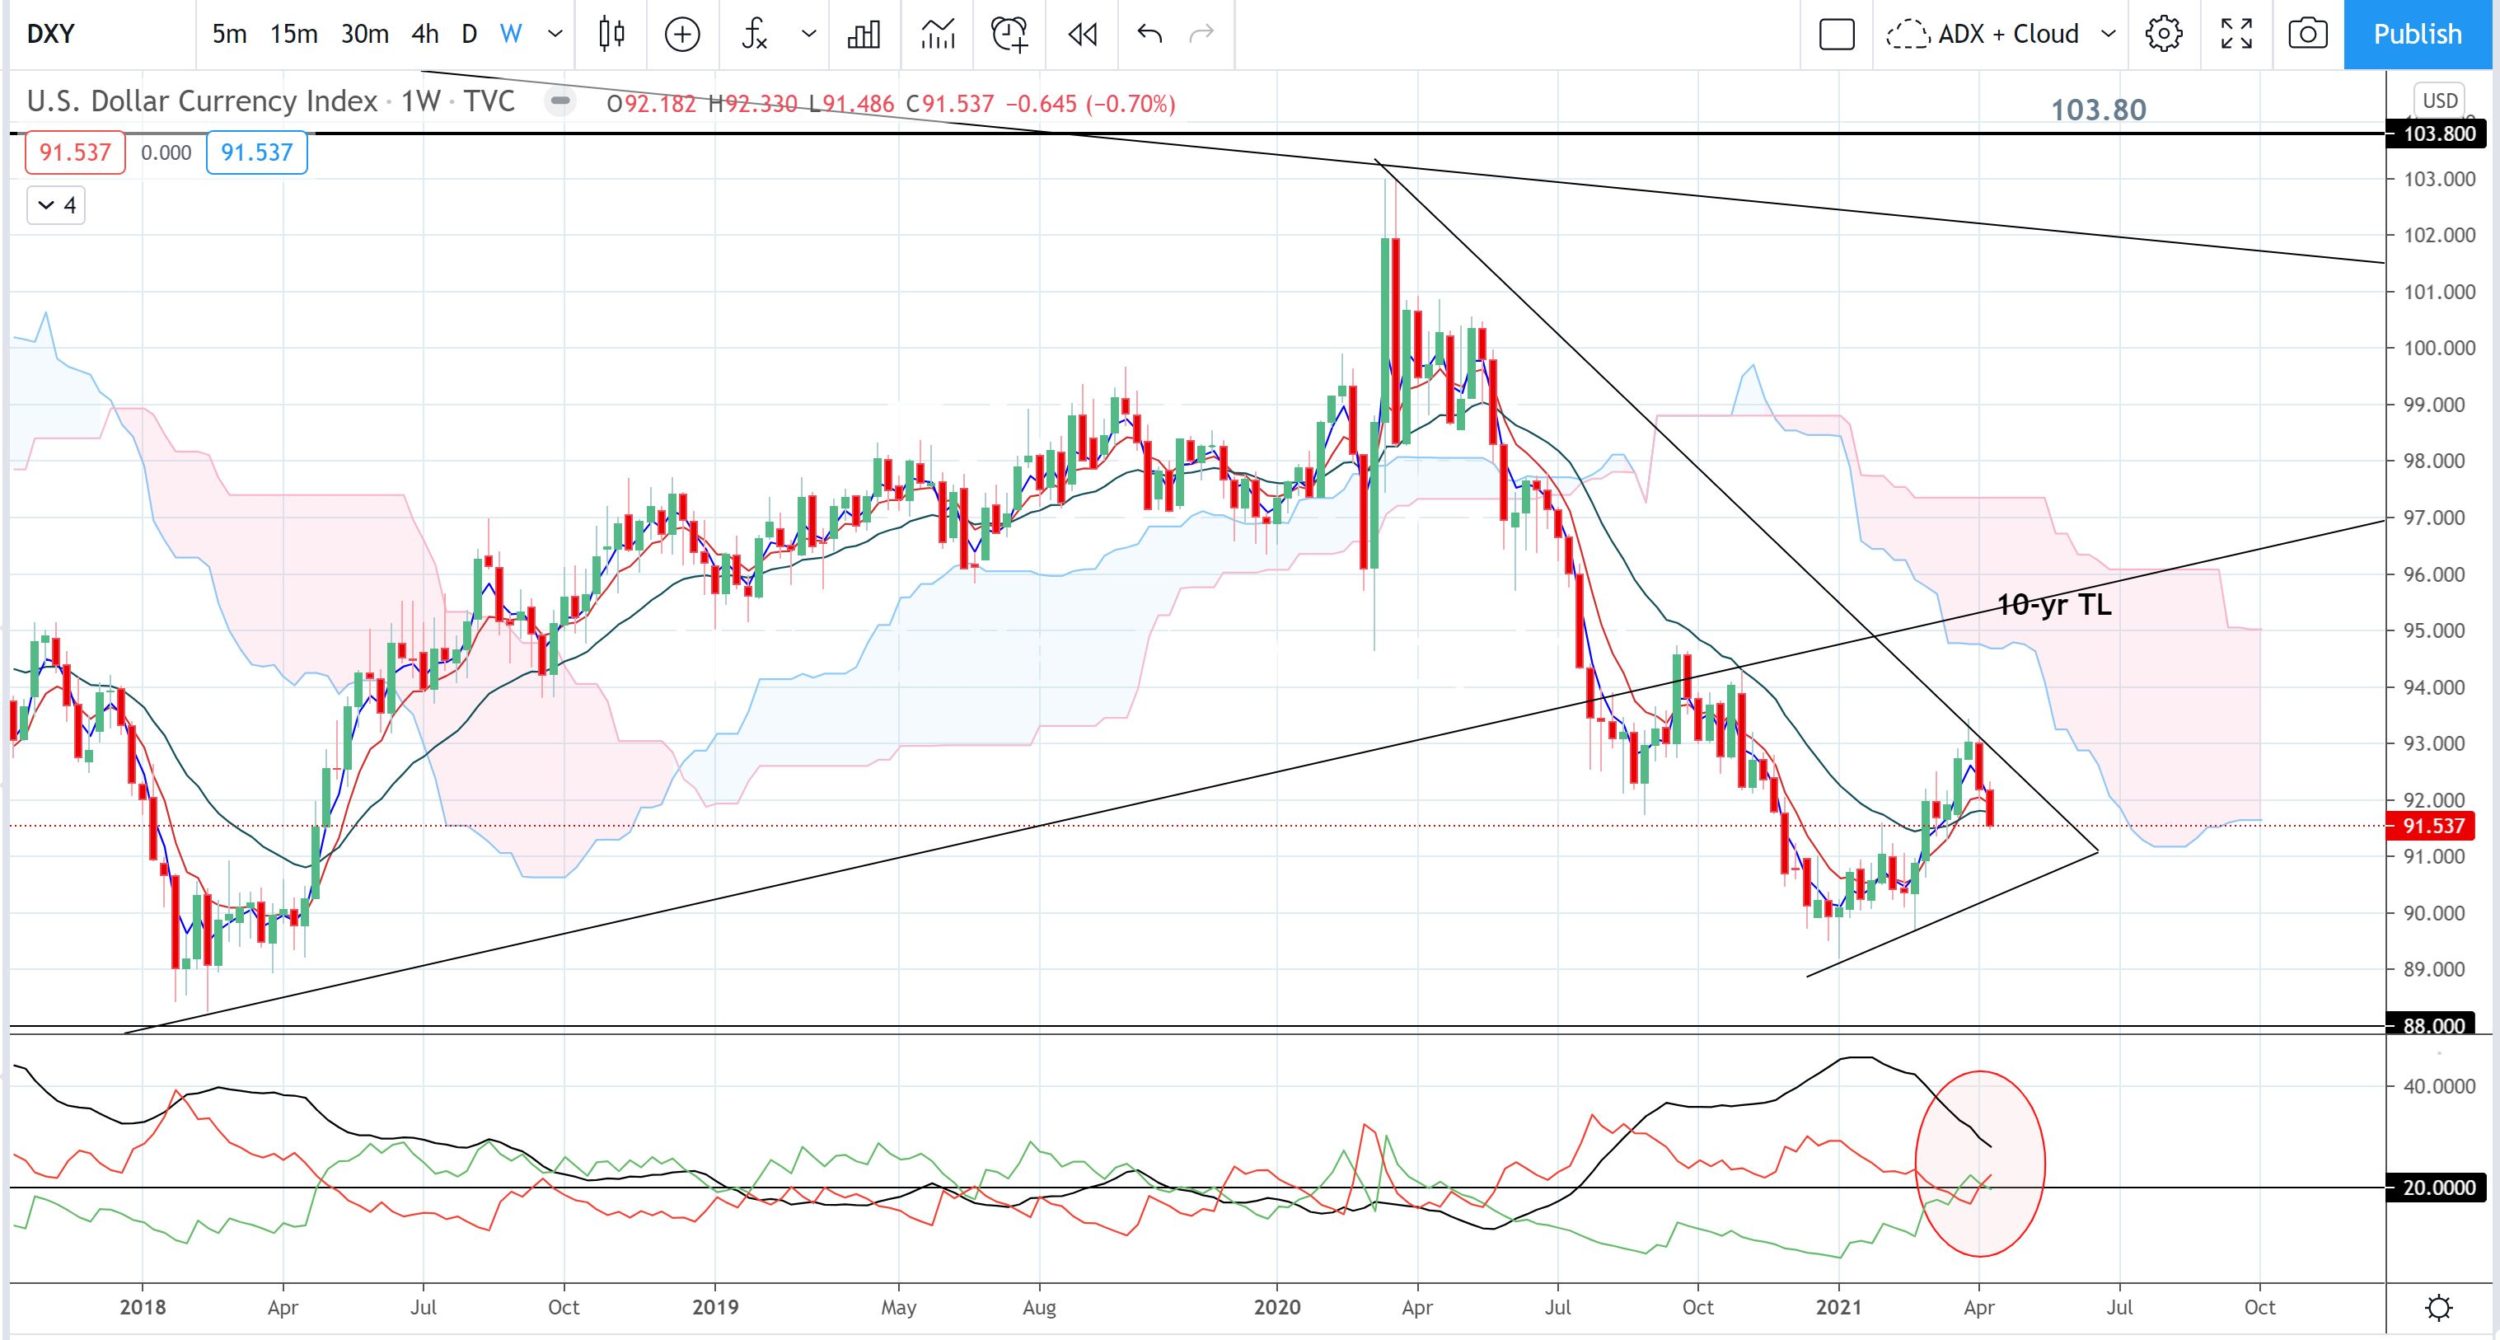
- DXY: US$ Index: The US$ index closed with a bearish weekly candle and note the revised weekly chart pattern to monitor for any new momentum supported breakout.
DXY weekly: watch for any new momentum-based trend line breakout:
-
- Central Bank Update: There are two Central Bank updates this week: BoC (CAD) and ECB (EUR).
-
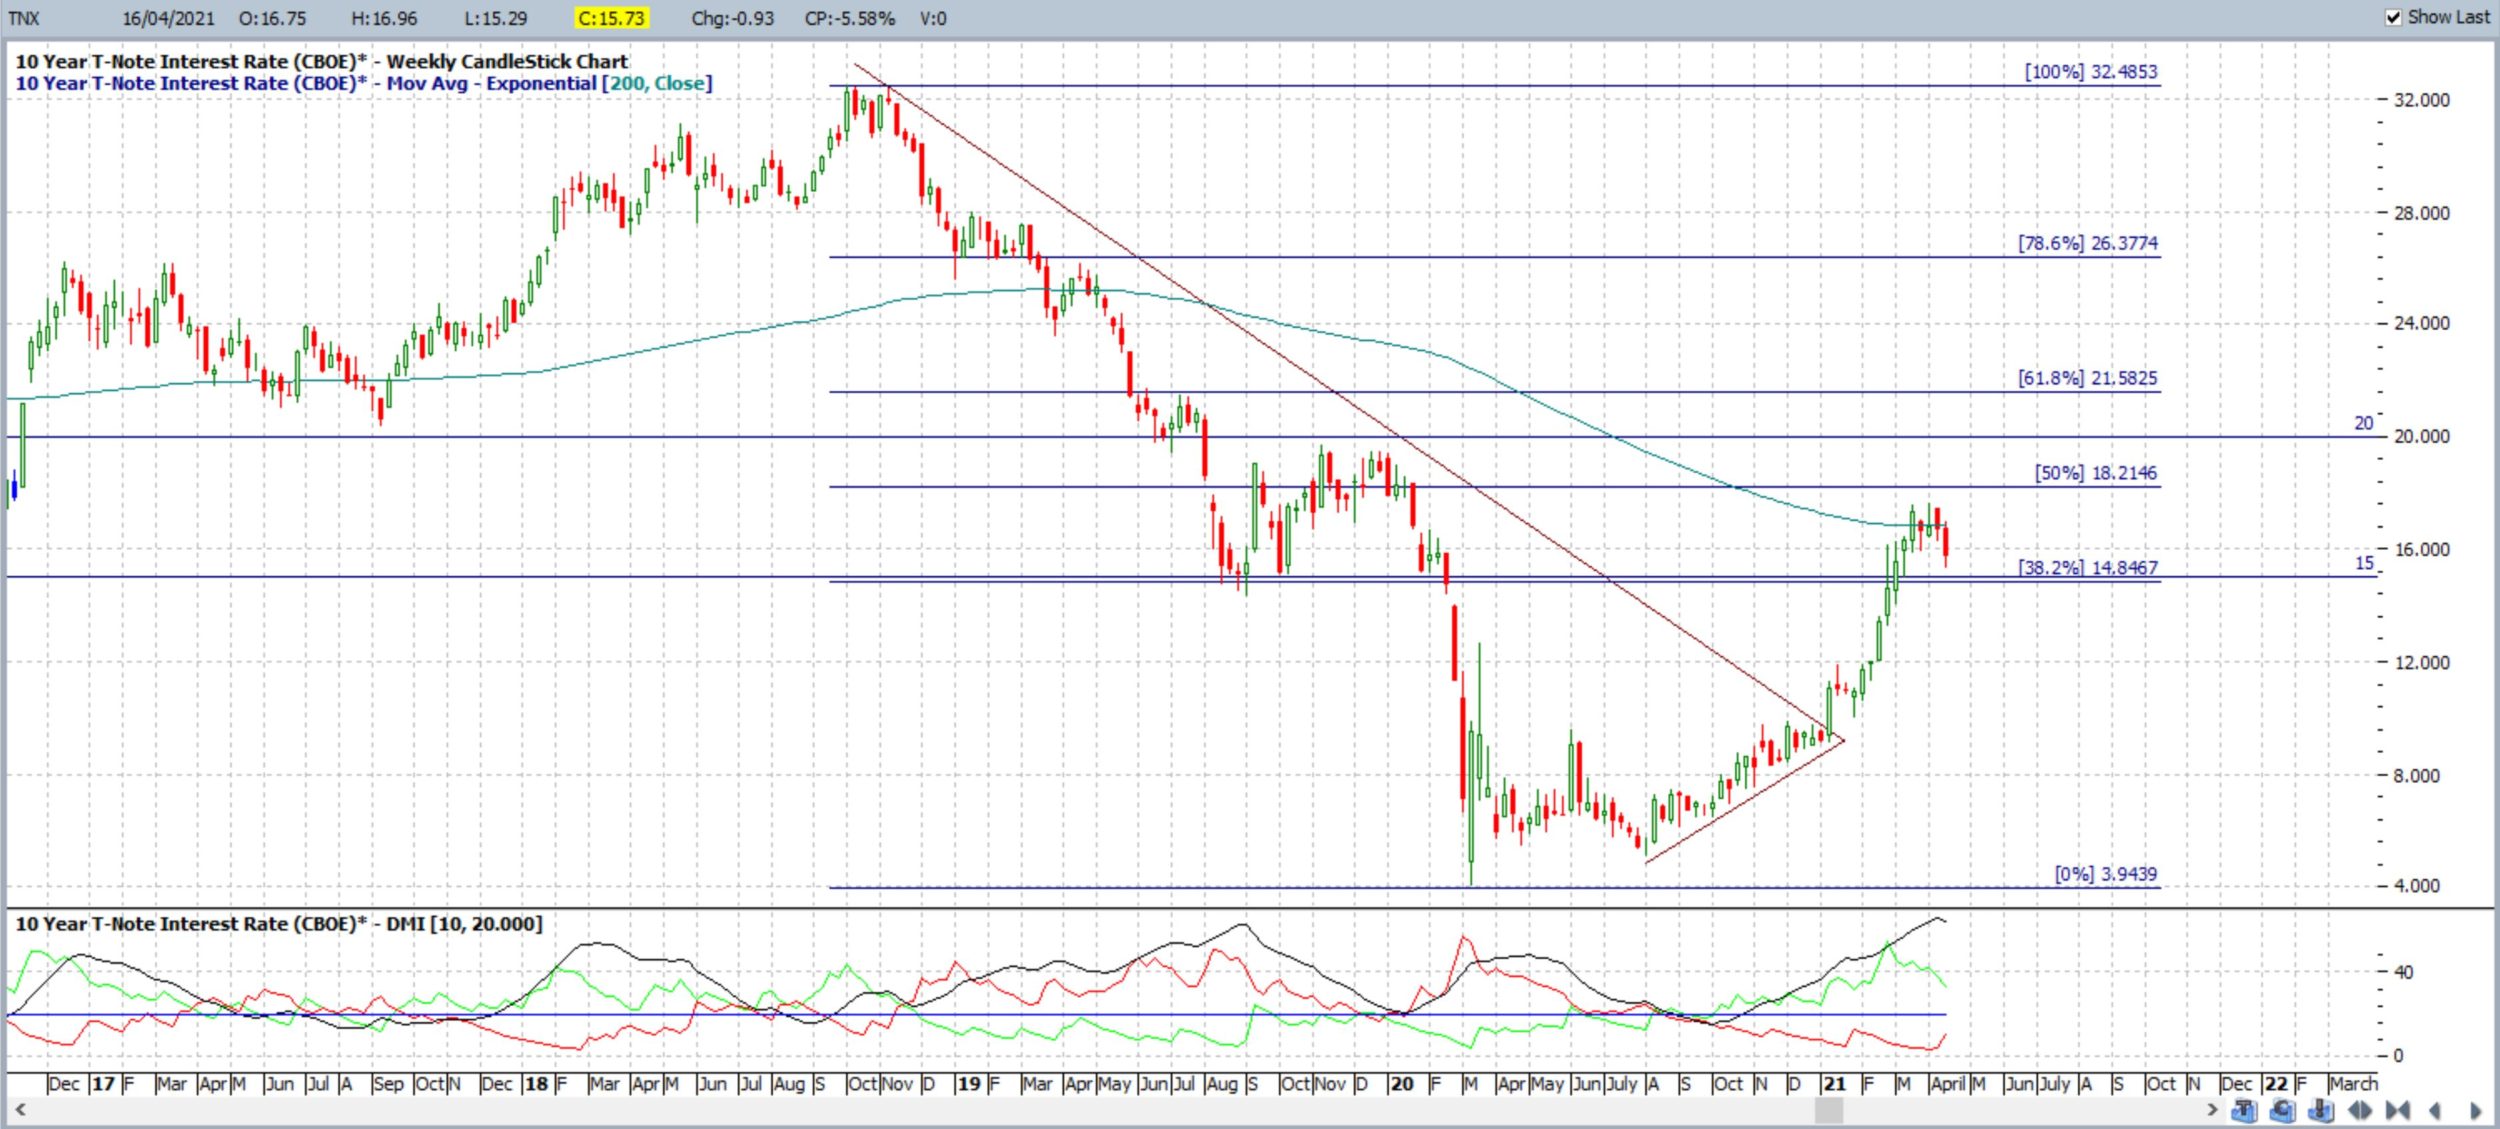
- 10-yr T-Note Interest rate: The chart of the 10-yr Treasury Interest rate shows the recent bullish breakout from the triangle congestion pattern remains paused near the weekly 200 EMA region. Watch the previous resistance region of 15 to act as any potential new support.
- 10-yr T-Note Interest rate: watch 15 for any support:
-
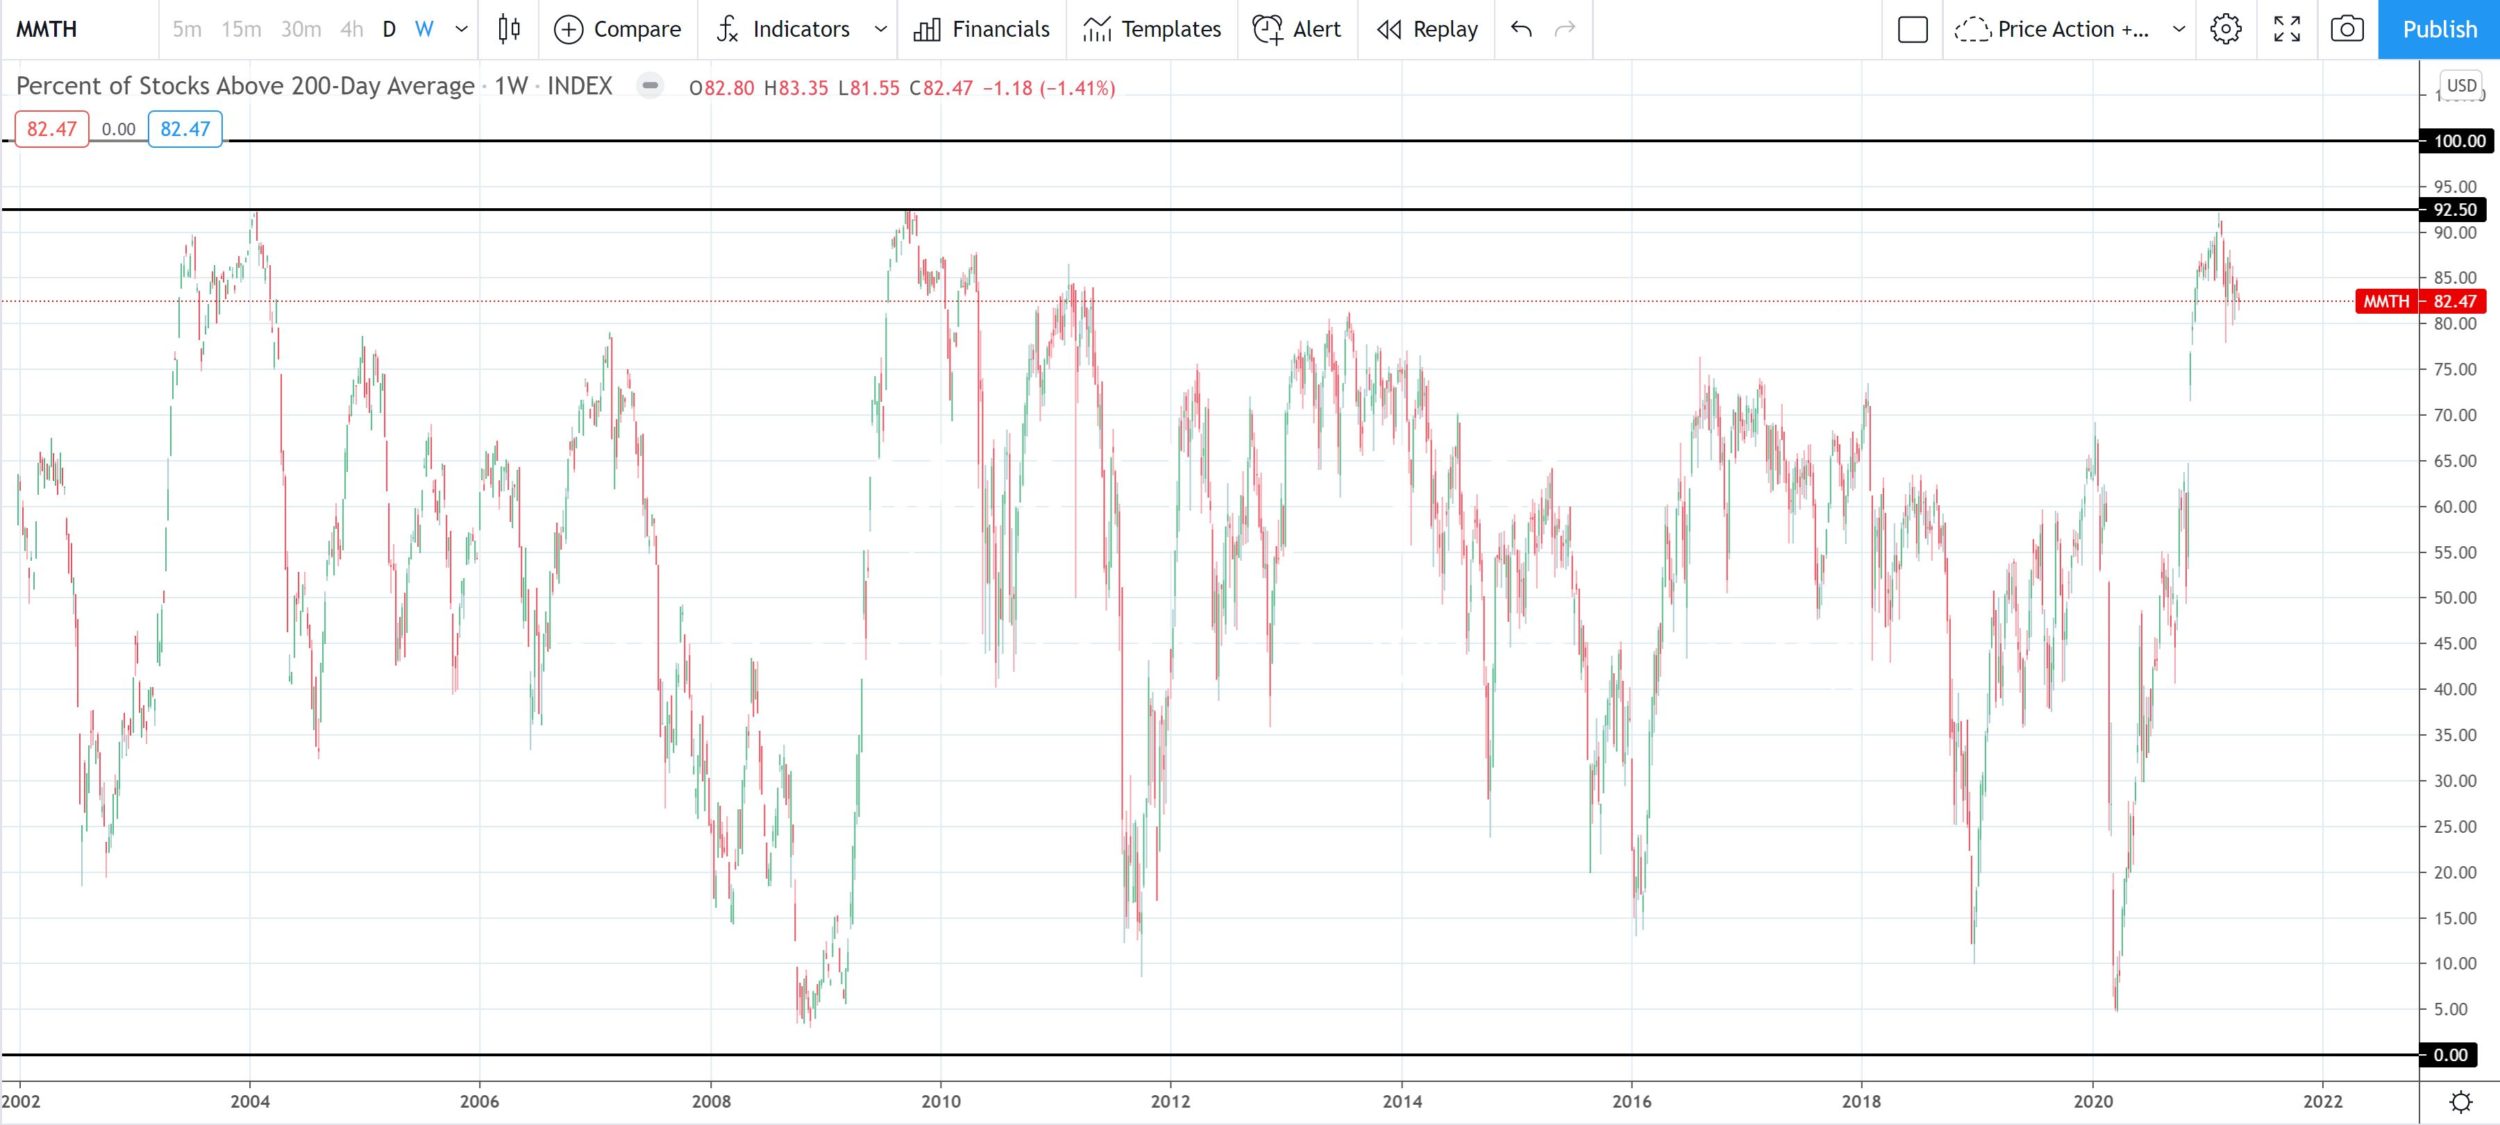
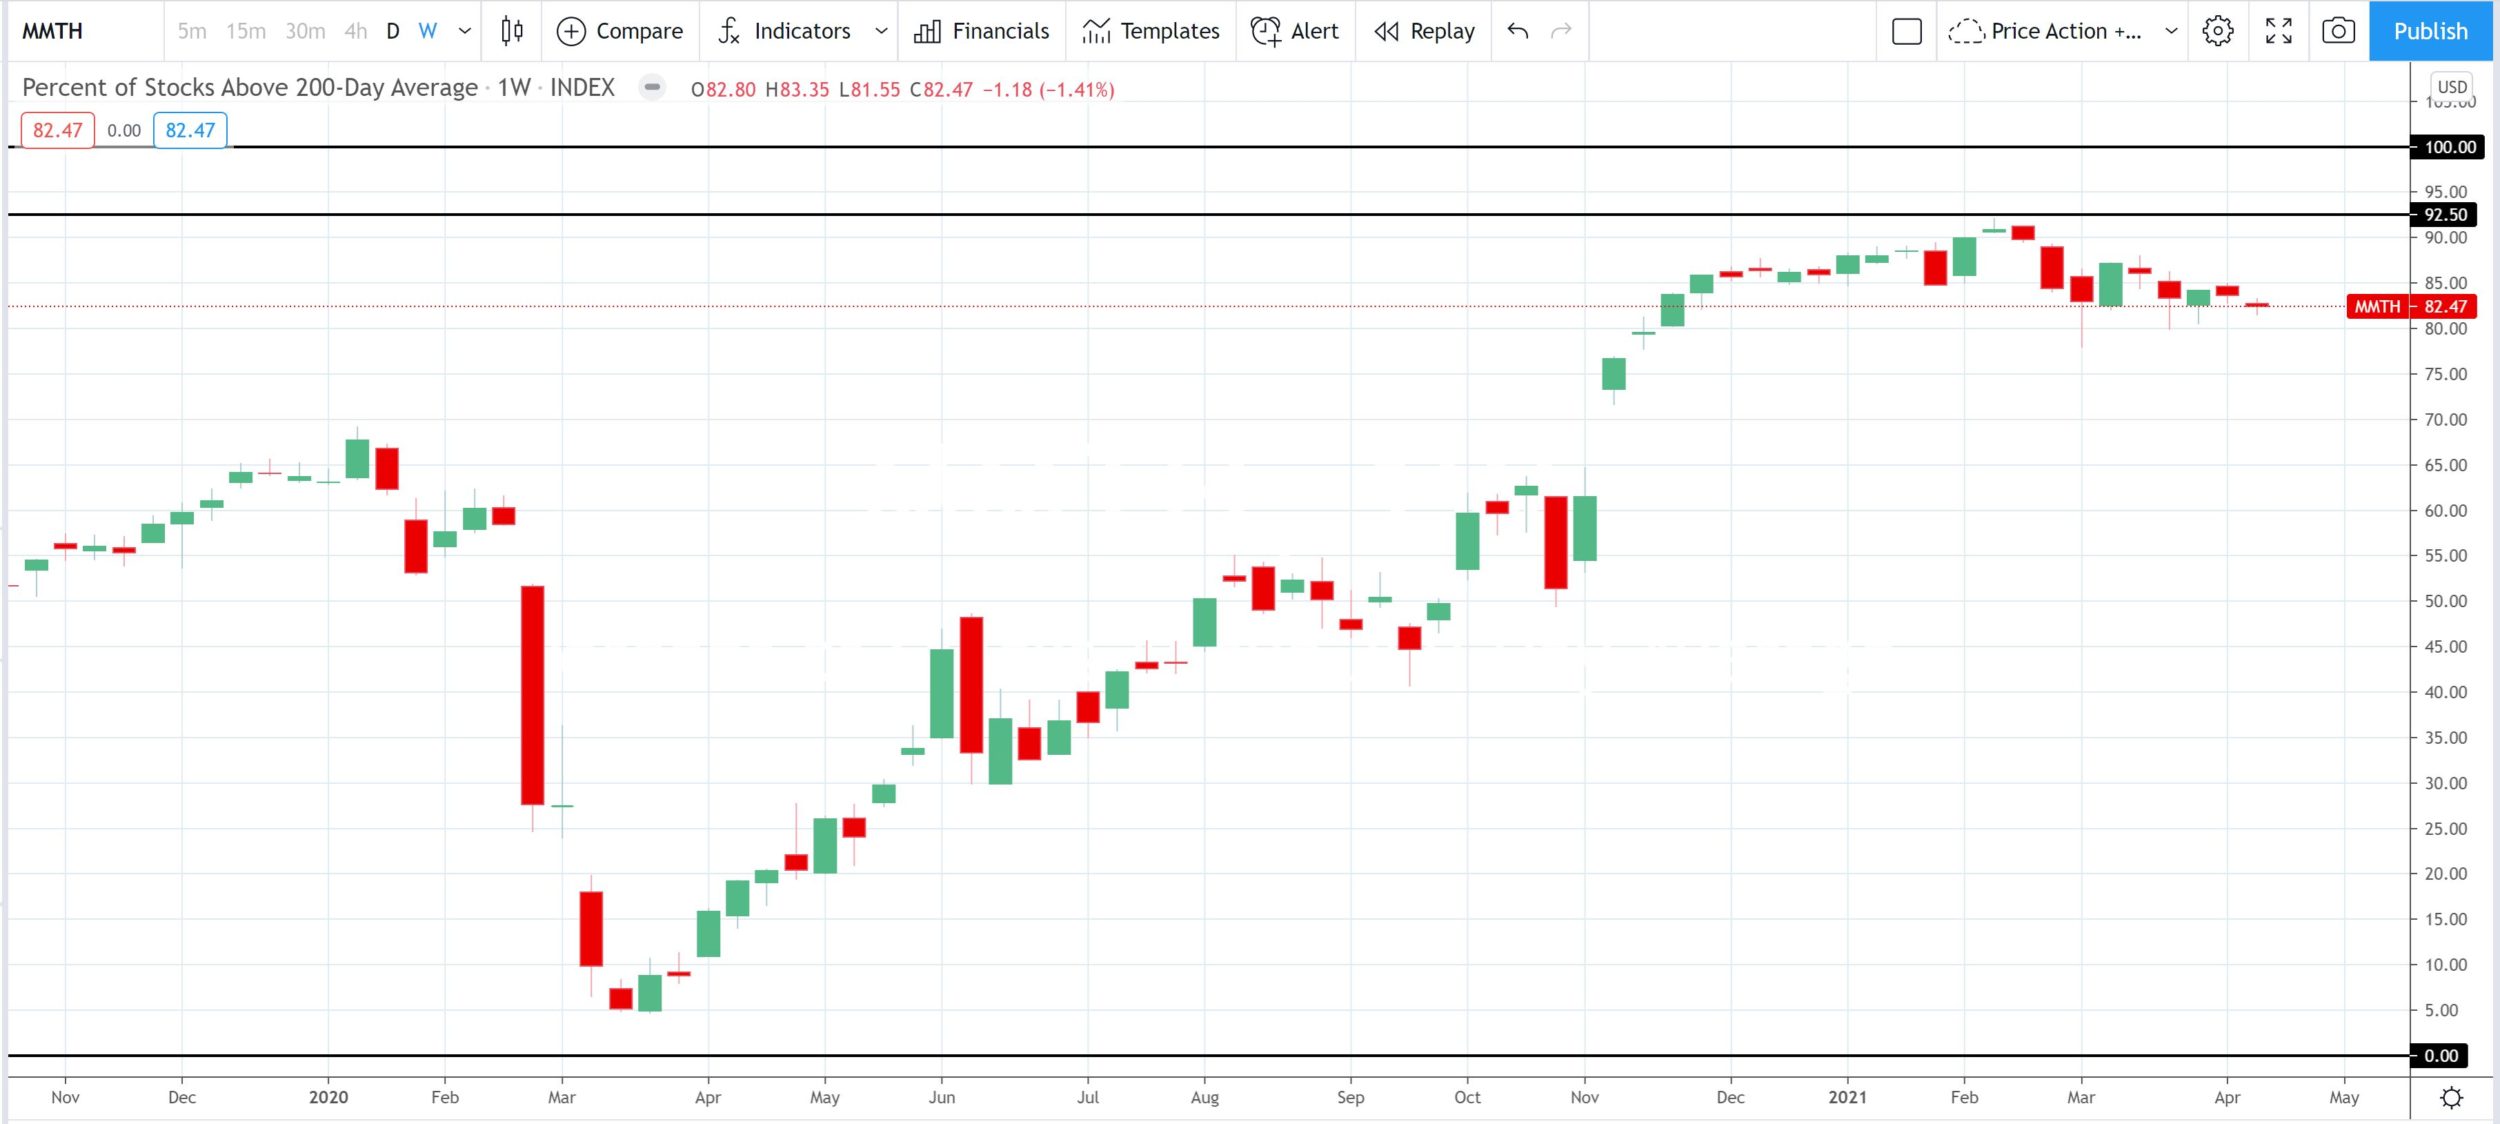
- % Stocks above their 200 Day Moving Average Index: The Percentage of stocks above their 200 Day Moving Average remains above the 85% region. The first chart below gives a perspective of this current level and shows the previous peaks near 92.50% and how there often tends to be some mean-reversion once such lofty levels are reached. The second, expanded, chart shows the continued struggle under the 92.50% level.
% of US Stocks above the 200 Day Moving Average: watch for any further reaction at the 92.50% region:
% of US Stocks above the 200 Day Moving Average (expanded): holding below 92.50%:
-
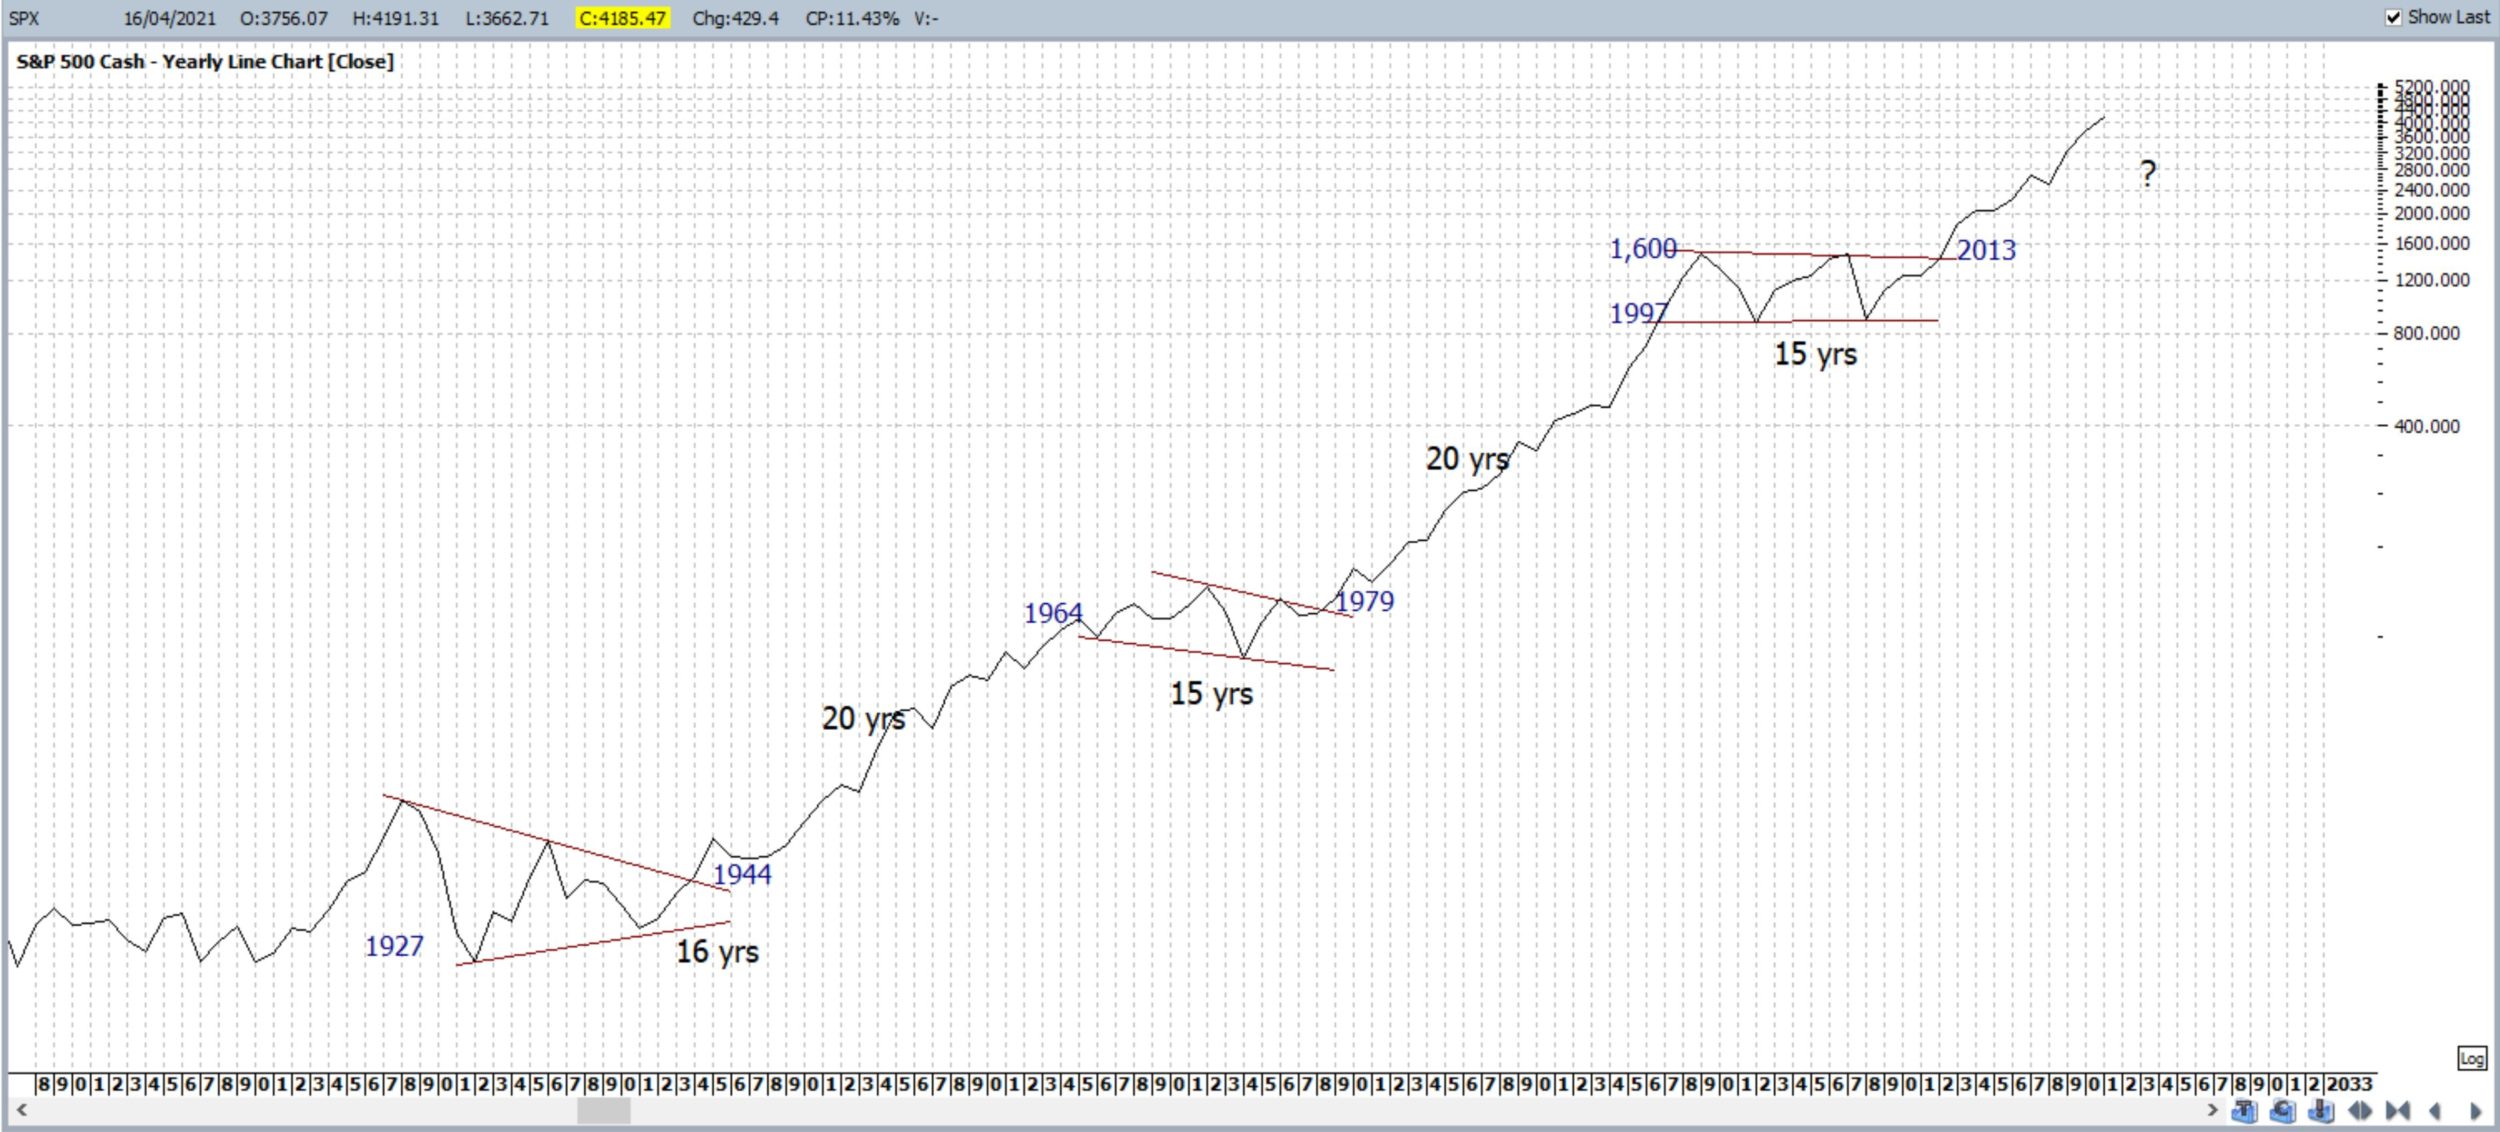
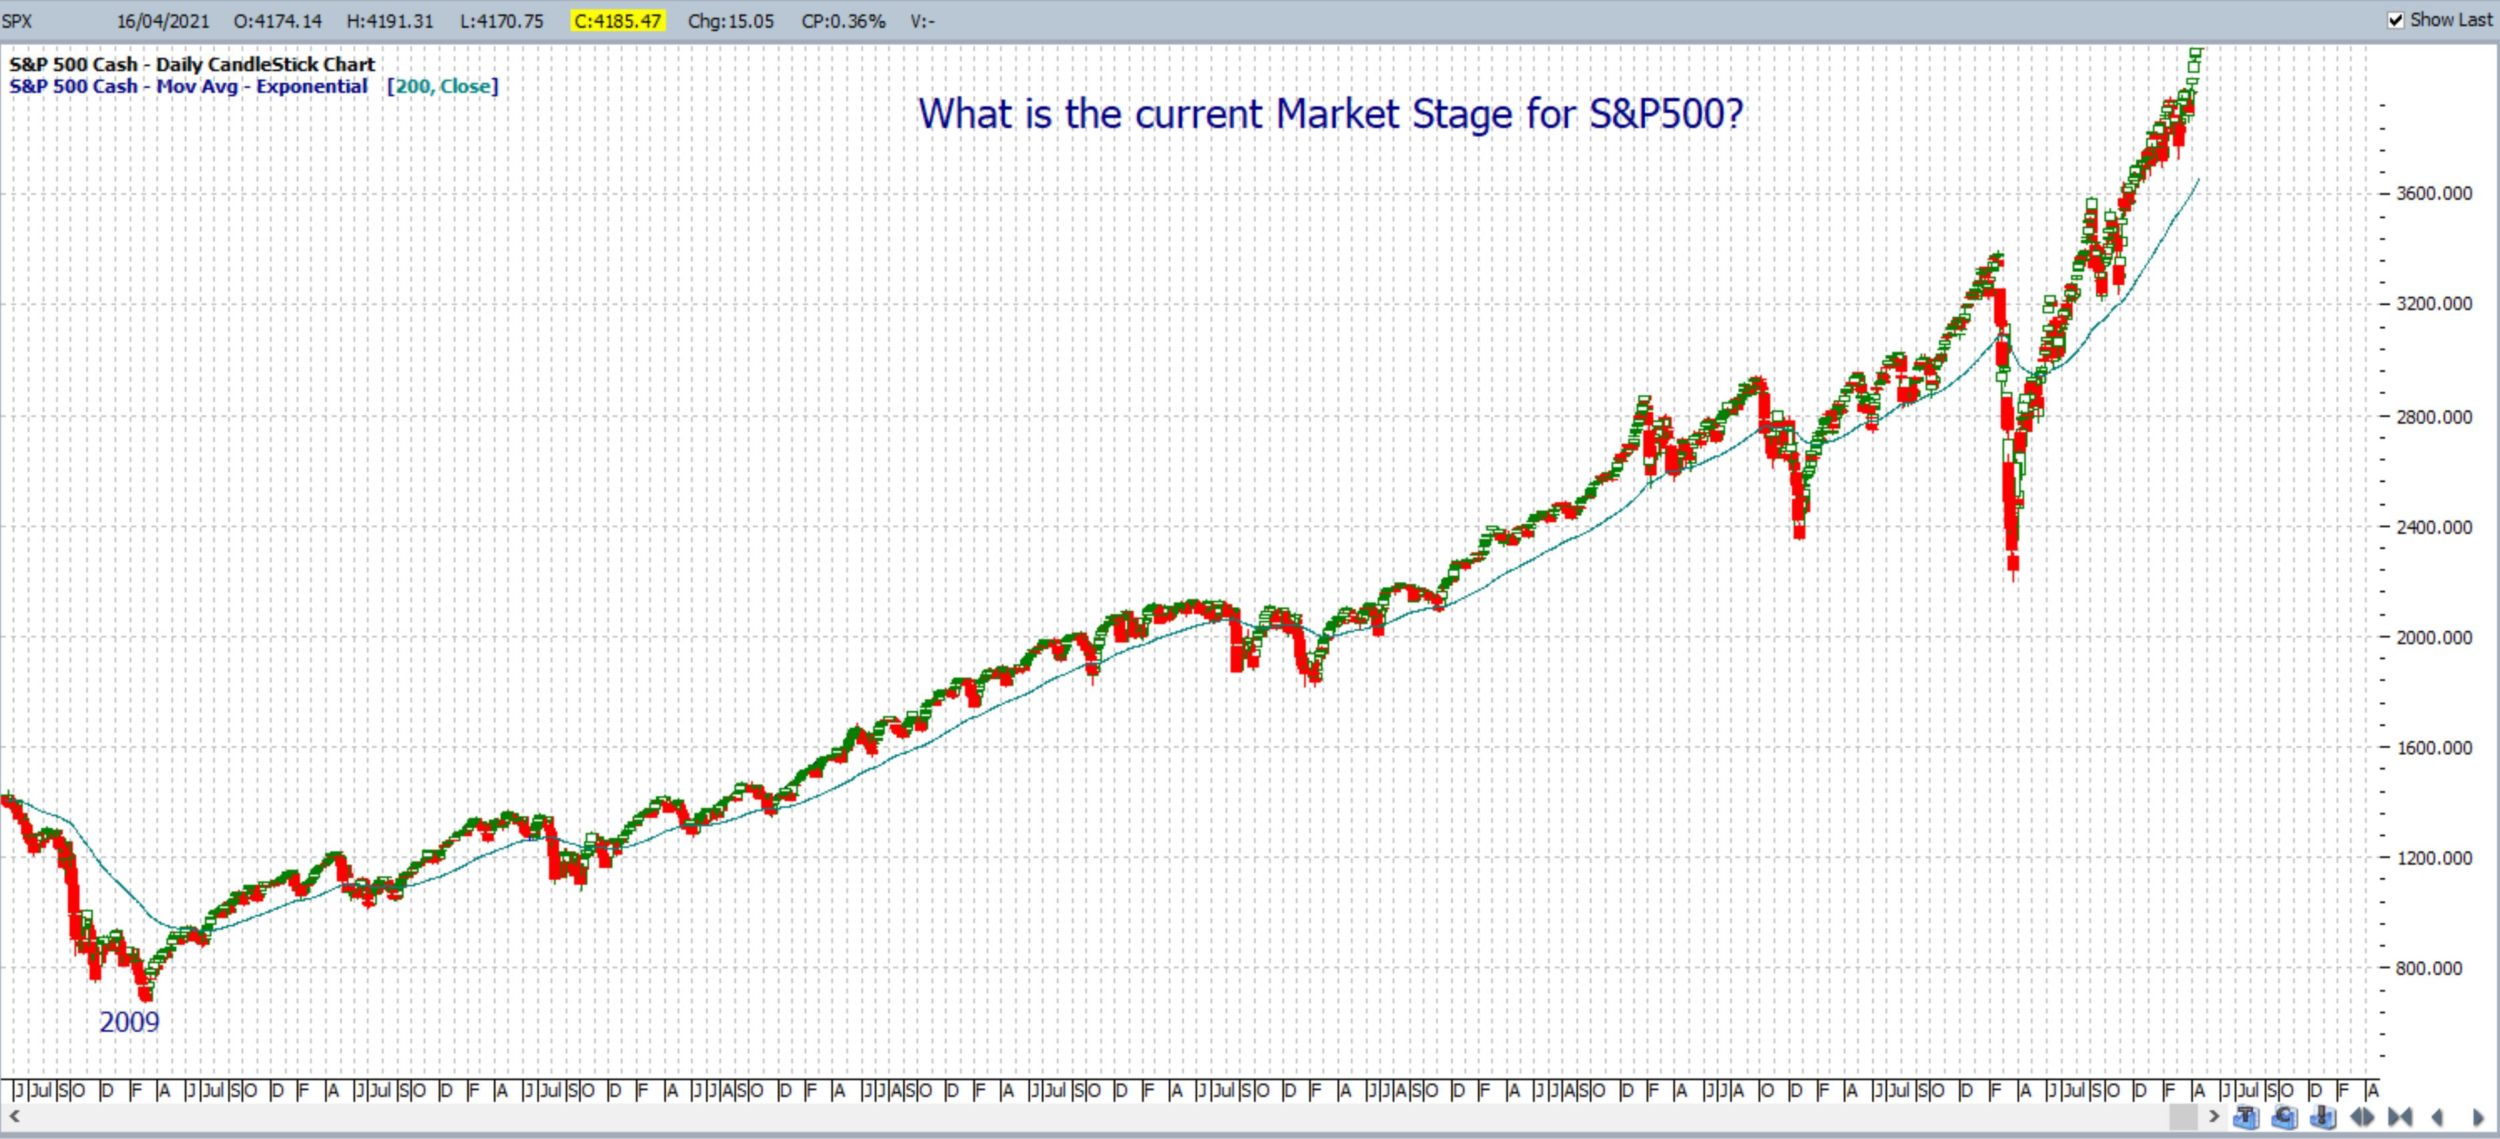
- S&P500: Keep the bigger picture in perspective with the recent moves as this chart suggests there is a lot more room to move with the overall bullish run. However, this does not discount the odd pullback along the way as trends do not travel in straight lines forever; they tend to zig and zag their way along either bullish or bearish paths. Note how the recent Covid dip does not even figure on this chart!
S&P500 yearly: keep this latest move in perspective:
-
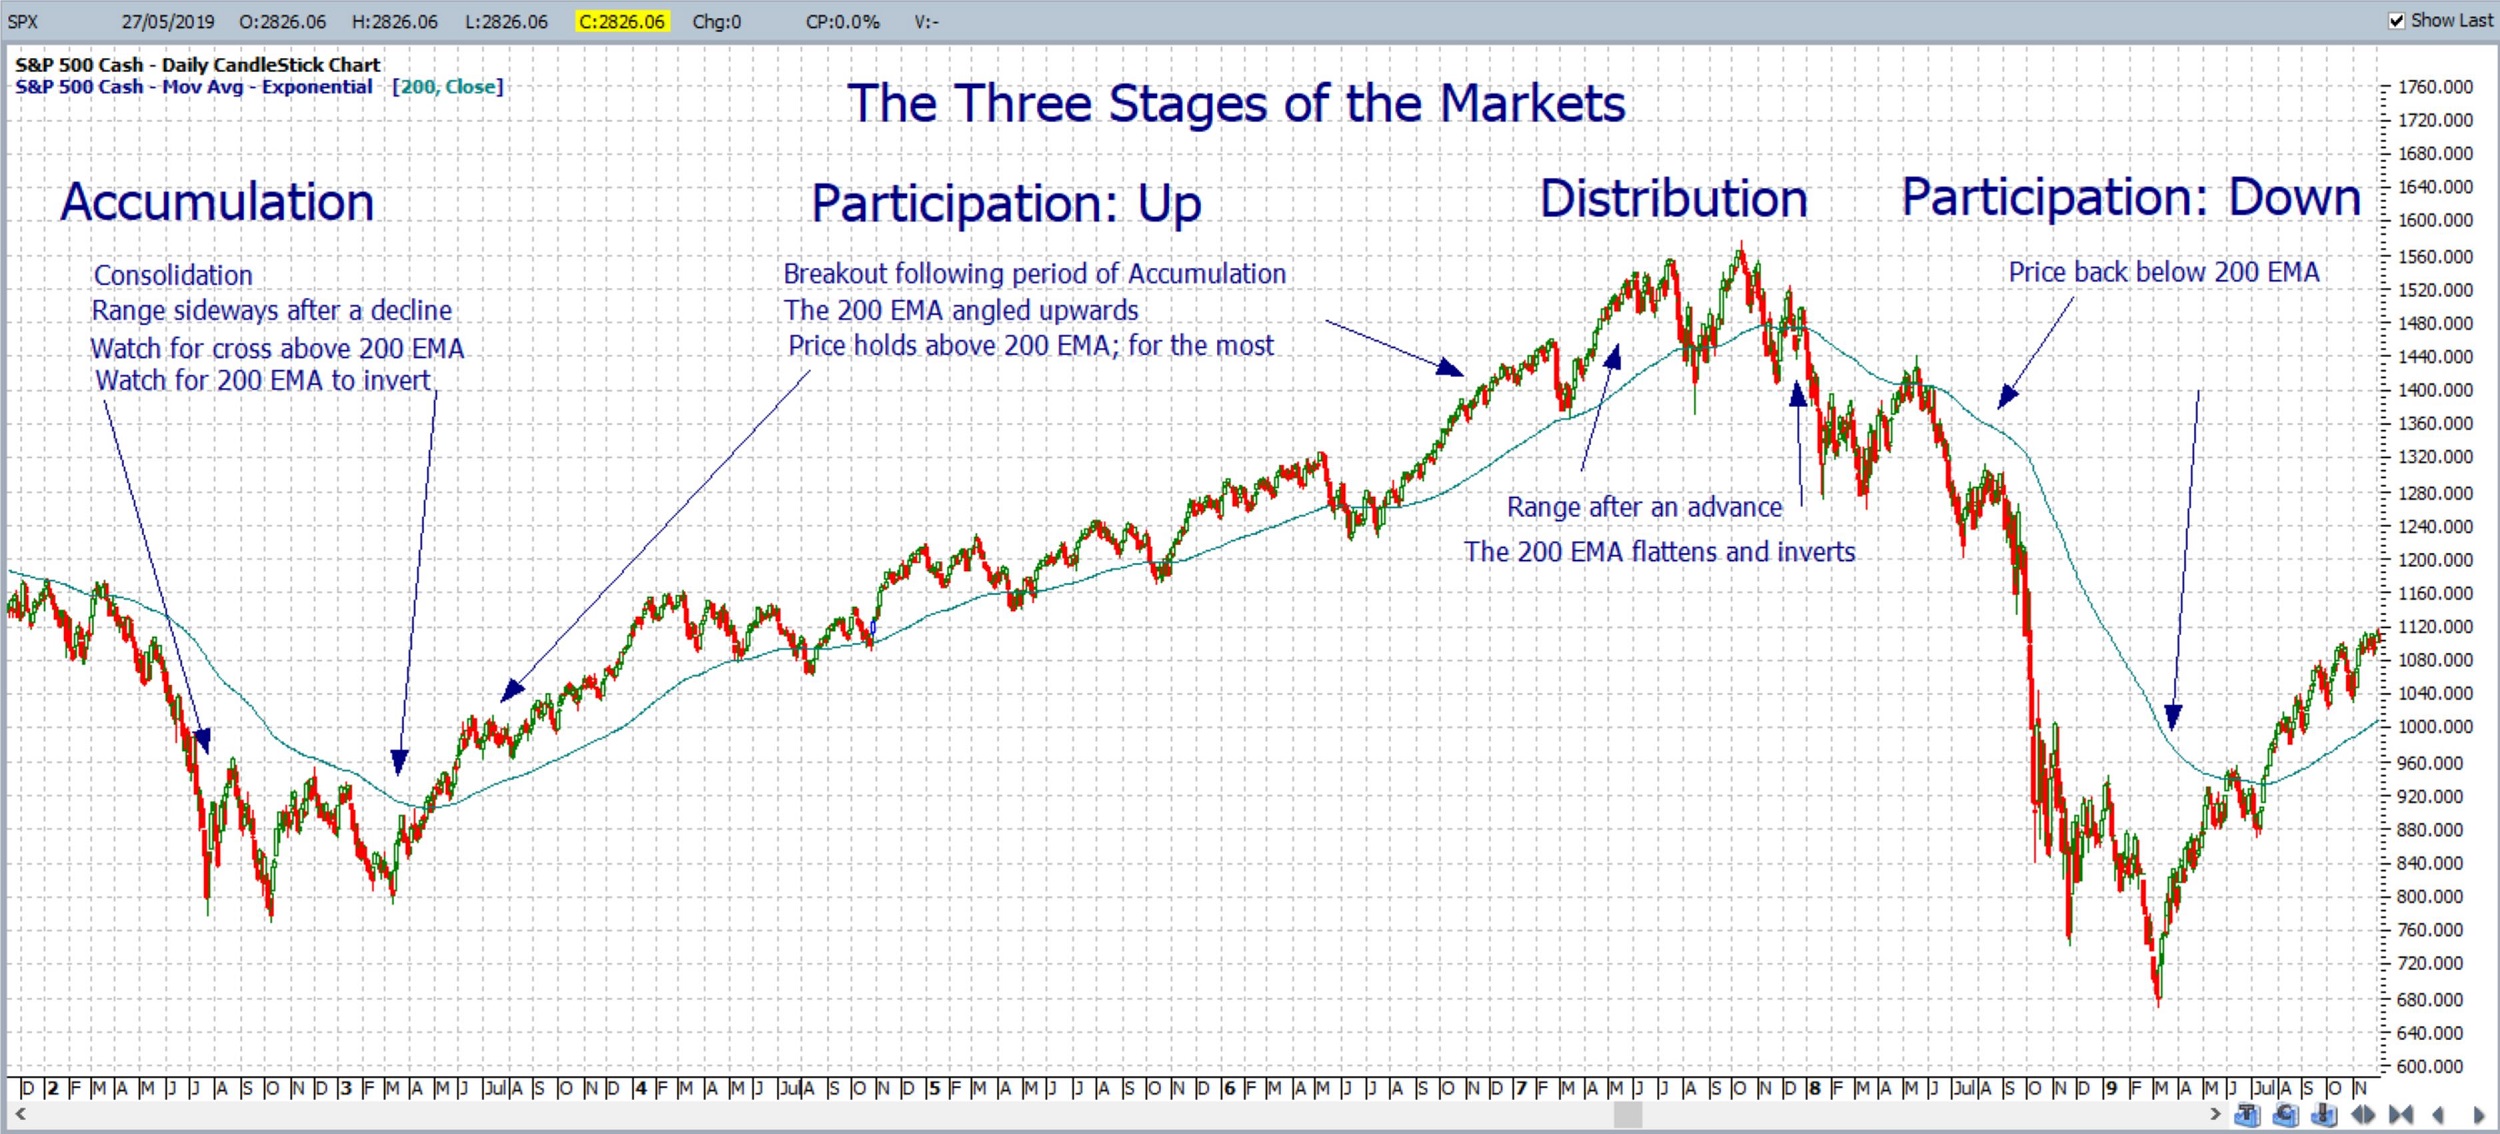
- Market Phases: It is important to recall the three main types of market phases: Accumulation, Participation (Up and Down) and Distribution. Traders should monitor the chart of the S&P500 chart for any Distribution type activity that might eventually lead to Participation Down; especially as the S&P500 trades up at an all-time High. The chart below shows how the S&P500 evolved in the years leading up to, and during, the Global Financial Crisis (GFC). Note how the Distribution phase evolved over a period of many months and there was a double test of the all-time High region. Keep this in mind with the current market action on the S&P500.
S&P500 market phases: Global Financial Crisis 2007-2009:
S&P500: keep watch for any Distribution type of activity:
-
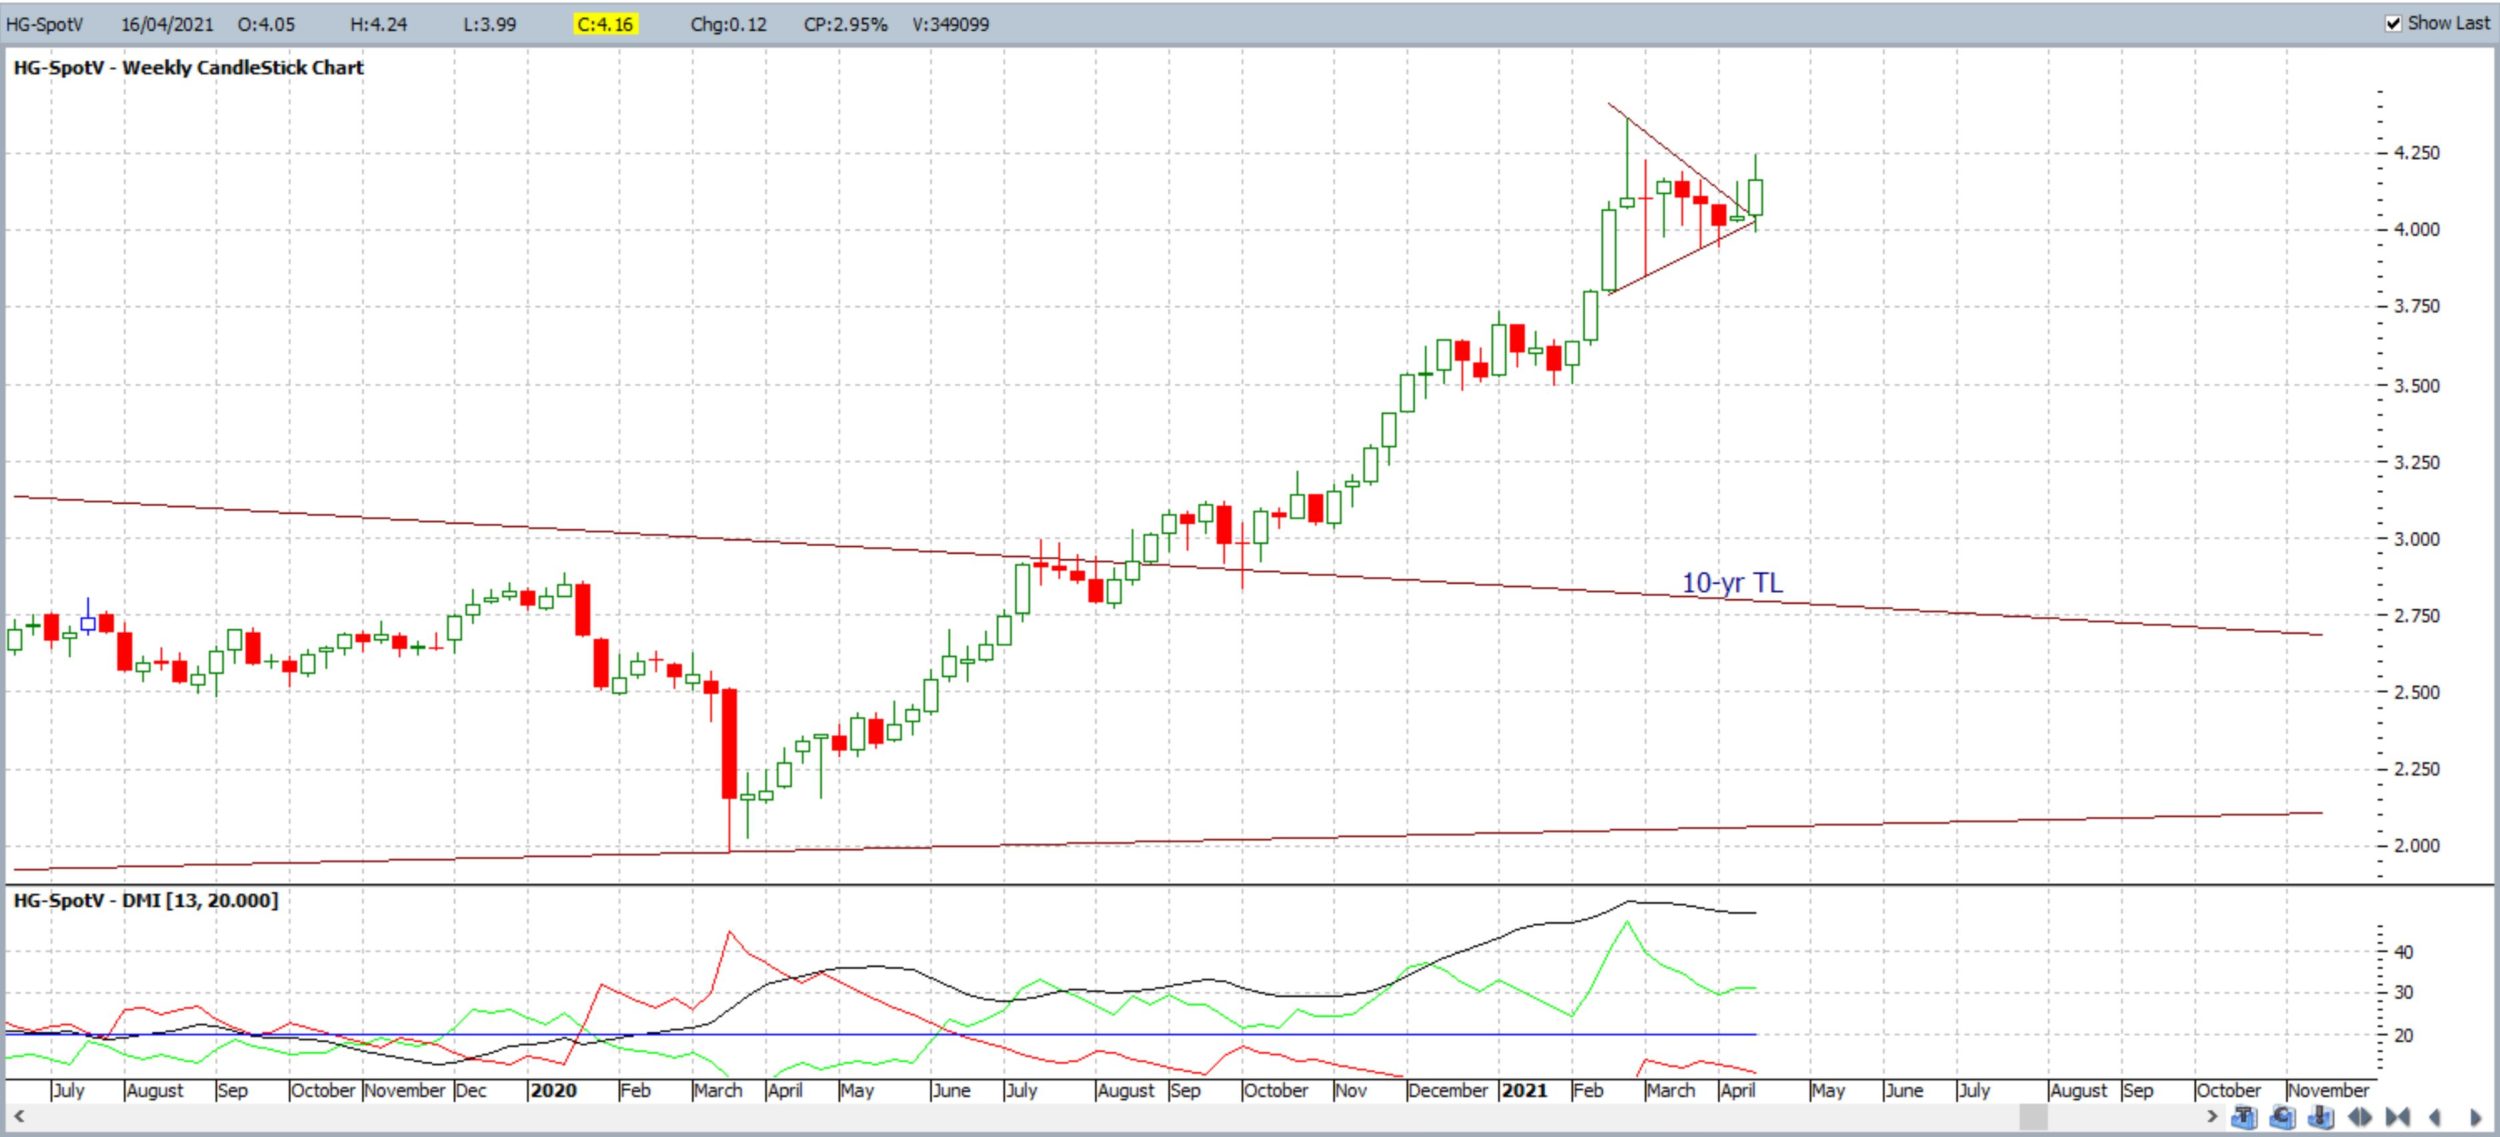
- Copper: Copper is often viewed as one metric of economic health and closed with a bullish weekly candle and has made a bullish b/o from the Bull Flag so watch for any continuation here.
Copper weekly: watch for any continued Bull Flag b/o move:
-
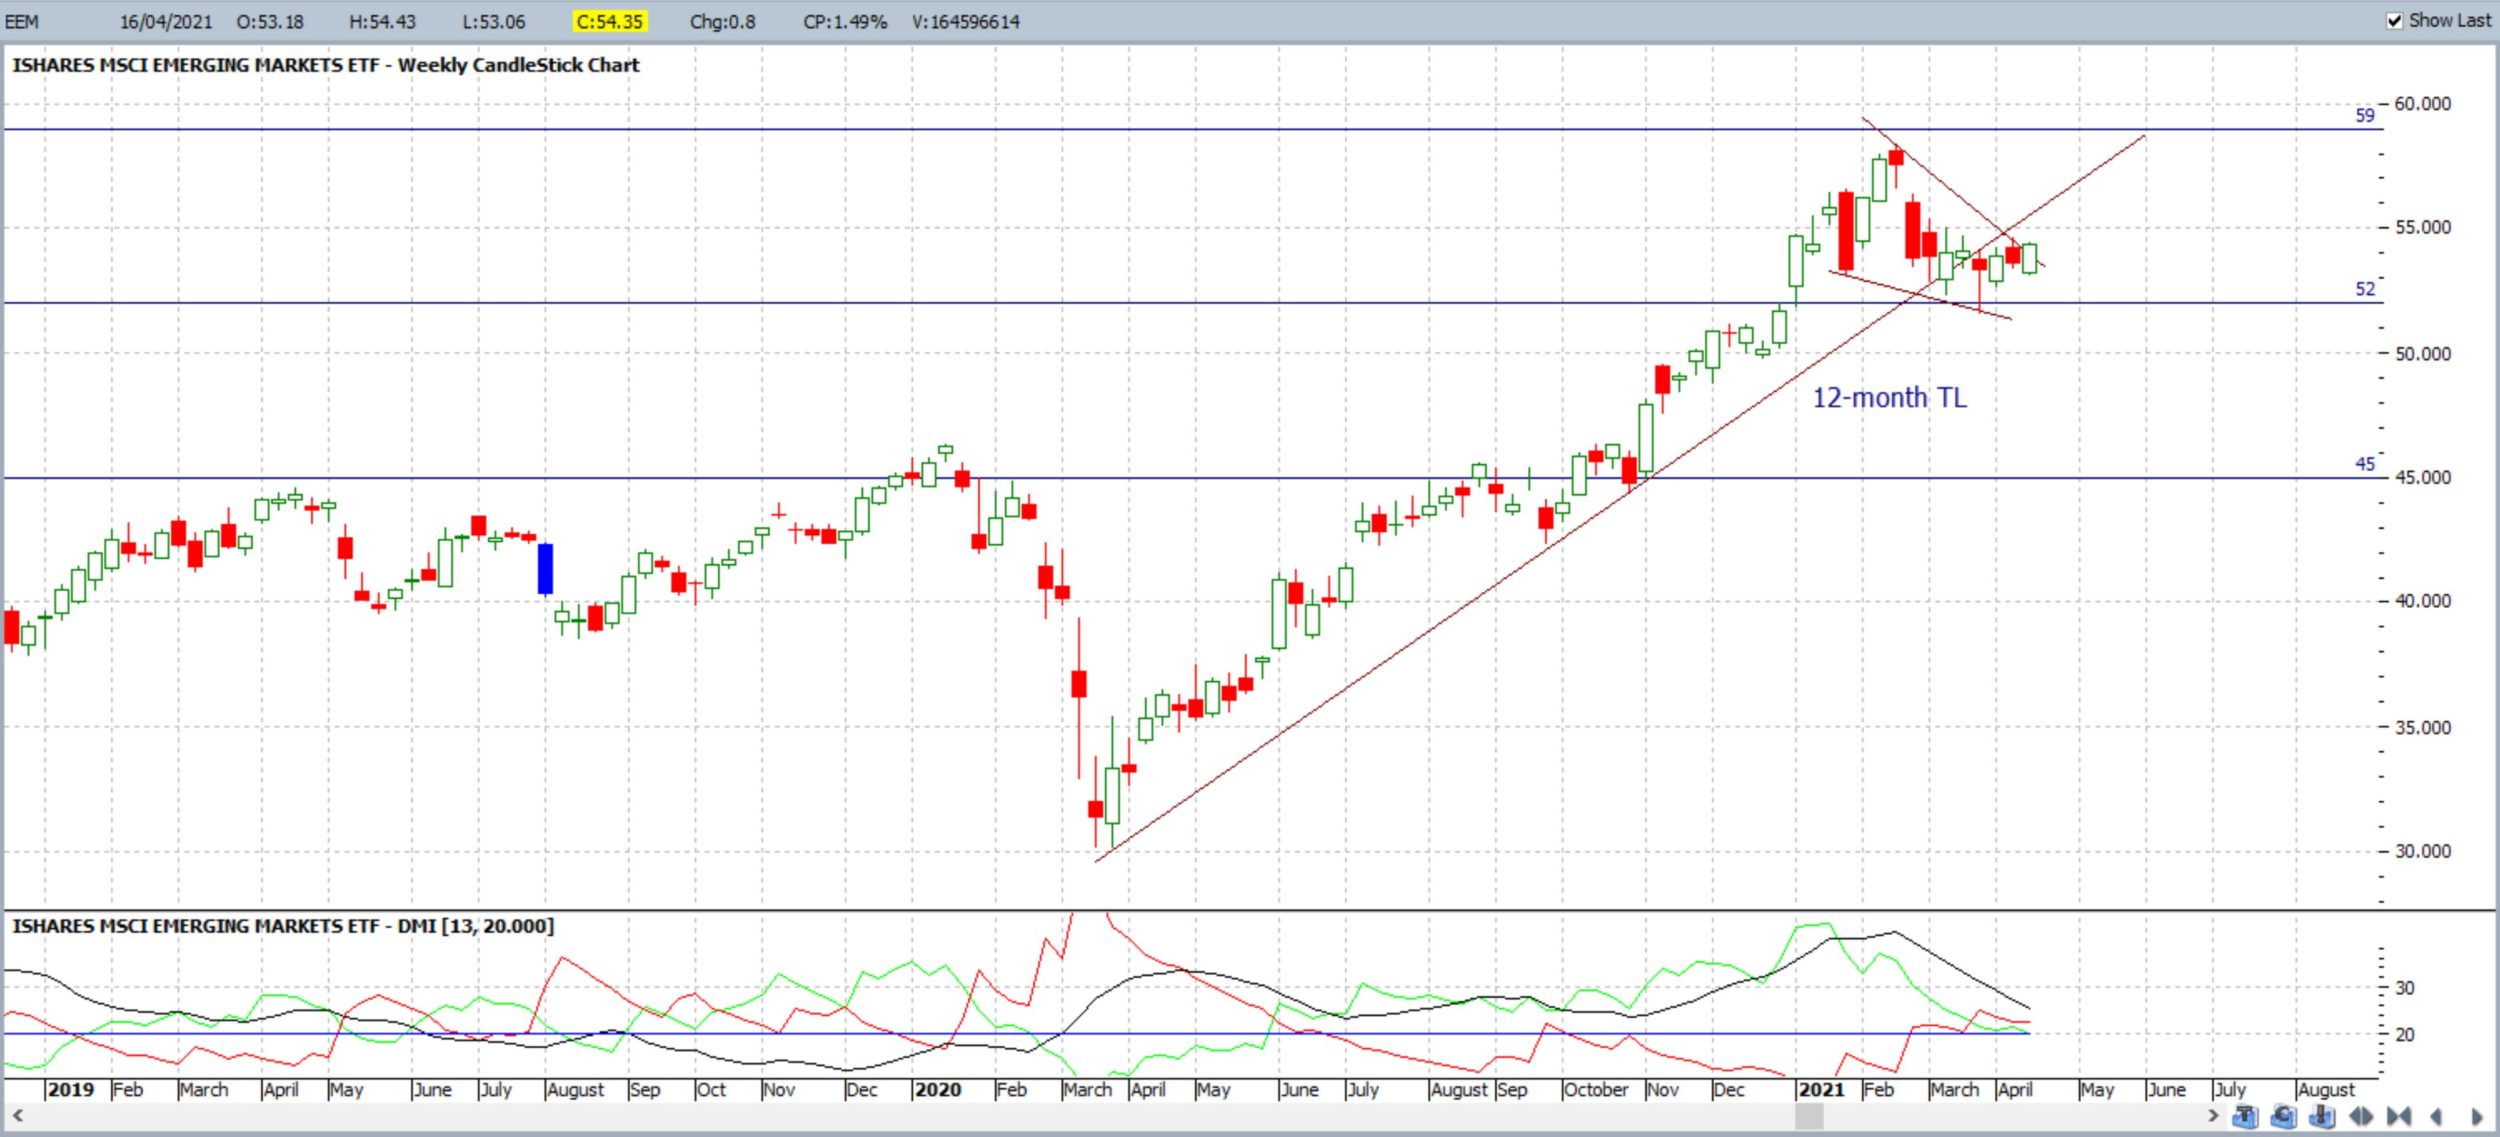
- Emerging Markets: The Emerging market ETF, EEM, closed with a bullish weekly candle and, whilst still below the 12-month support trend line, there looks to be a new Bull Flag breakout so watch for any continuation.
EEM weekly: watch for any Bull Flag continuation:
-
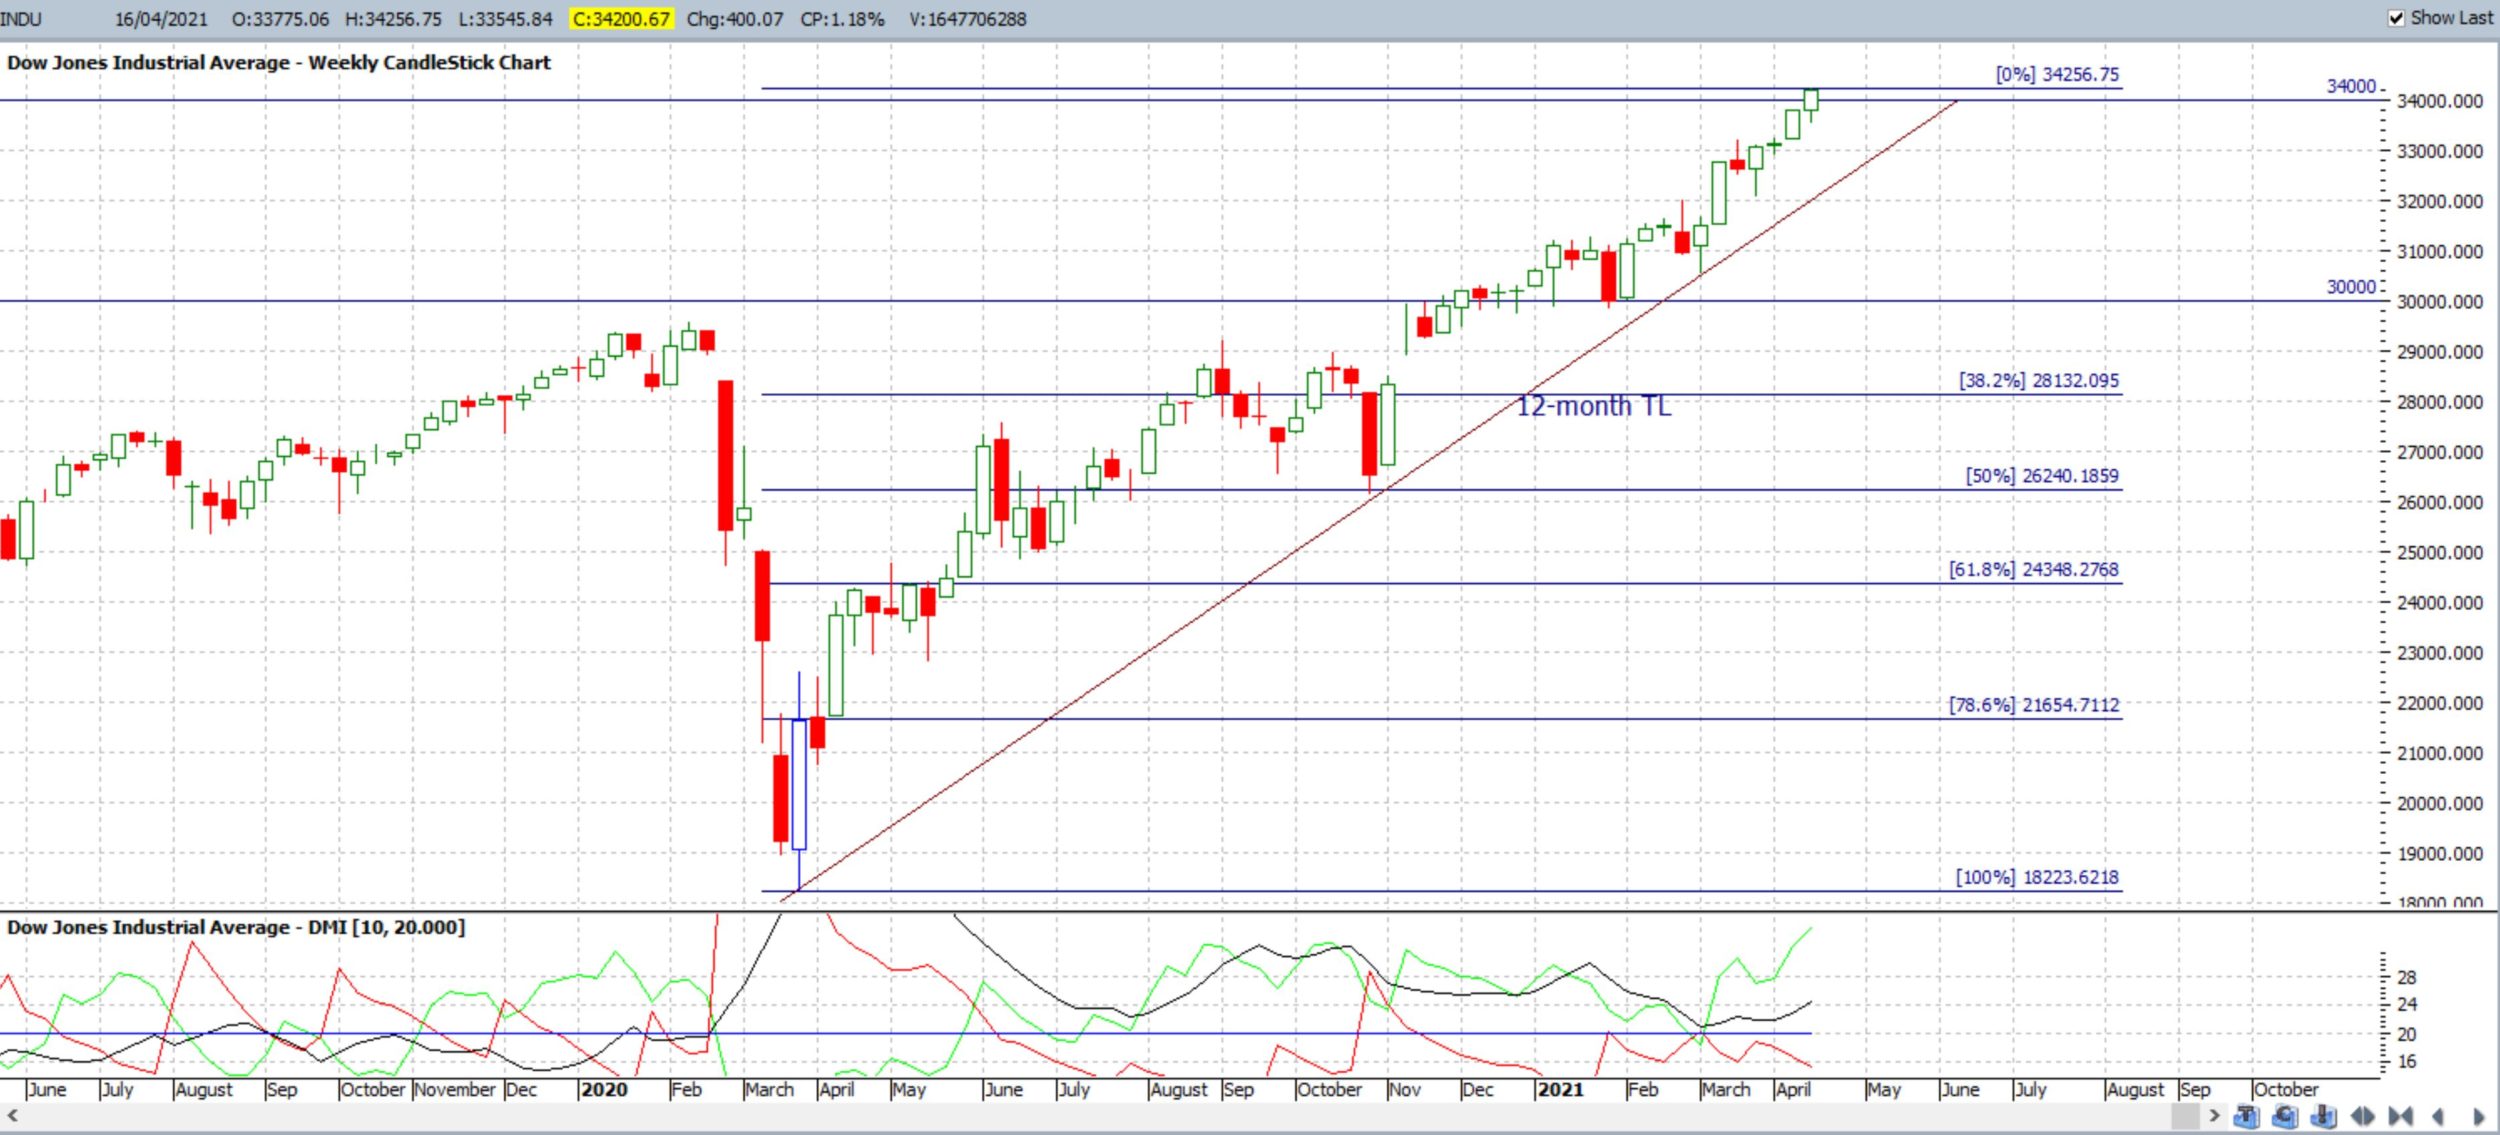
- DJIA: The DJIA closed with a bullish weekly candle and at a new all-time High above 34,000.
DJIA weekly: watch 34,000 for any new make or break.
-
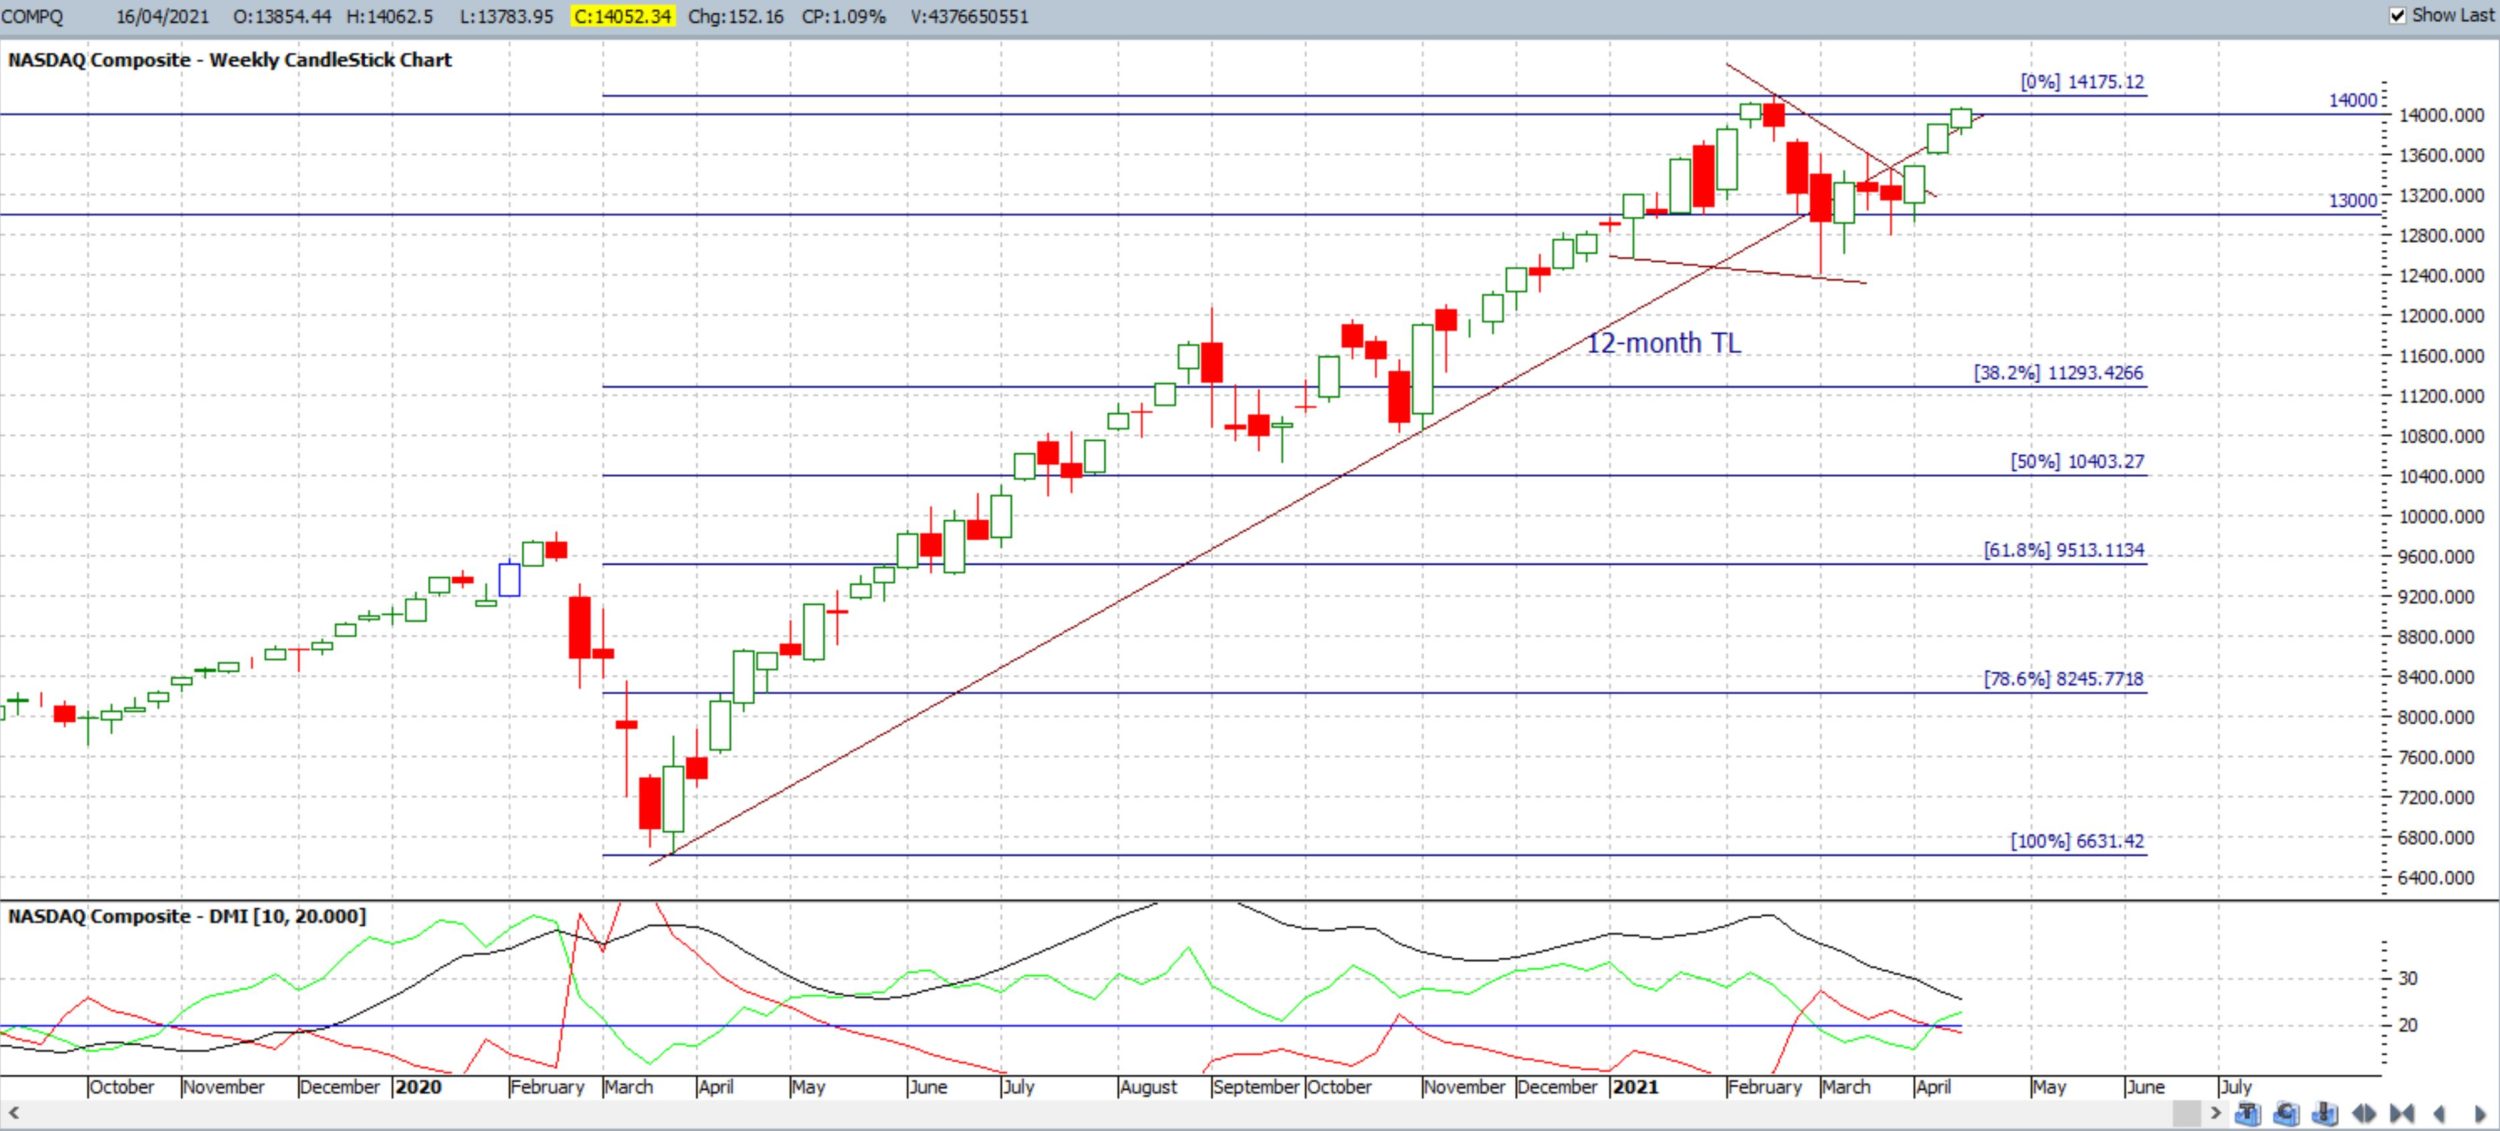
- NASDAQ composite: The NASDAQ Composite Index closed with a bullish weekly candle and the Bull Flag breakout is still underway so watch for any push to the previous all-time High.
NASDAQ weekly: watch for any continued Bull Flag:
-
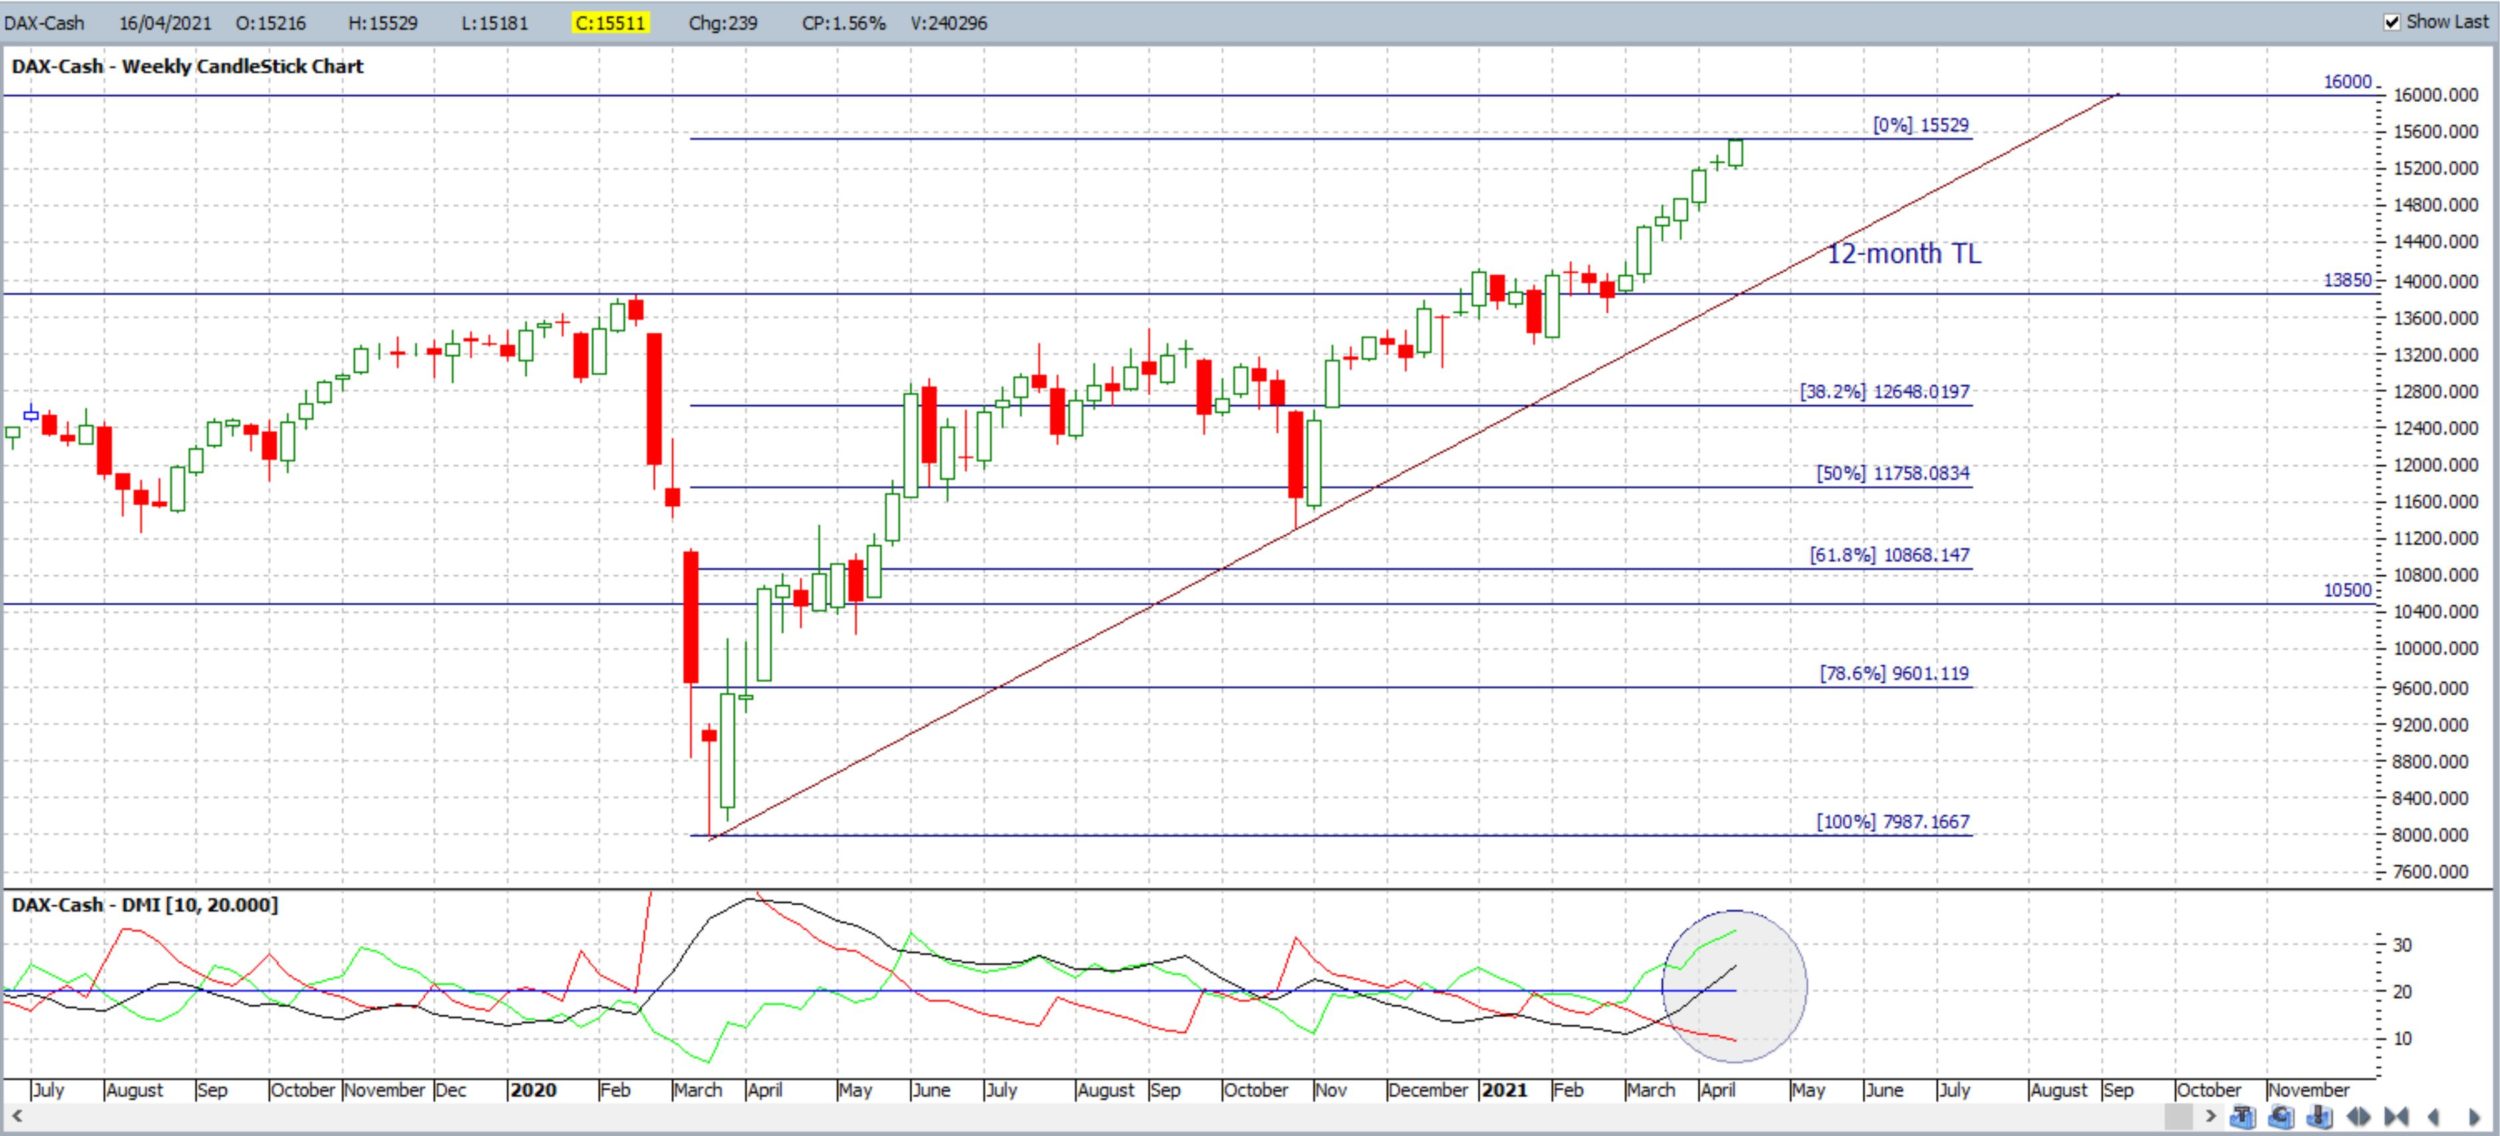
- DAX weekly: The DAX closed with a bullish weekly candle and remains above a 12-month support trend line.
DAX weekly: watch for any push to 16,000:
-
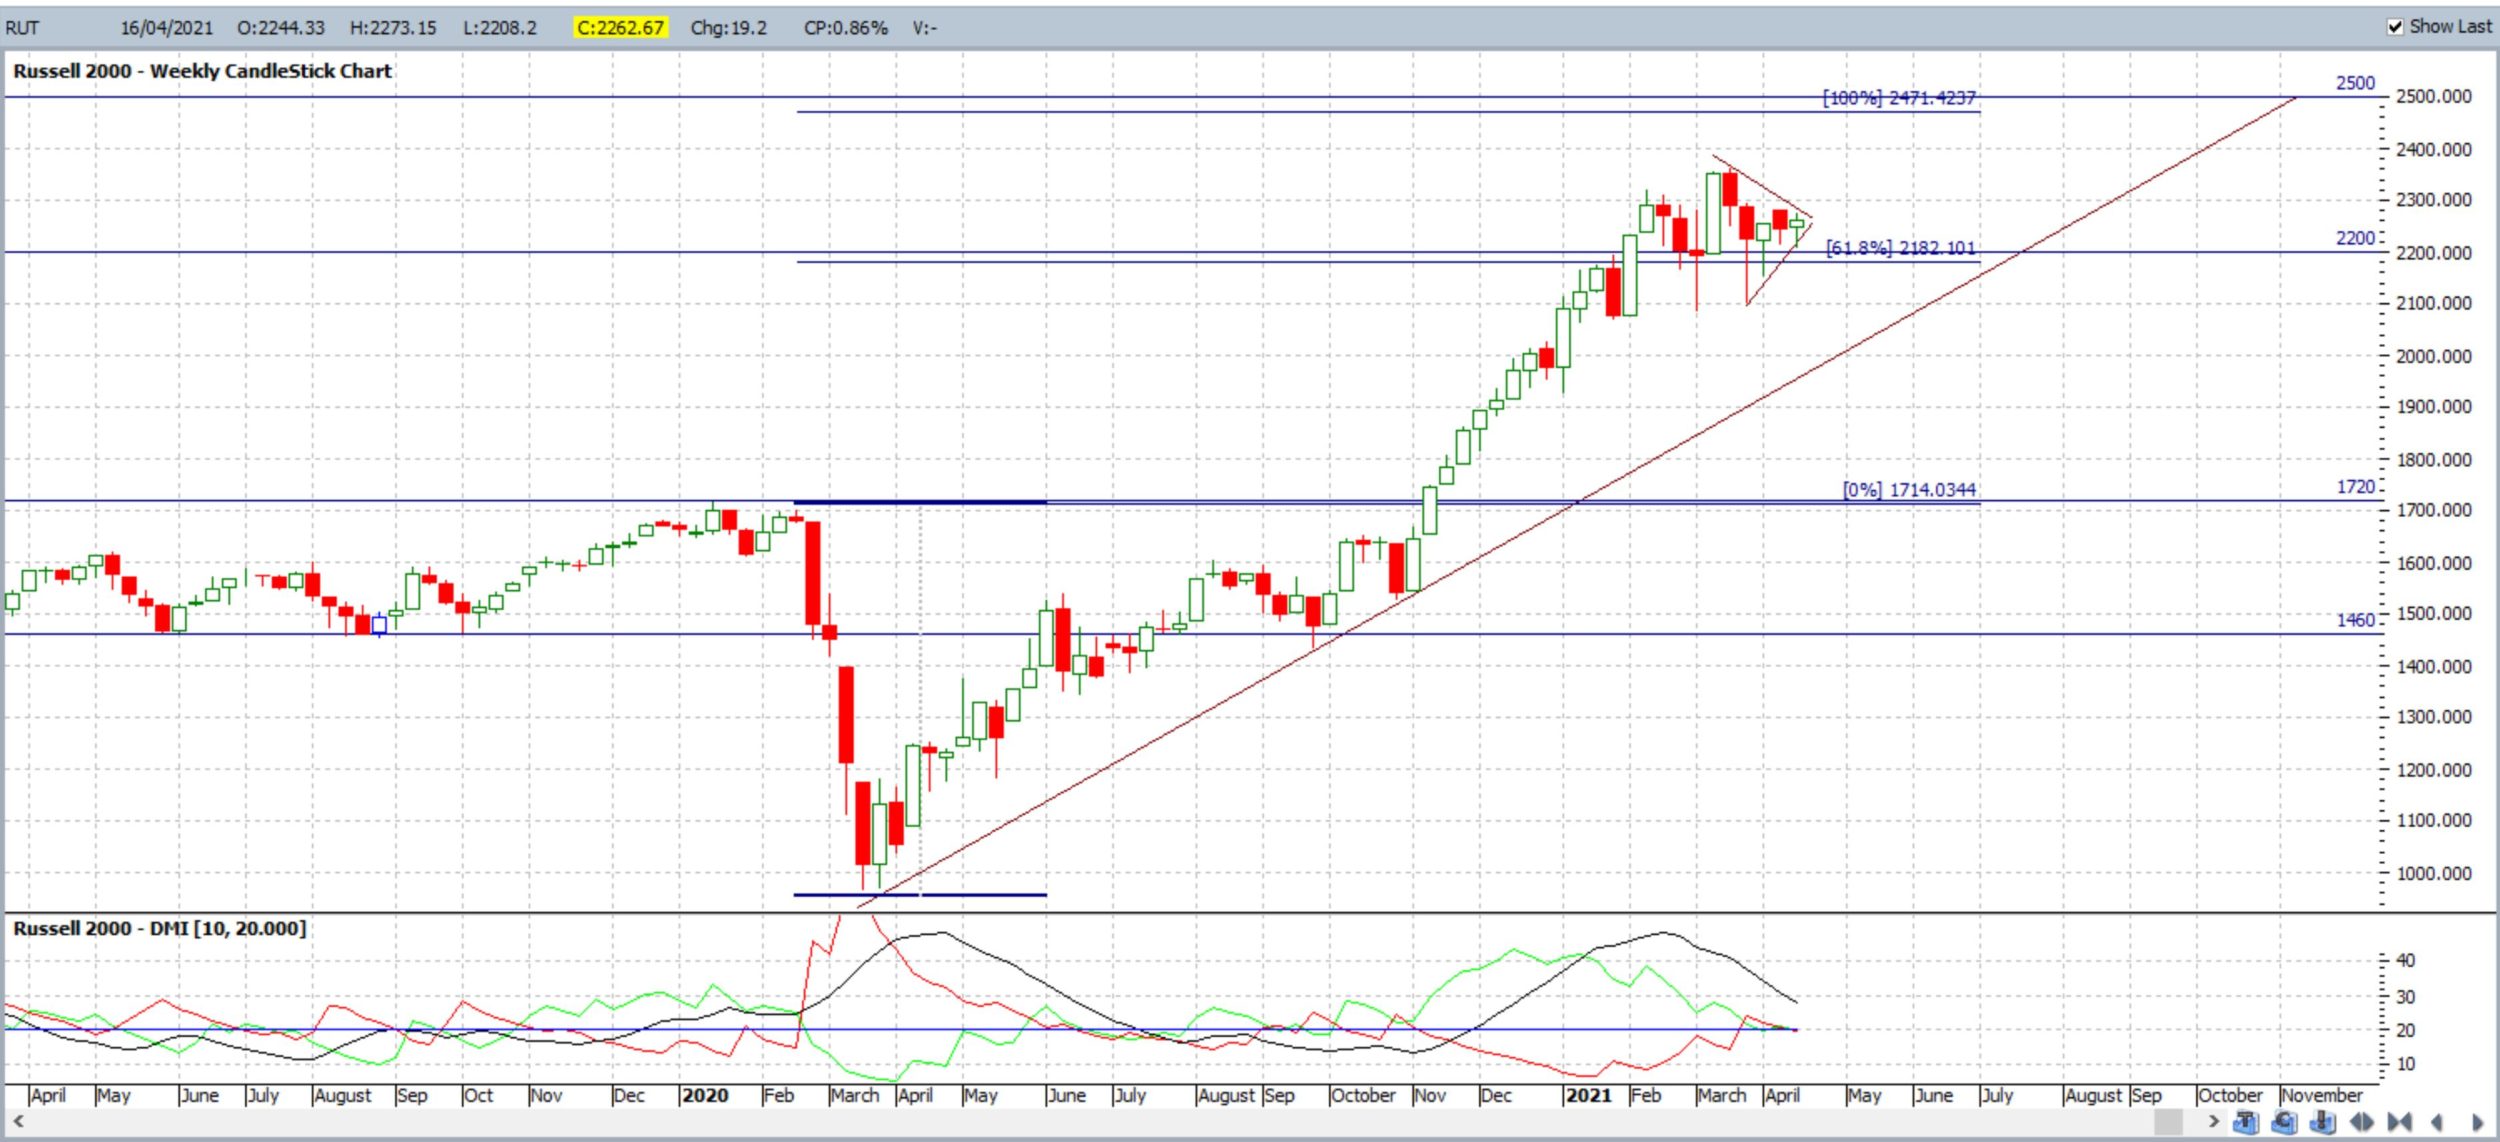
- Russell-2000: The Russell-2000 is often viewed as the ‘Canary in the Coal Mine’ for US stocks and the index closed with a bullish-coloured Spinning Top weekly candle. The Index continues to hold above the 61.8% Fibonacci extension of the Covid-induced Swing Low so watch for any push to the 100% level, circa 2,500.
RUT weekly: watch for any new triangle breakout:
-
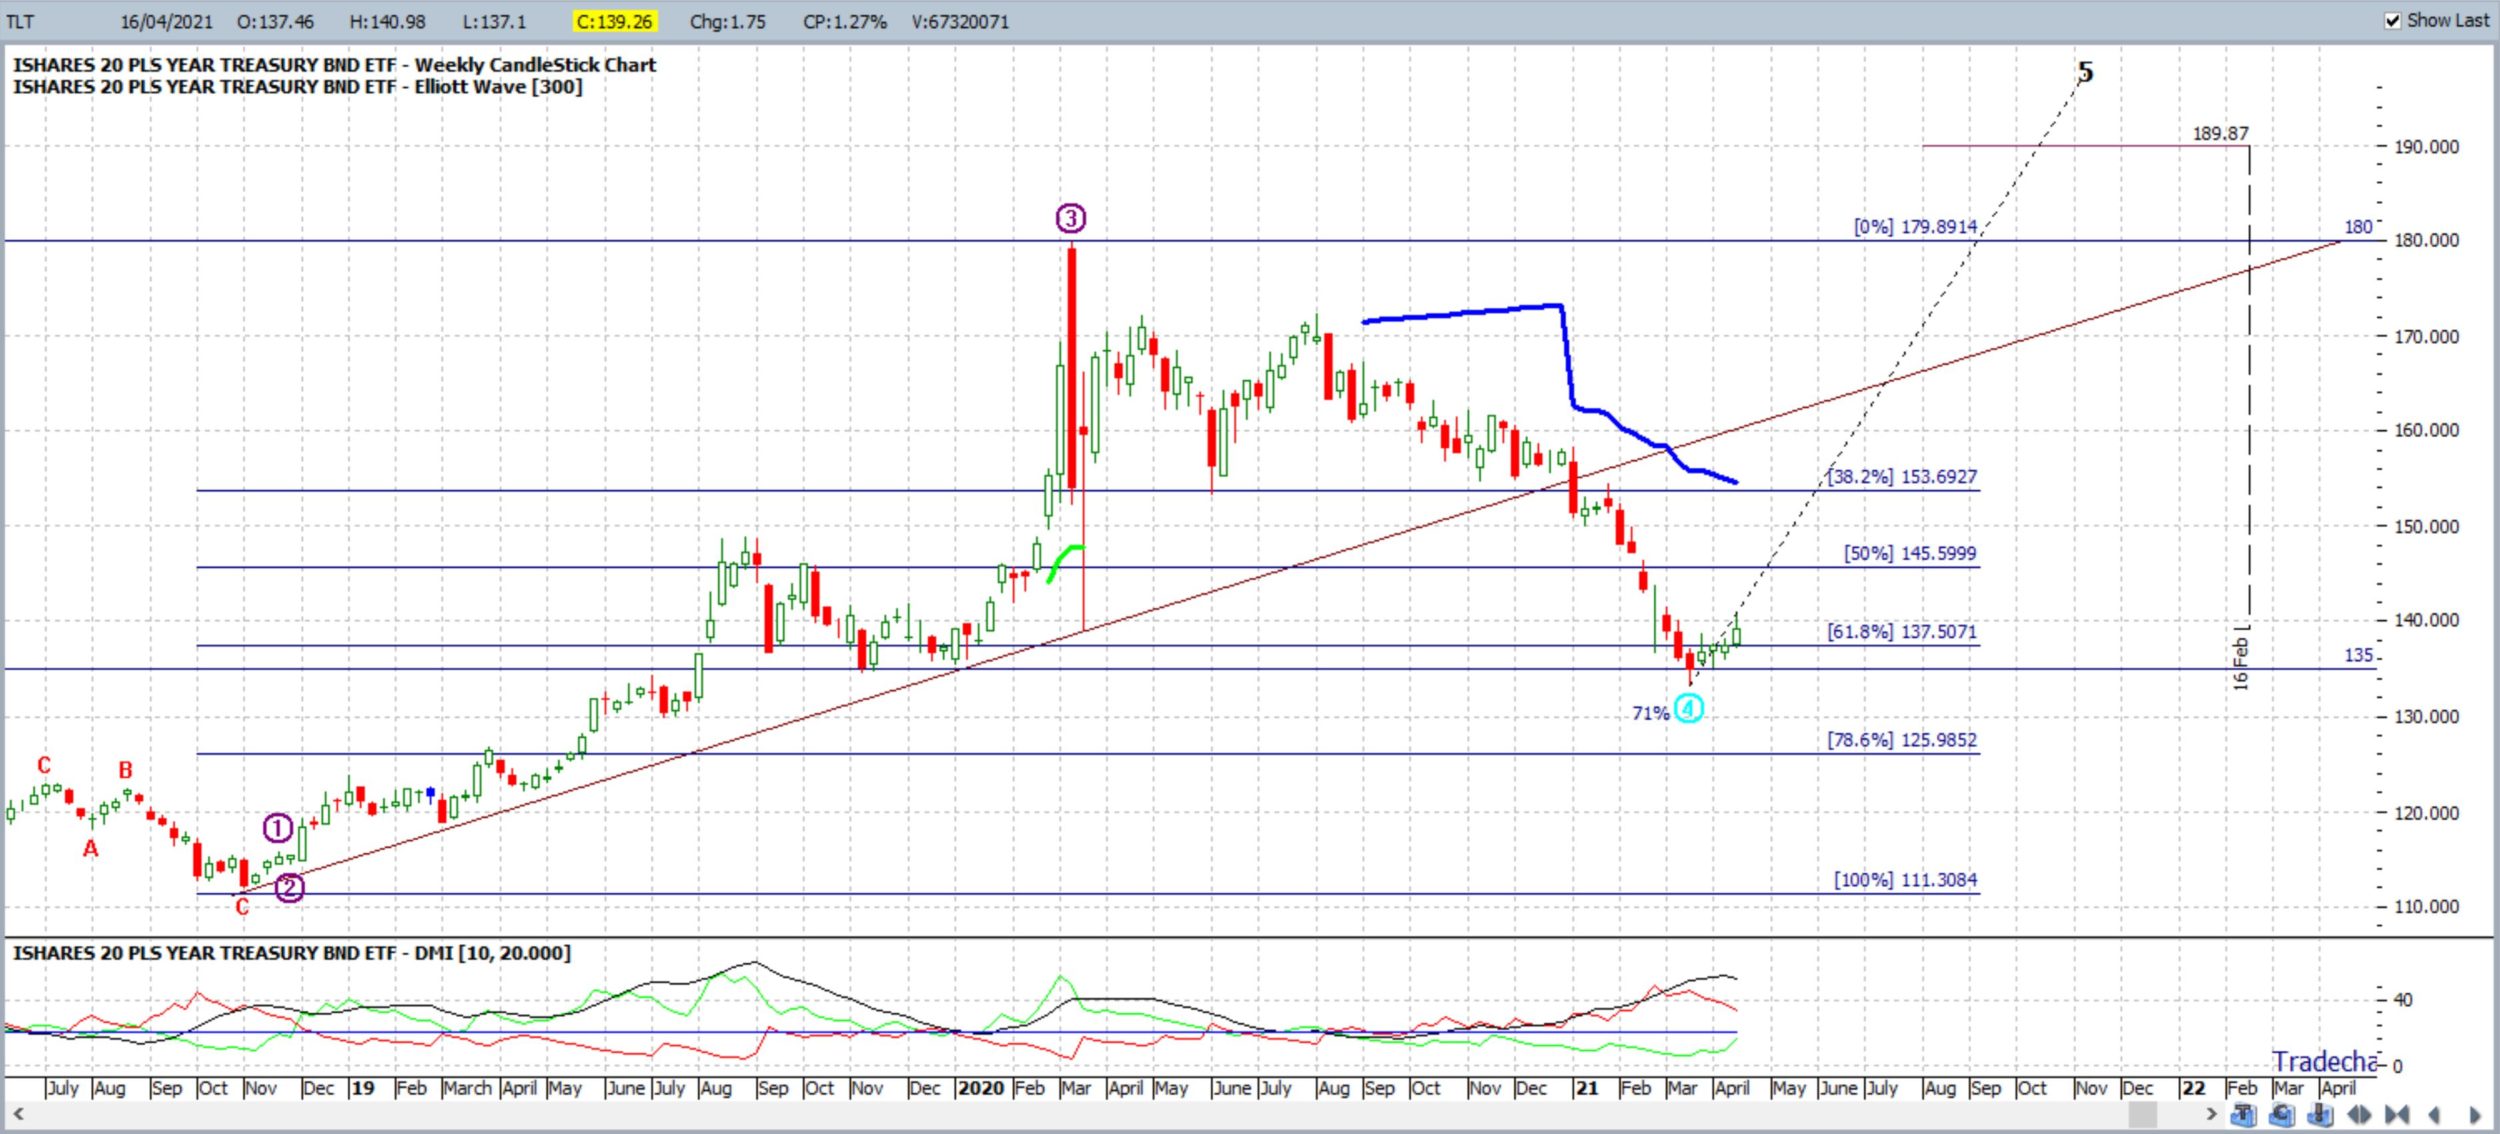
- Bonds / TLT: The Bond ETF, TLT, closed with a bullish weekly candle and my Elliott Wave indicator is still suggesting a potential uptrend.
TLT weekly: holding above the 135 level:
-
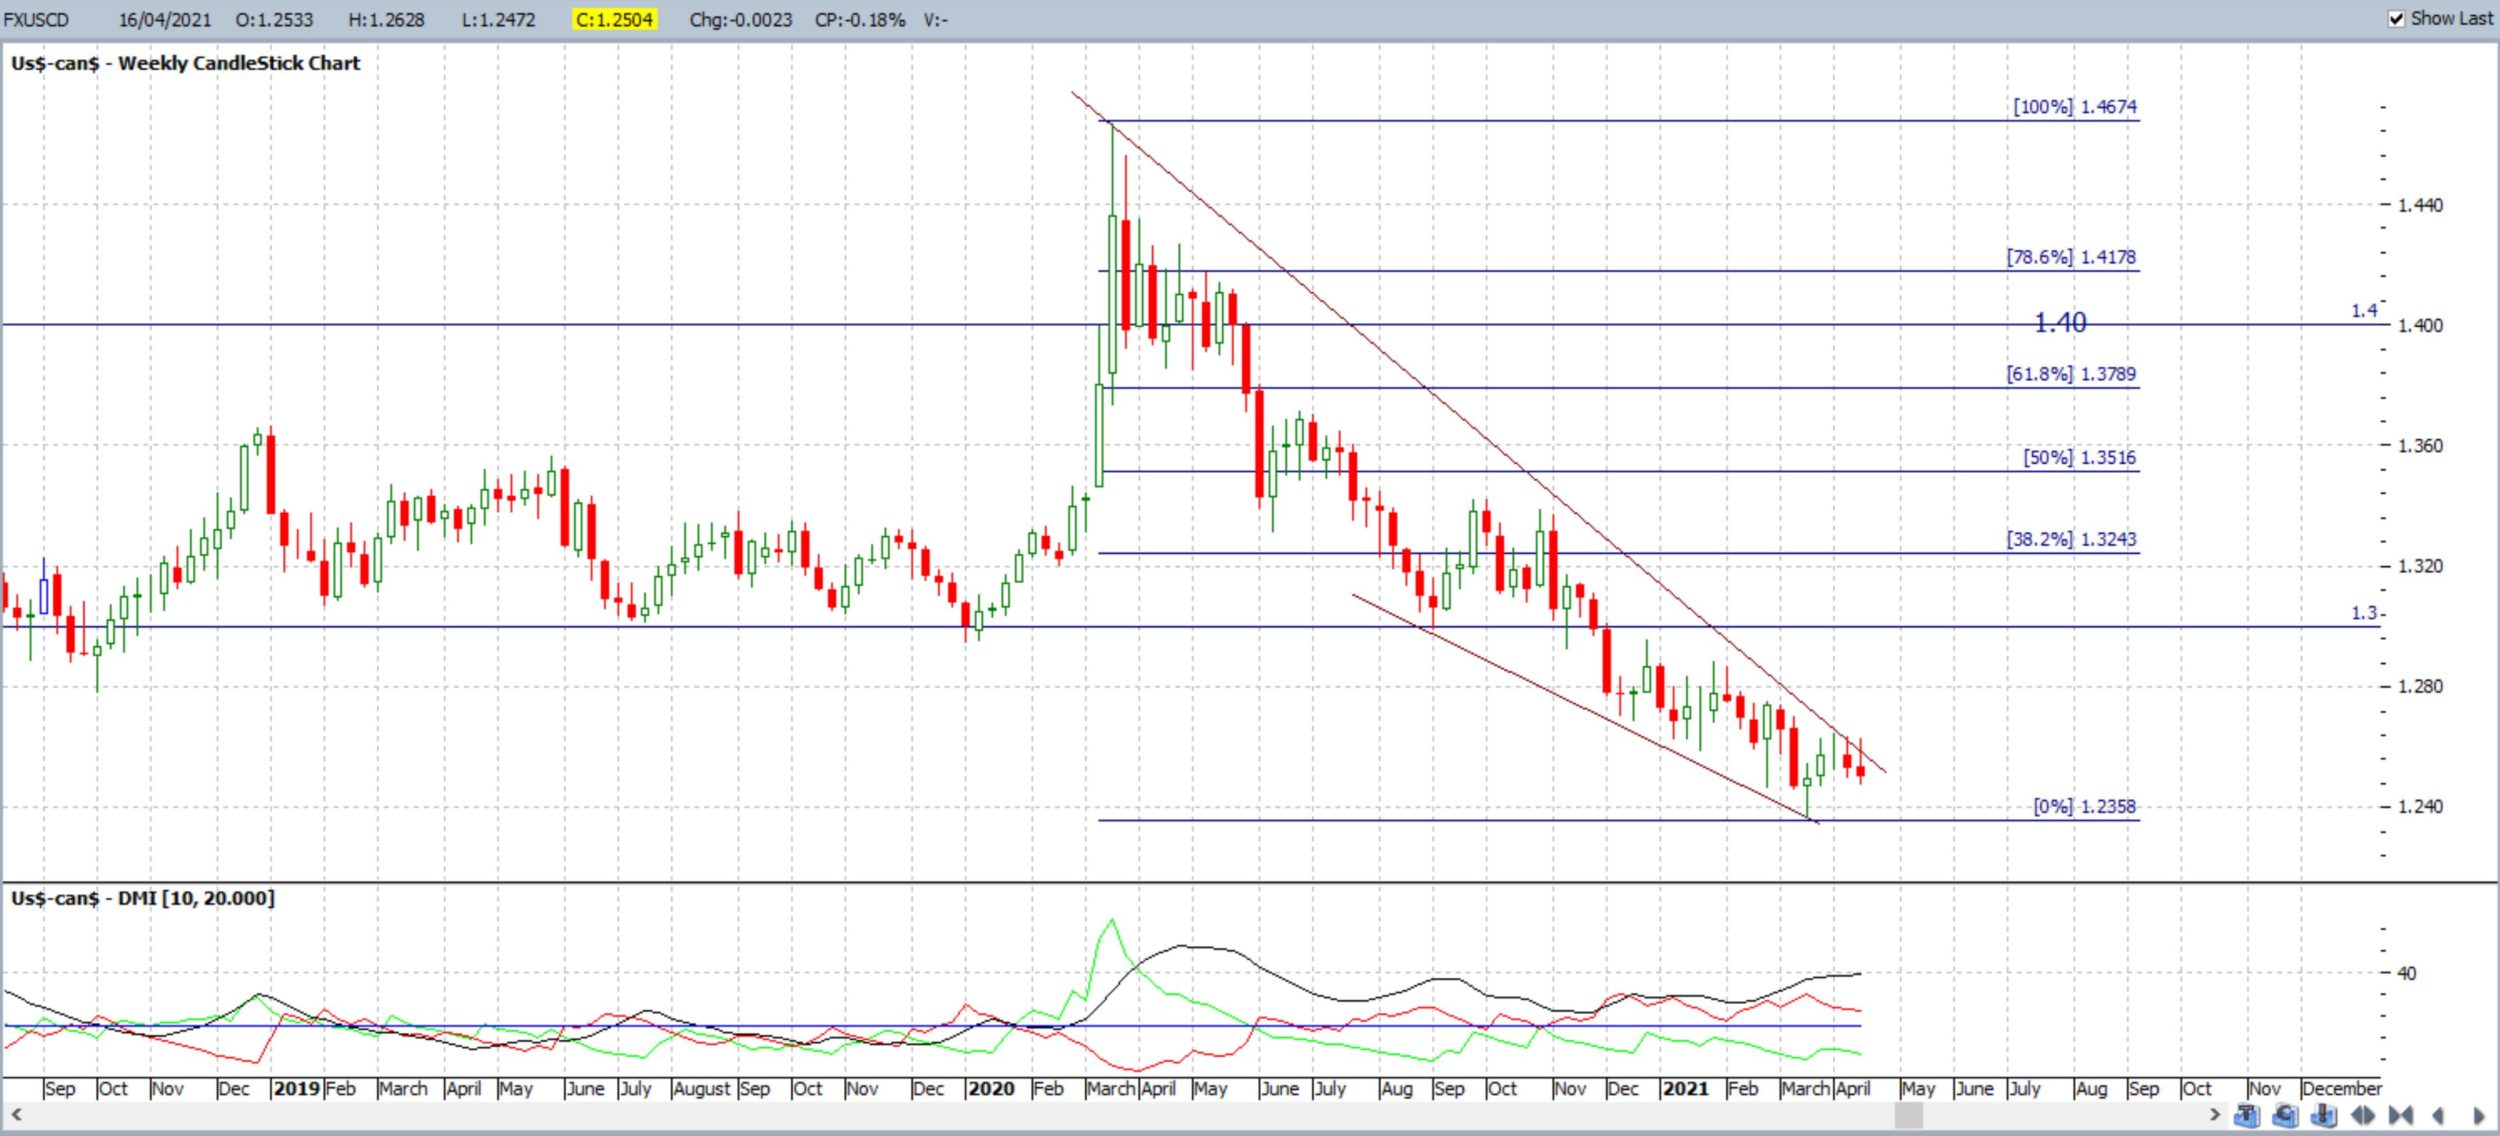
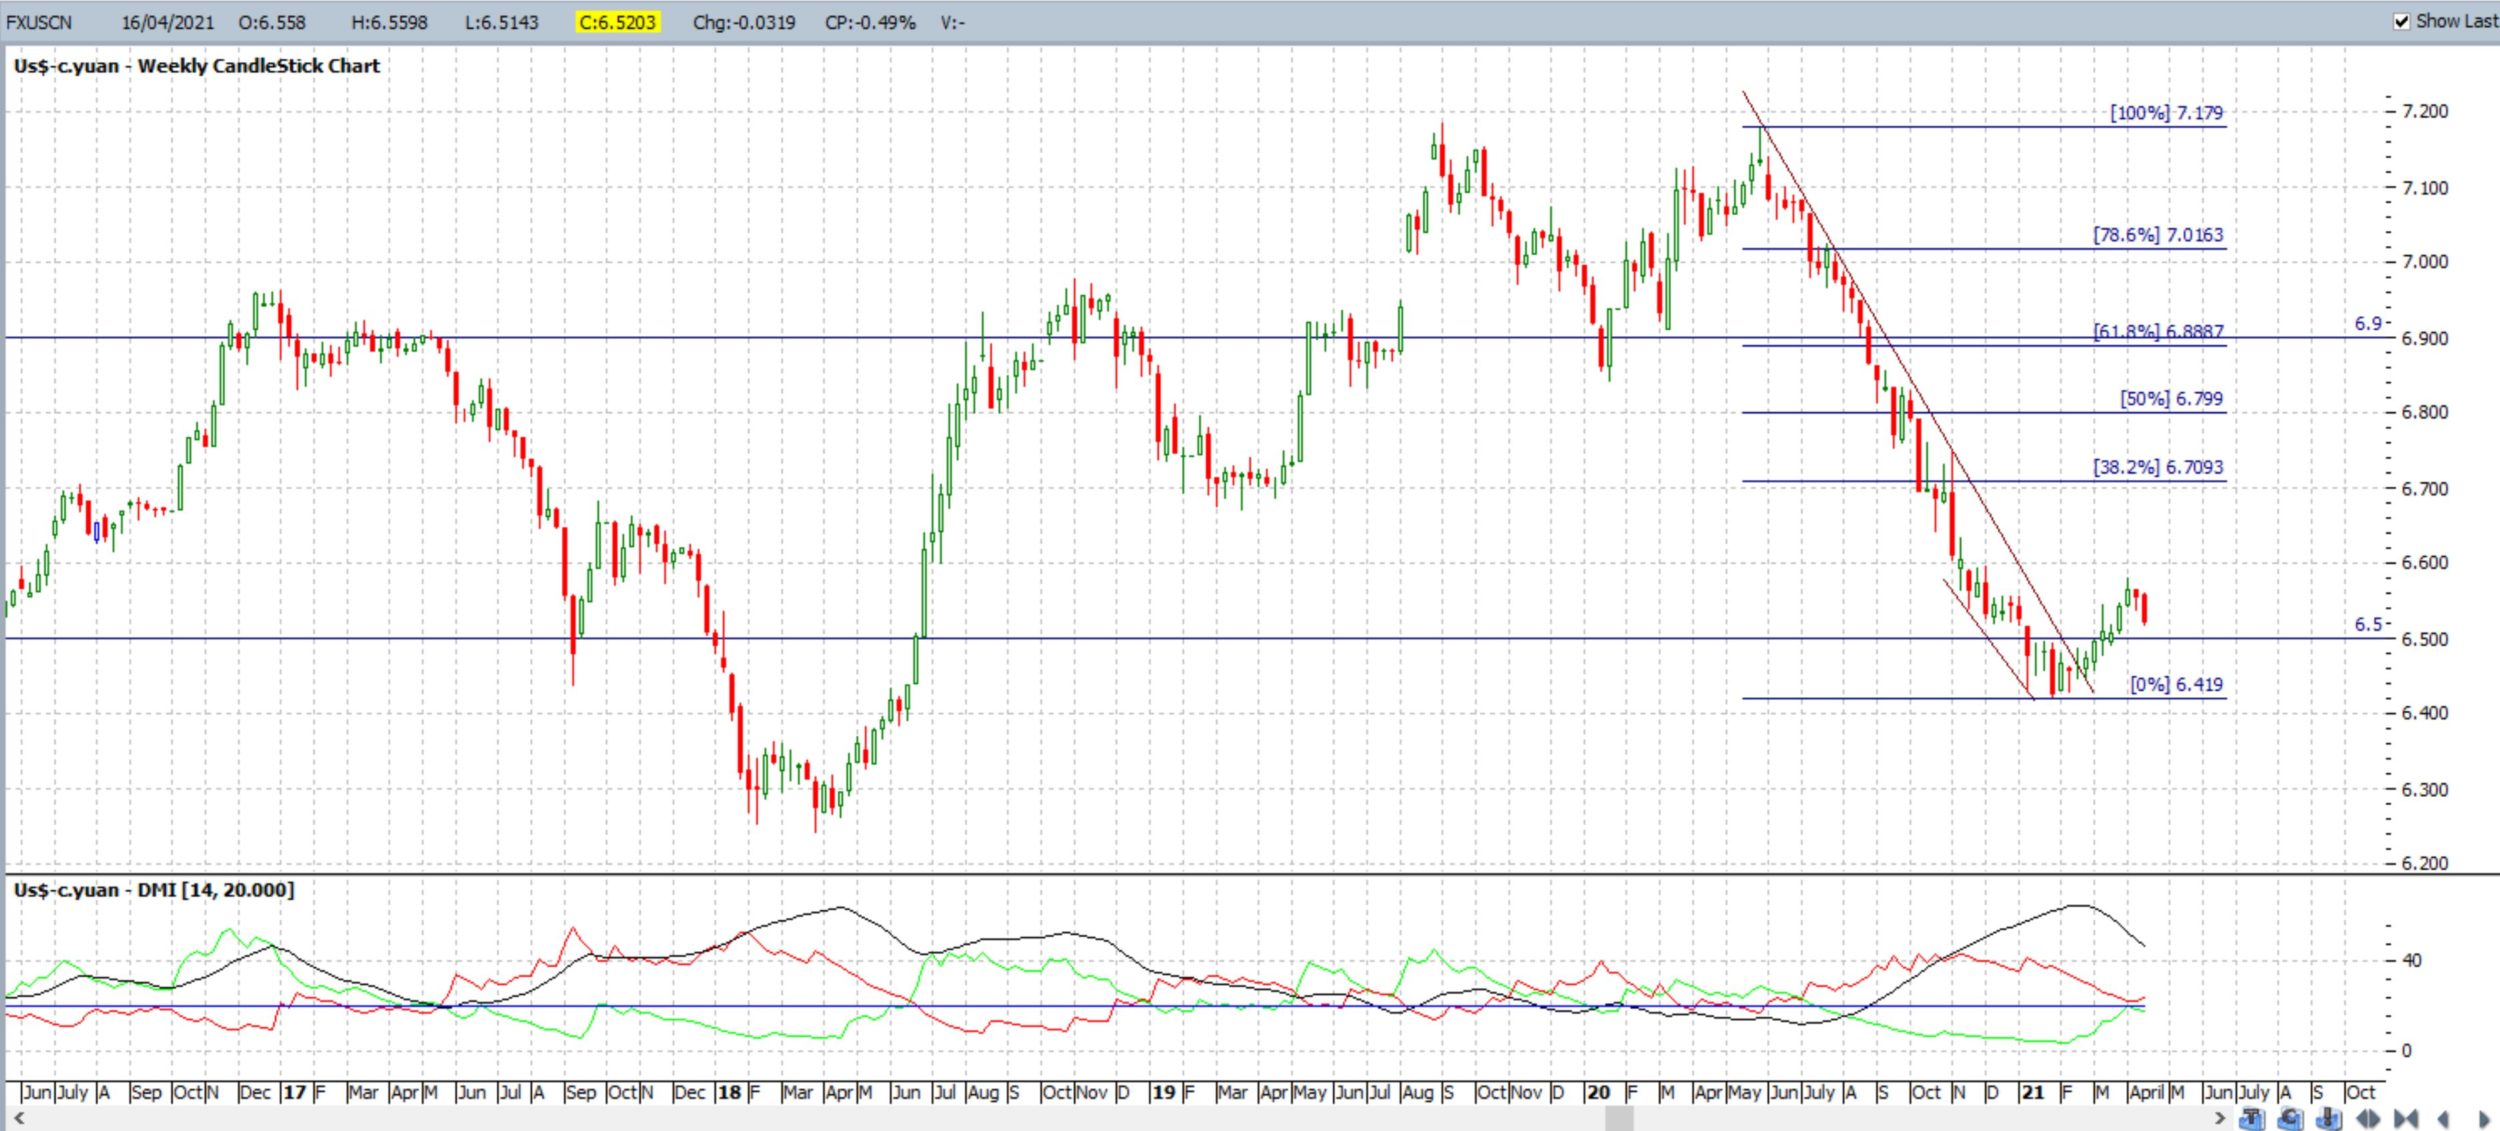
- USD/CAD and USD/CNY: keep an eye on these two weekly chart Descending Wedge patterns for any bullish breakout and / or follow-through.
USD/CAD weekly: watch for any new breakout:
USD/CNY weekly: watch 6.5 to see if this old resistance becomes new support:
-
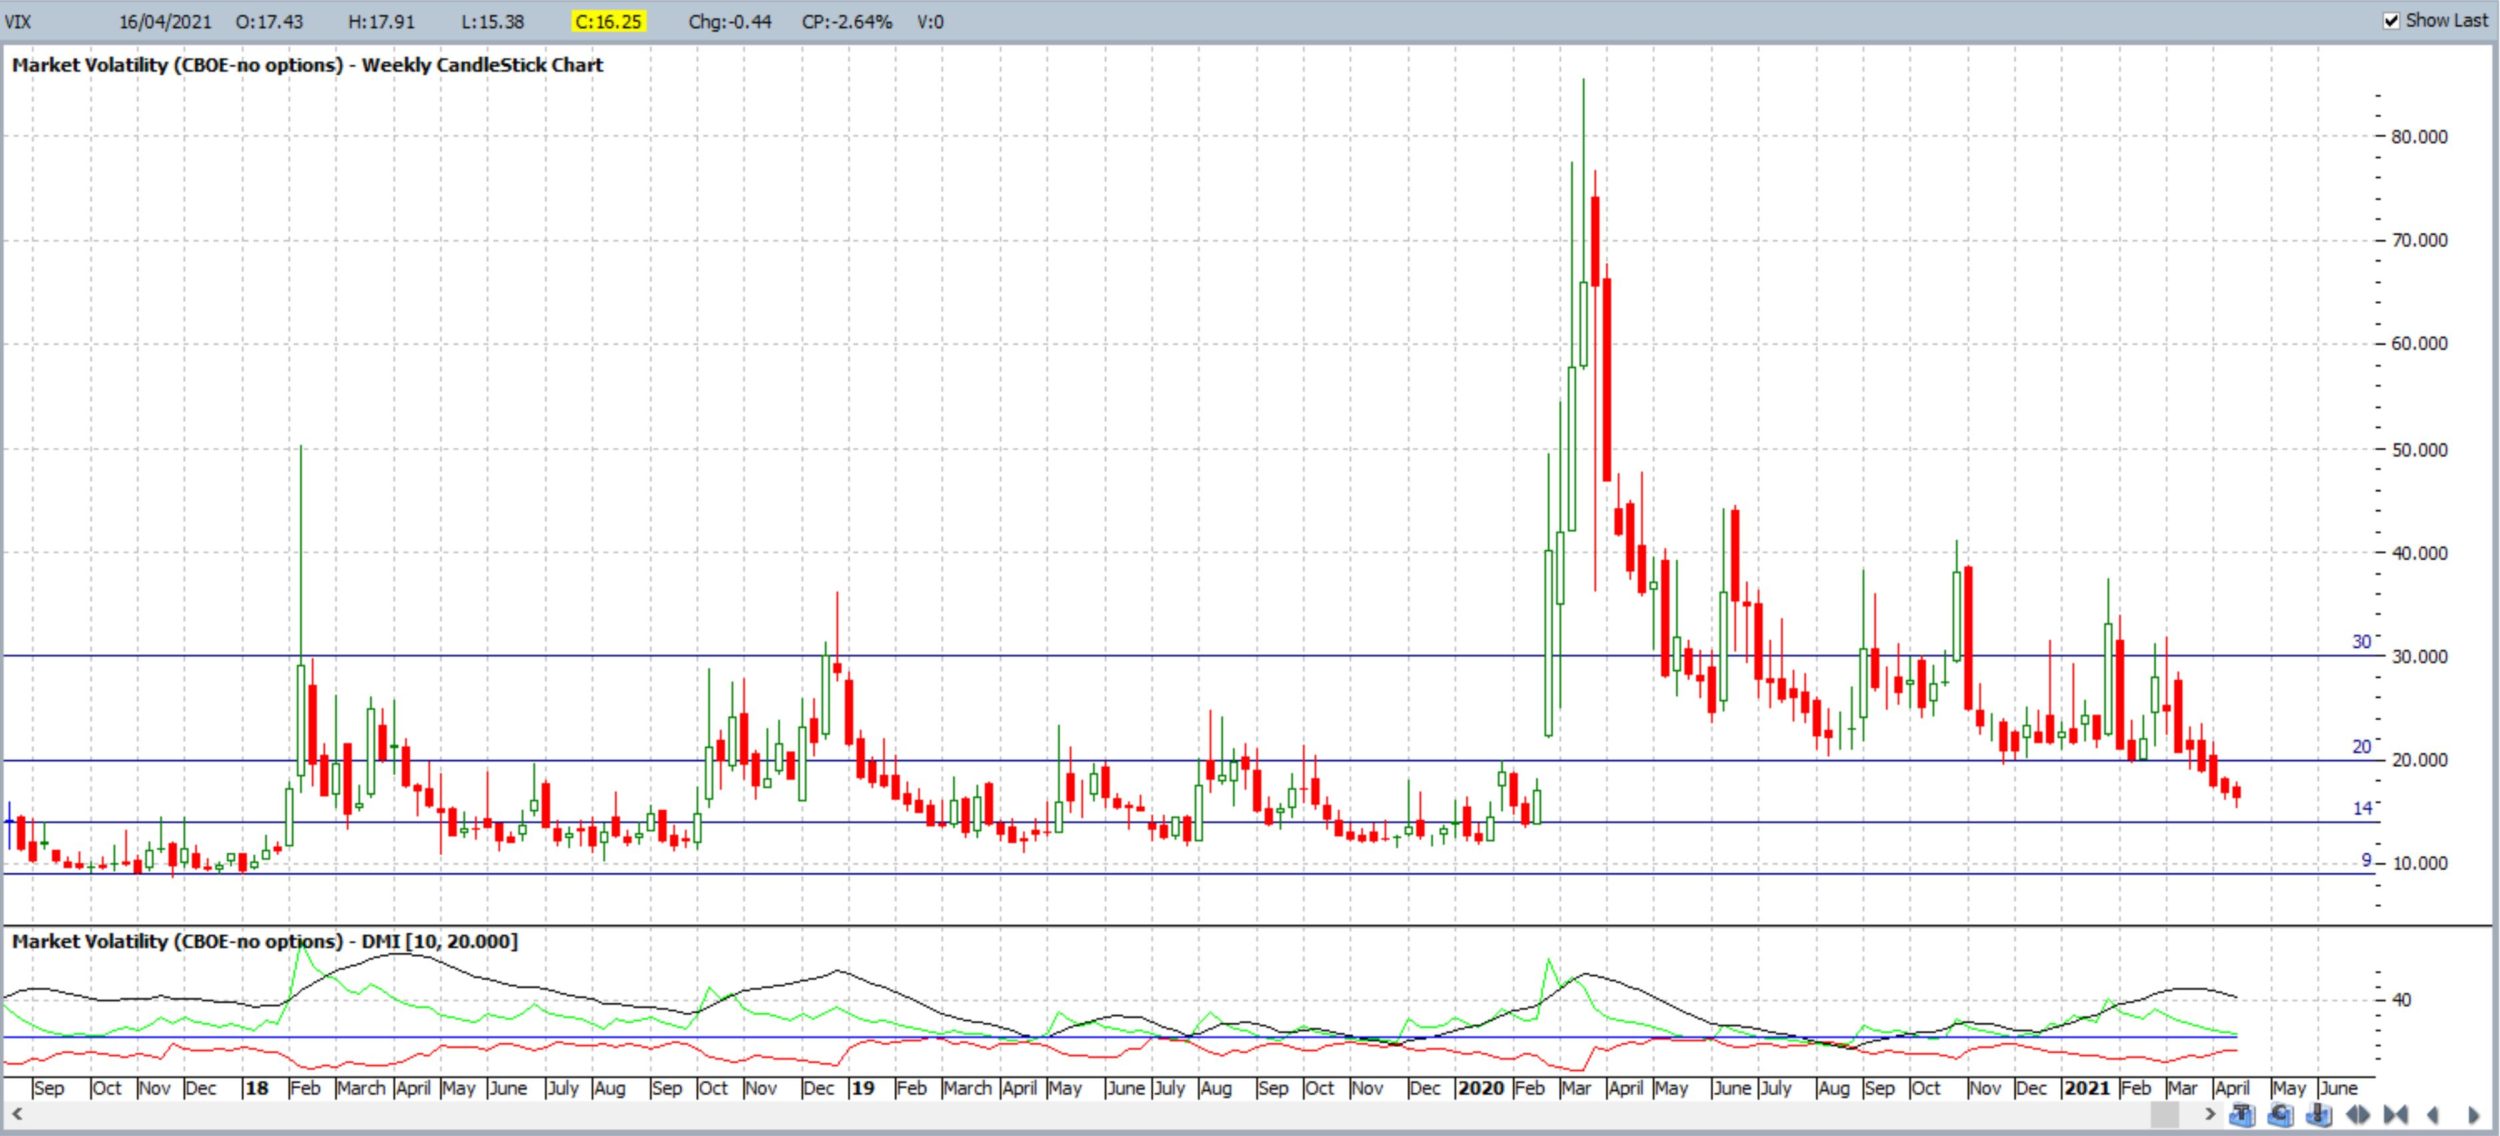
- VIX: the Fear index closed with a bearish weekly candle and is holding below the 20 S/R level so keep watch to see if this marks a return to a new and lower trading range for the index.
VIX weekly: watch the 20 S/R level for any new make or break:
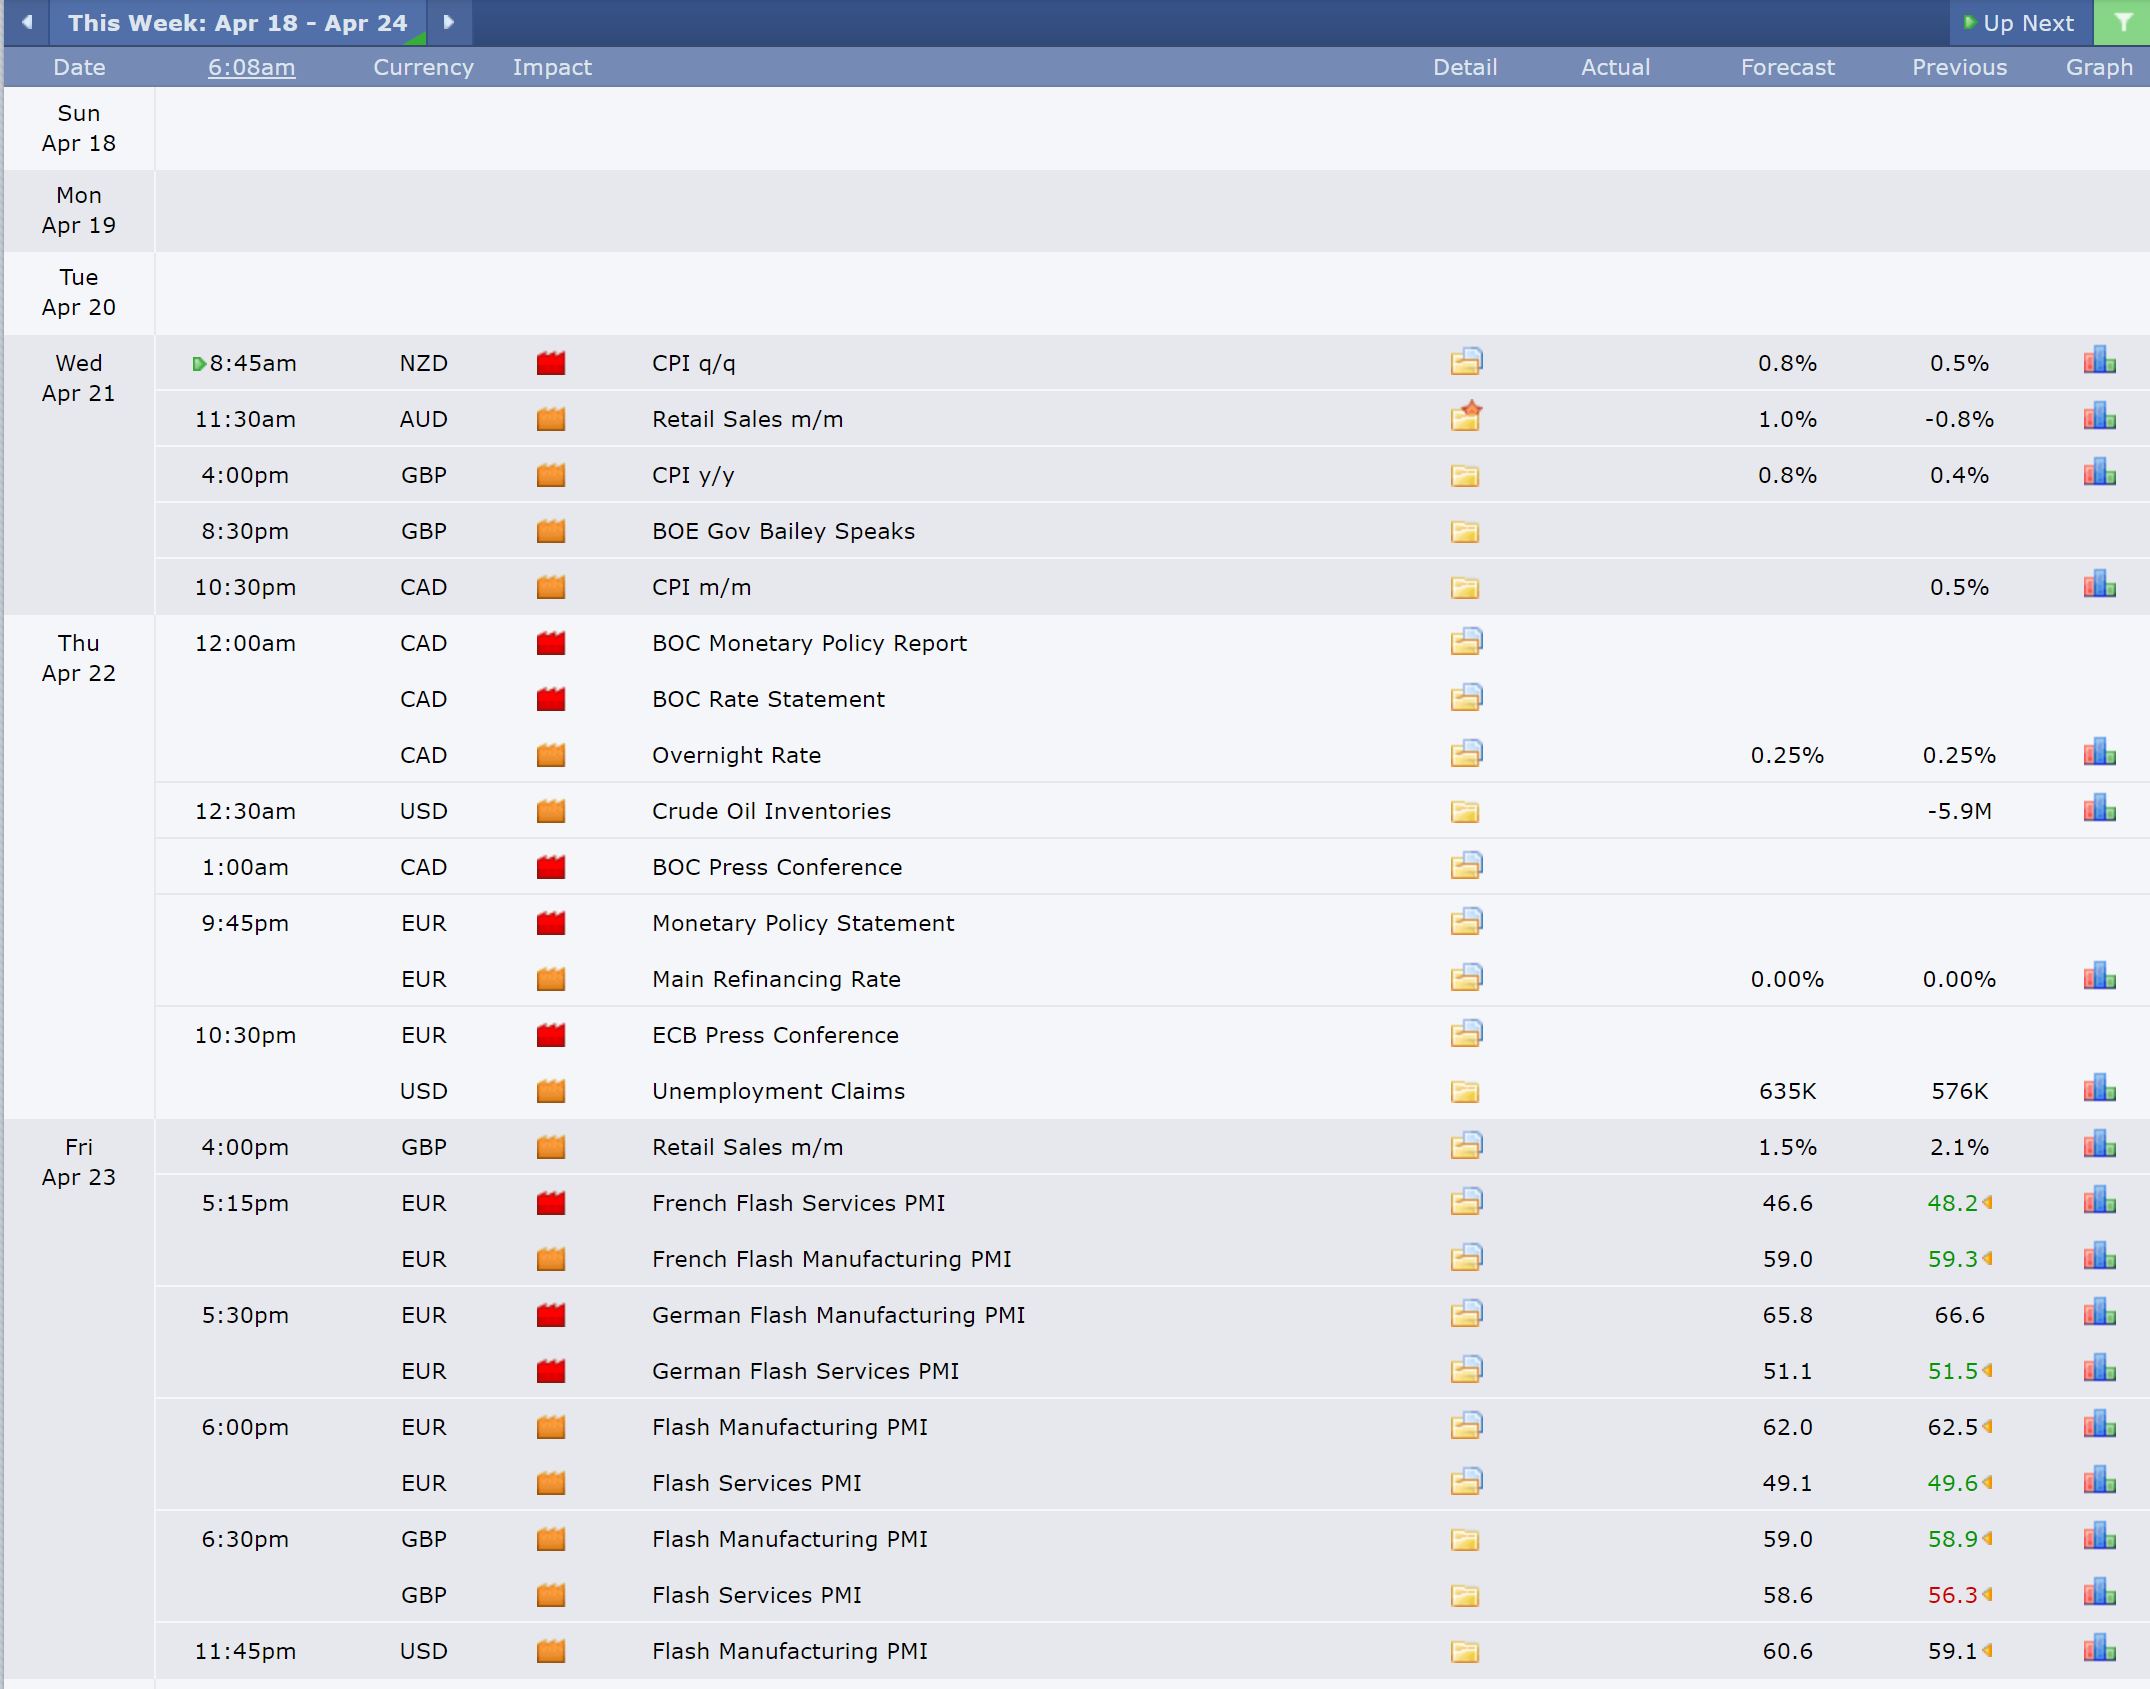
Calendar: Courtesy of Forex Factory:
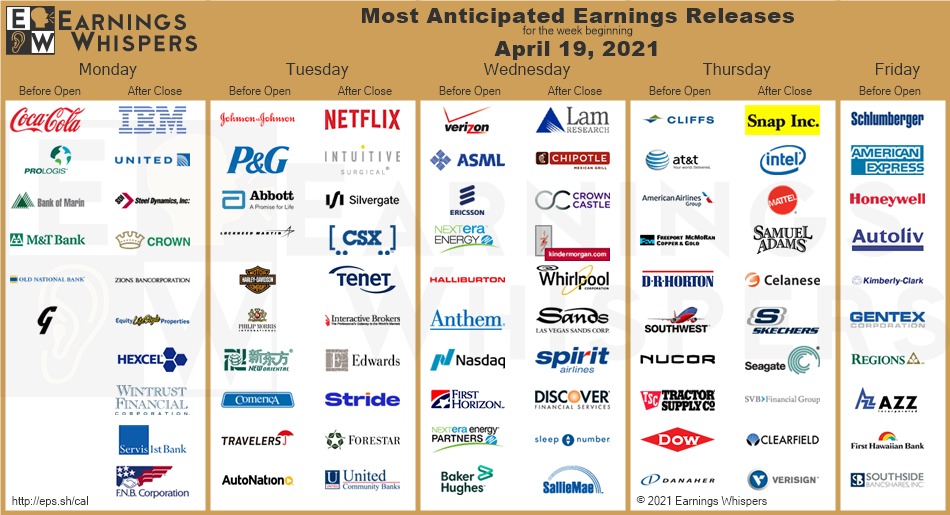
Earnings: Courtesy of Earnings Whispers: Earnings ramp up this week:
Market Analysis:
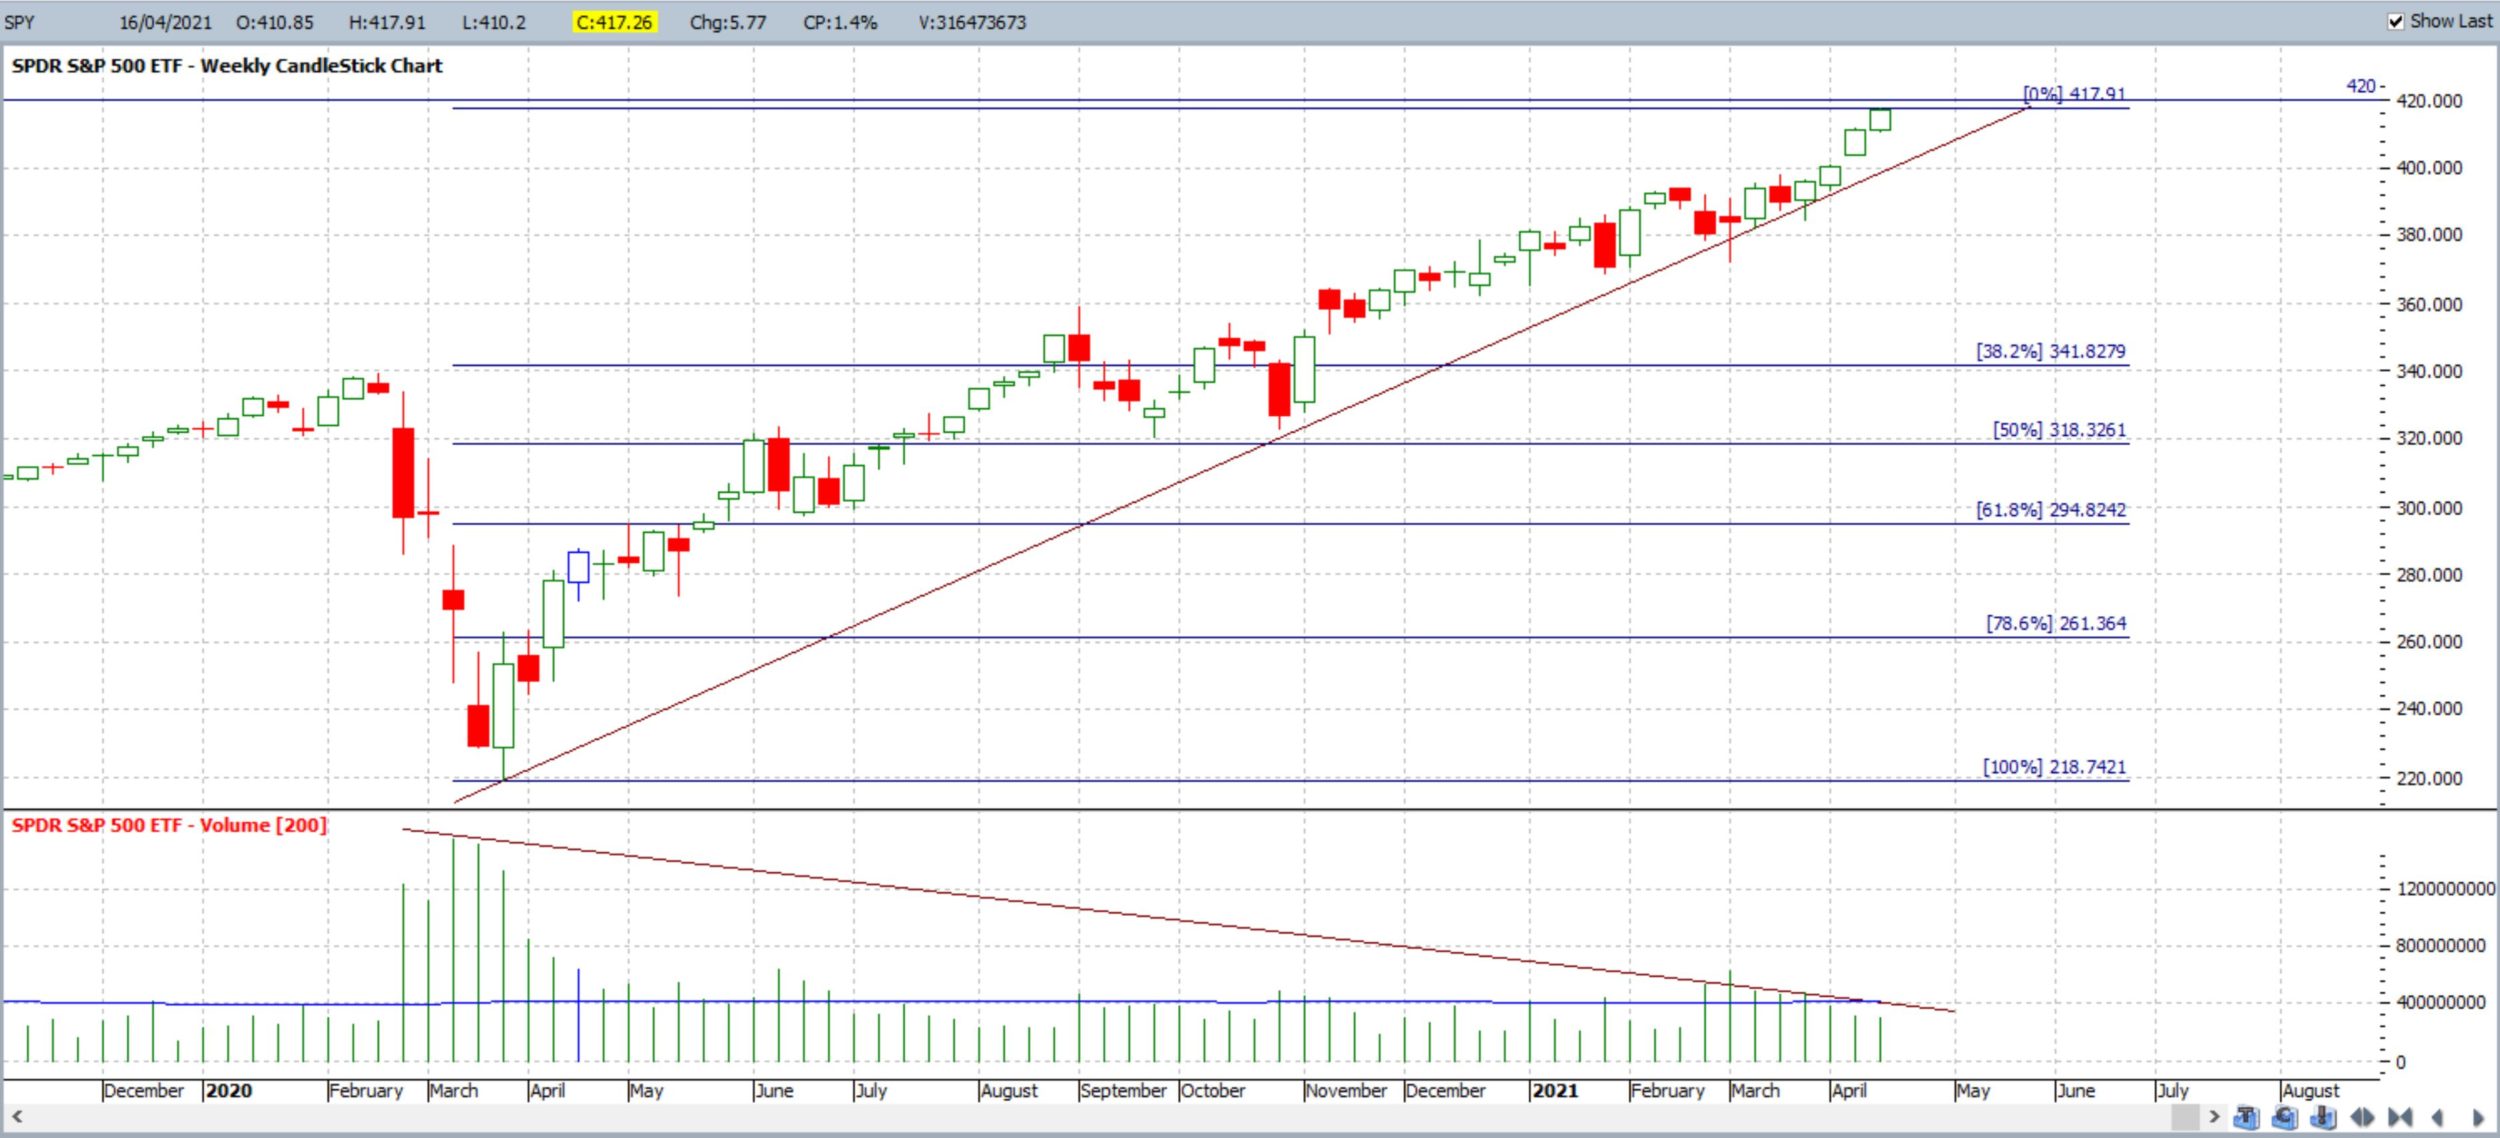
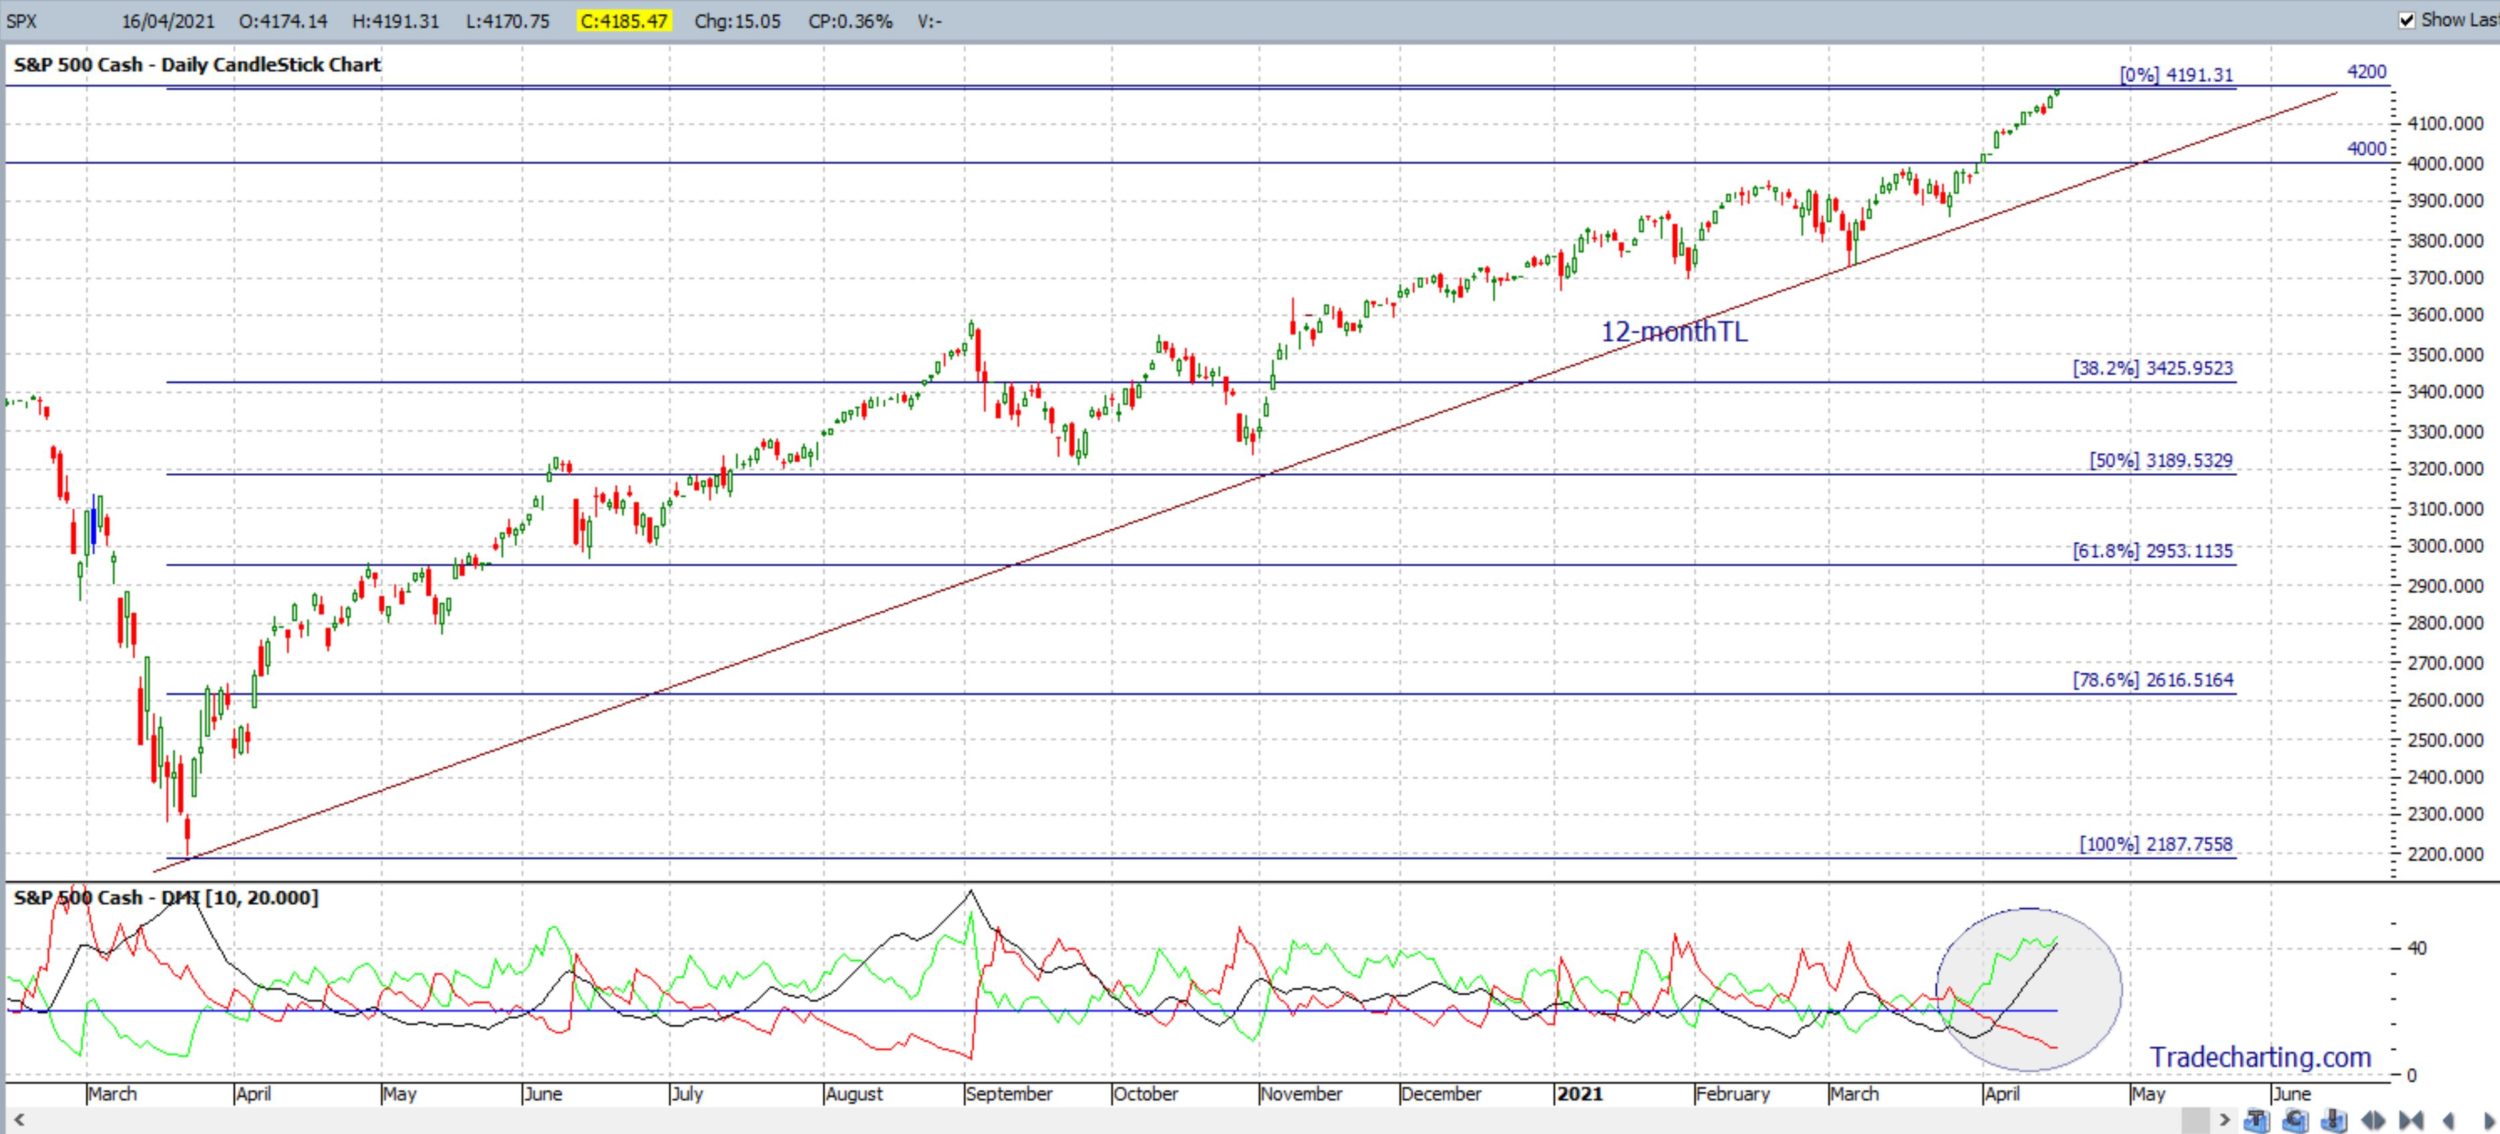
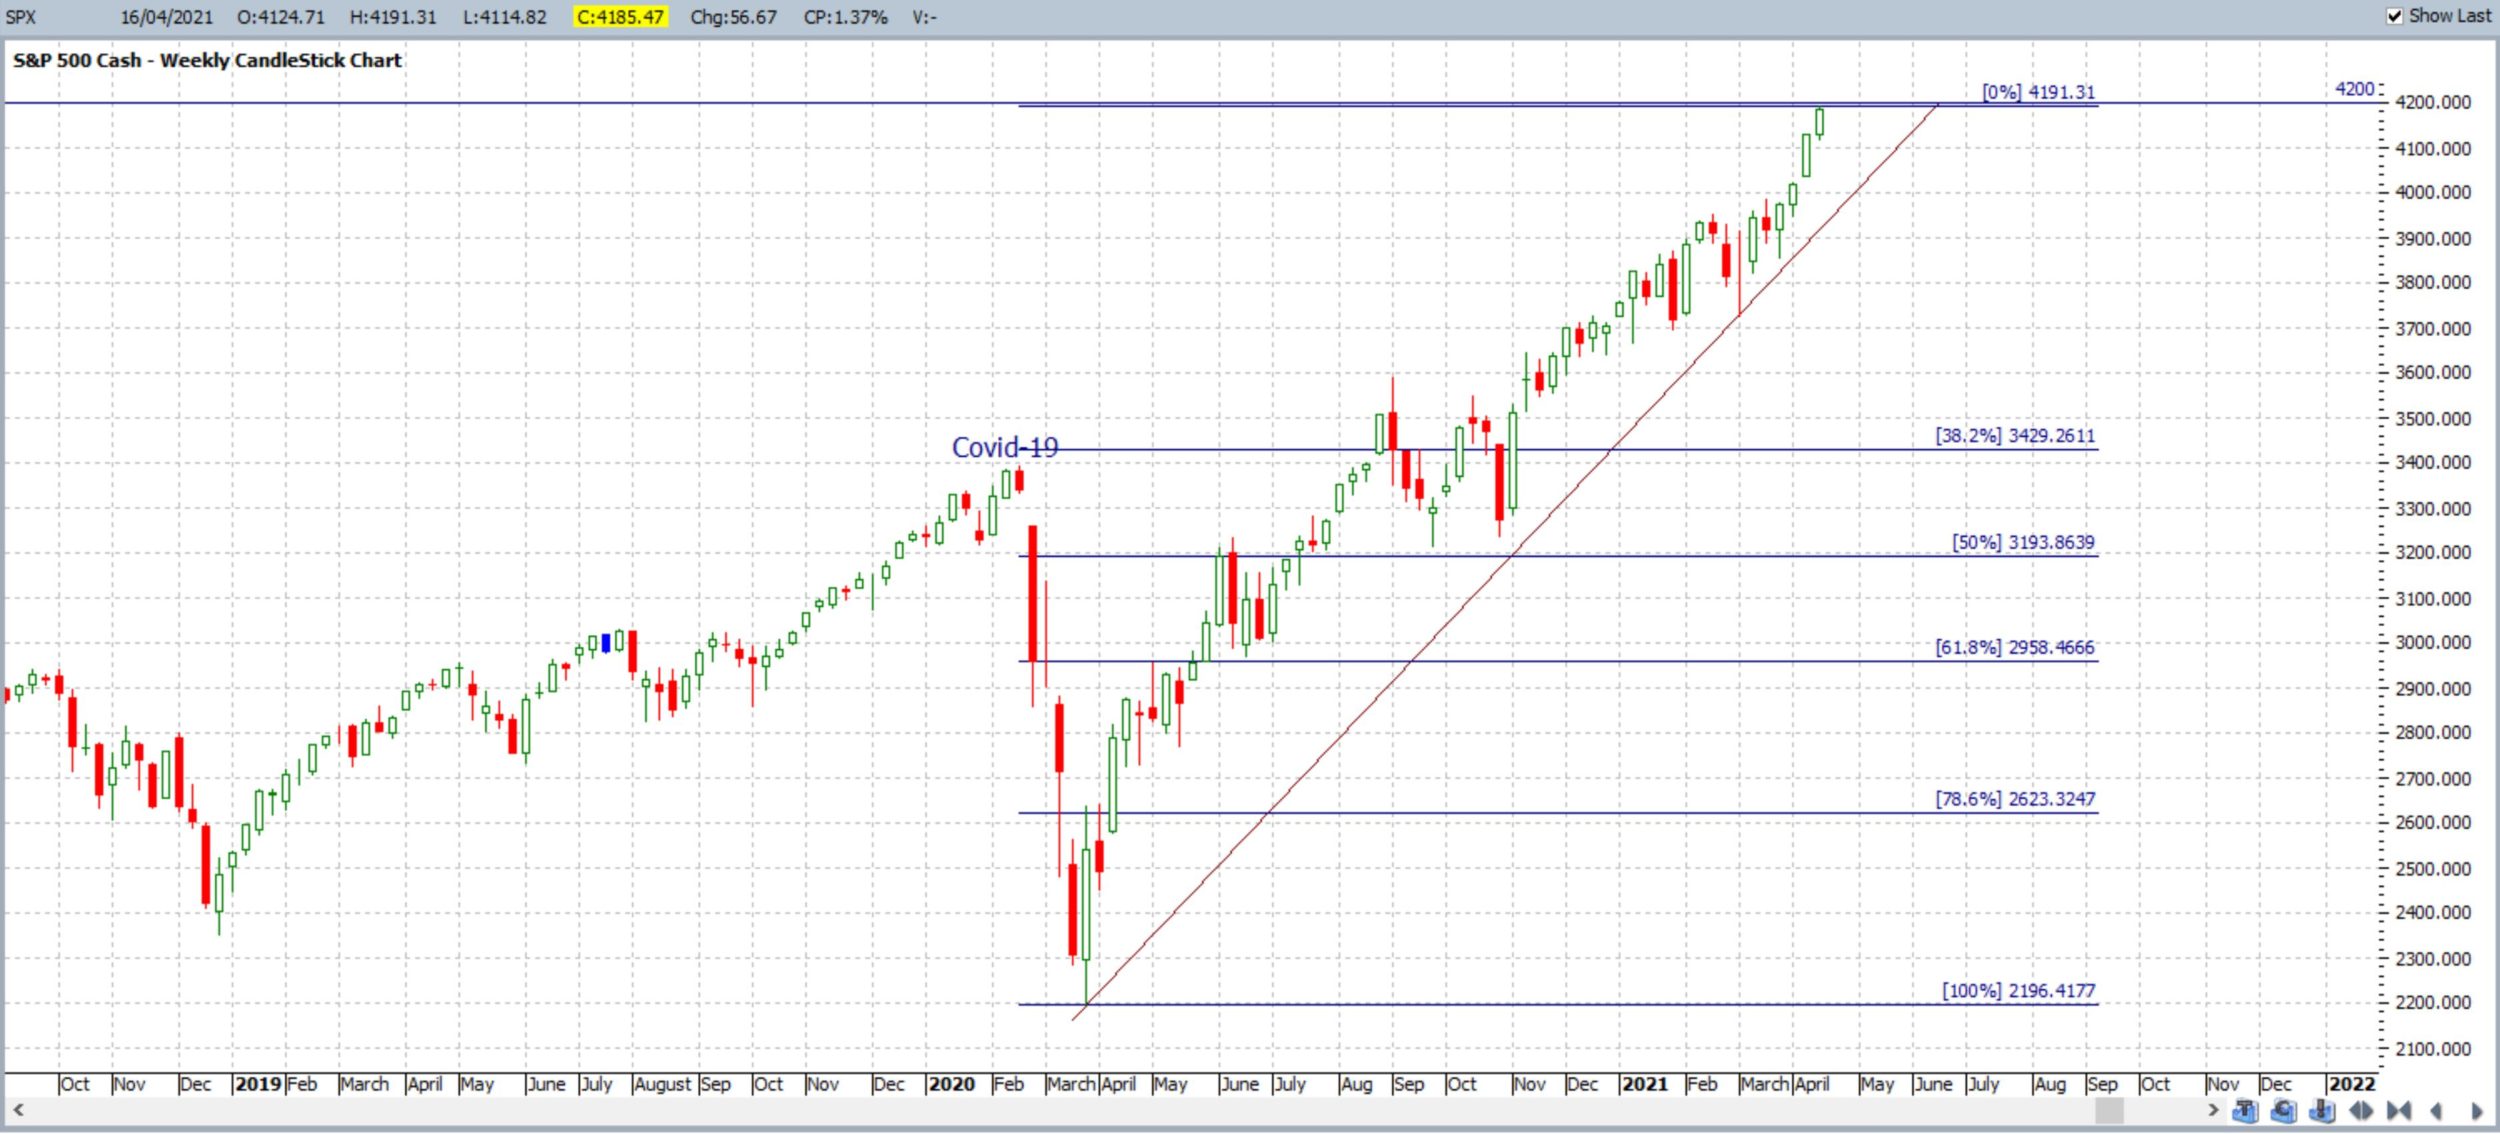
S&P500: The S&P500 closed with a bullish weekly candle, at a new all-time High and just under the 4,200 level making this whole-number resistance to monitor for any new make or break.
There is still divergence between Momentum and Volume with bullish momentum increasing but volume decreasing for the week. Trading volume was lower again last week and remains below the 200 MA and bear trend line so watch for any new breakout.
S&P500 ETF: SPY weekly: watch for any new volume trend line breakout.
:
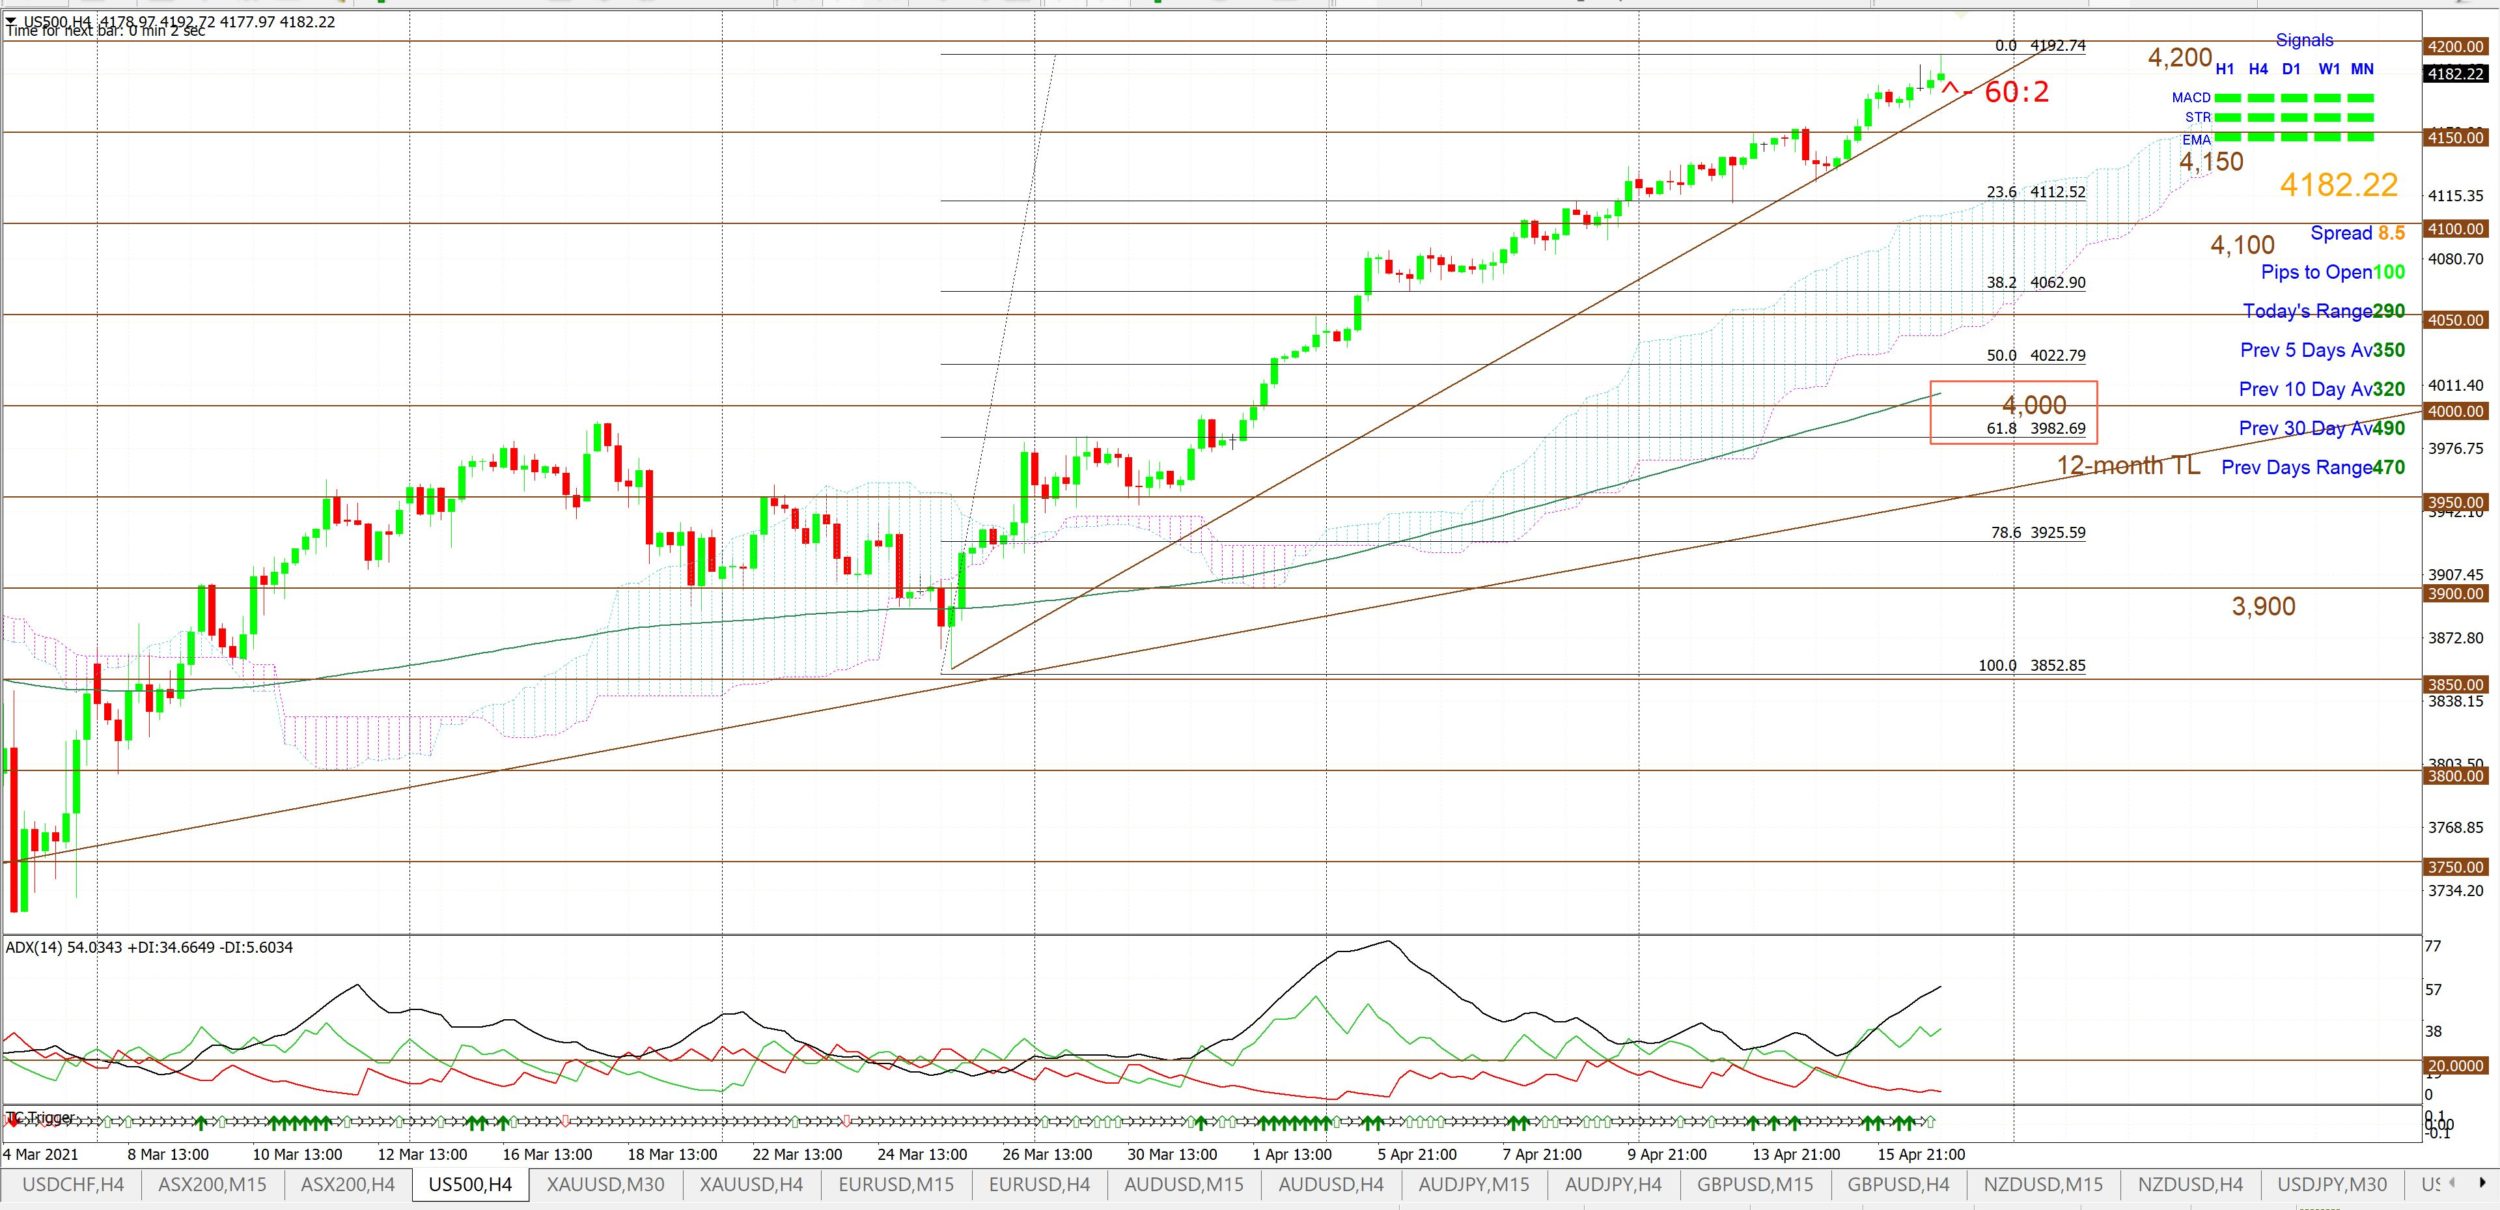
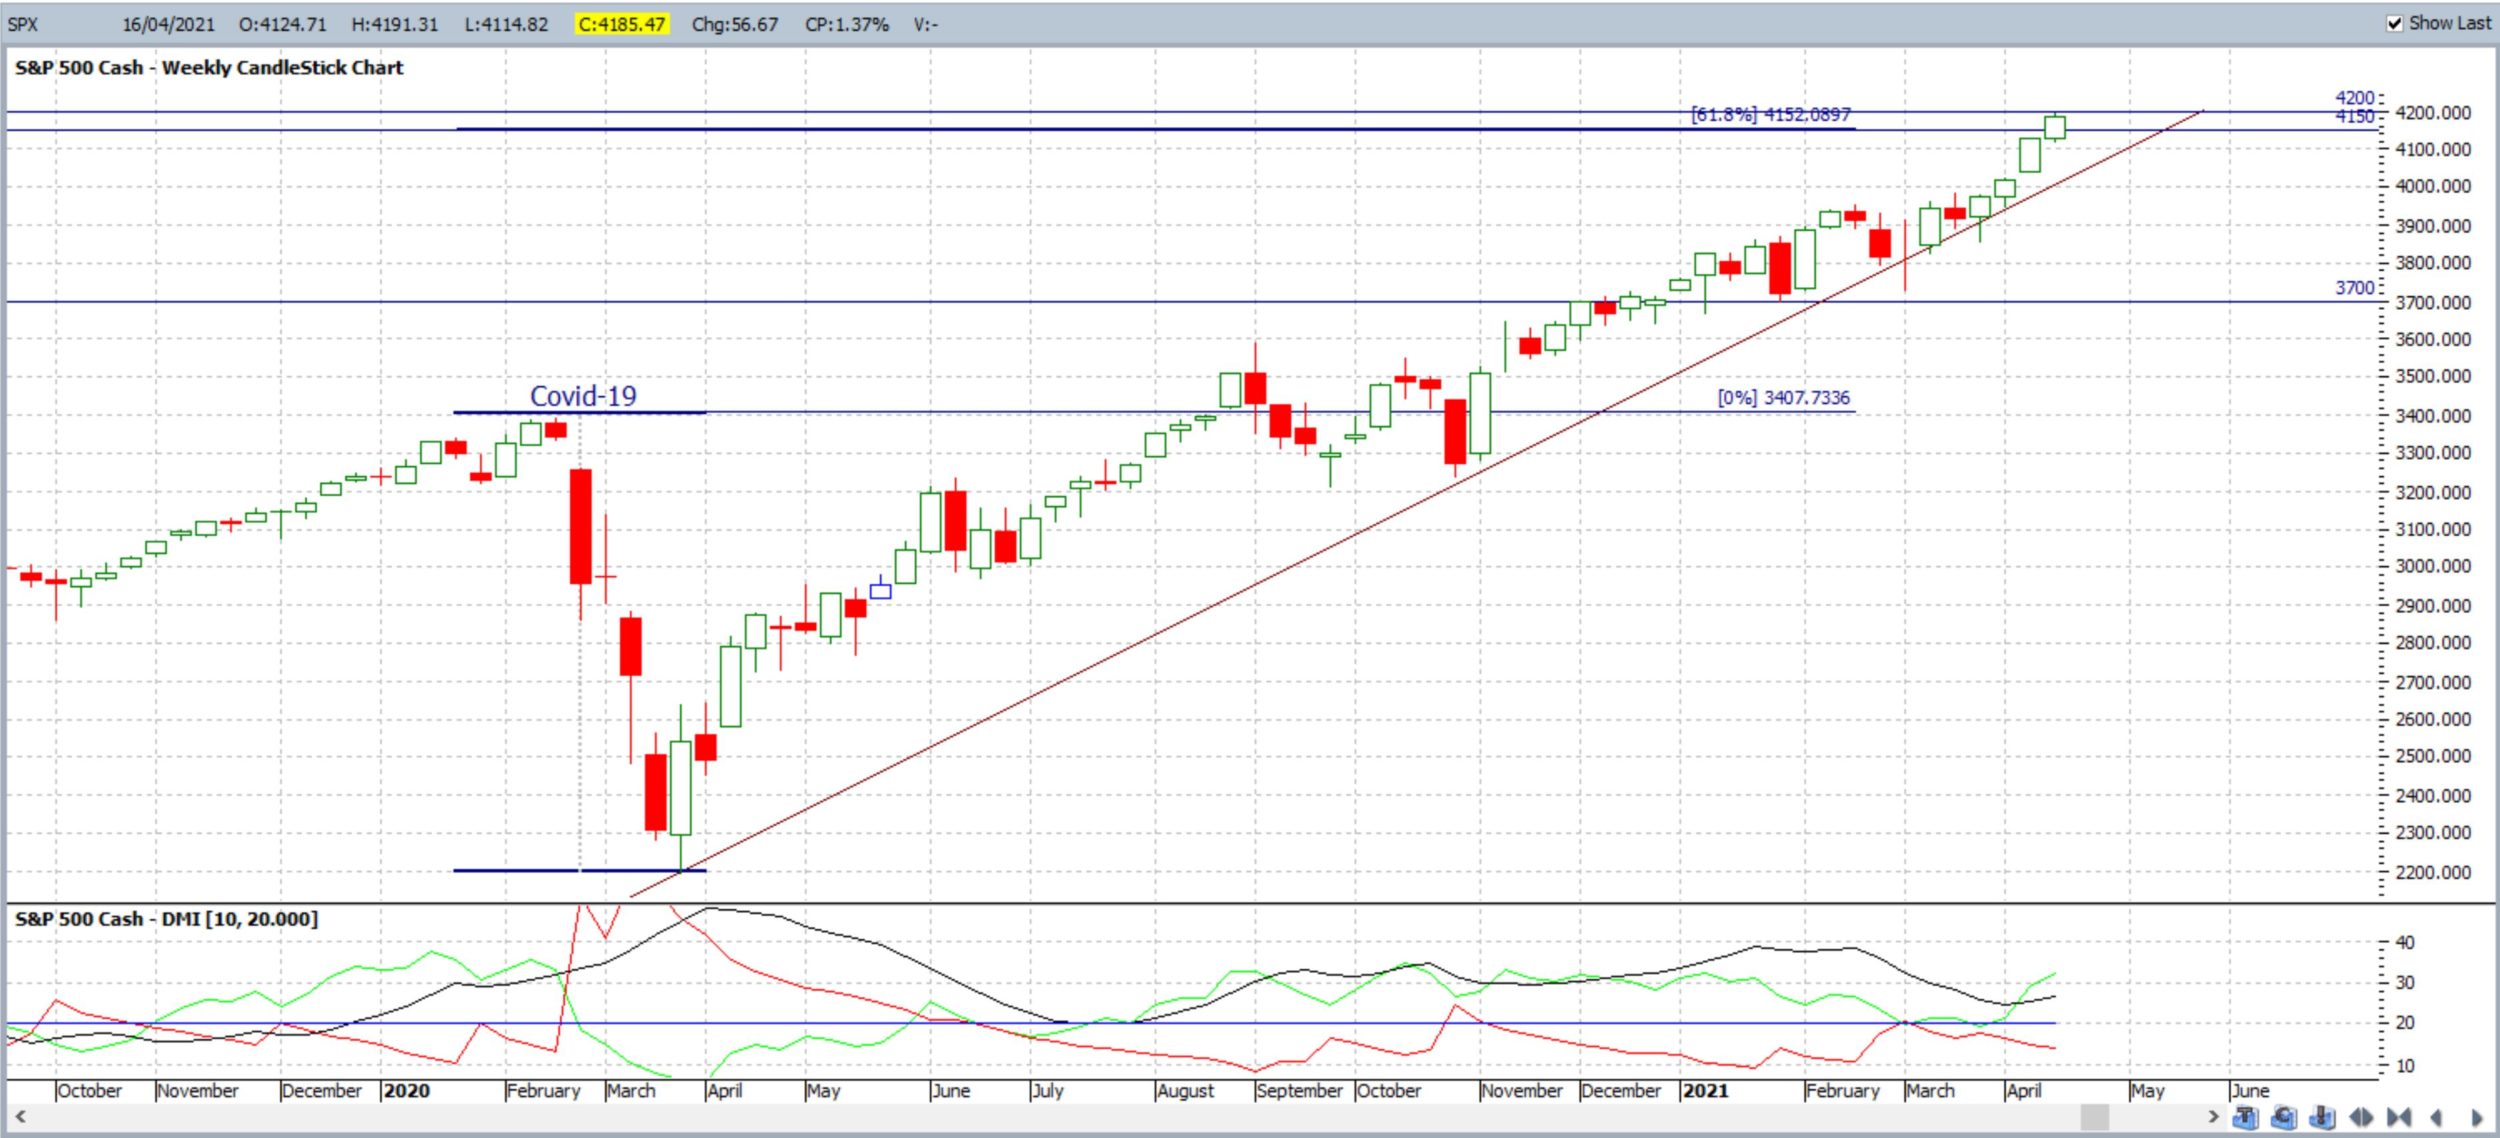
The 4,200 level is the resistance to watch for any new make or break and there are revised 4hr chart trend lines to assess with any new momentum breakout as well.
NB: The second weekly chart shows how the 61.8% Fibonacci extension of the Covid-induced Swing Low is up near 4,150 so watch to see if this region forms any new support.
Bullish targets: any bullish 4hr chart trend line breakout above 4,200 would bring 4,300 into focus.
Bearish targets: any bearish 4hr chart break of the recent support trend line would bring 4,100 and 4,000 back into focus as the latter is near the 4hr chart’s 61.8% Fibonacci. After that, watch the 12-month support trend line followed by whole-numbers on the way down to the weekly chart’s 61.8% Fibonacci retracement level, near 2,800.
- Watch 4,200 and 4hr chart trend lines for any new breakout:
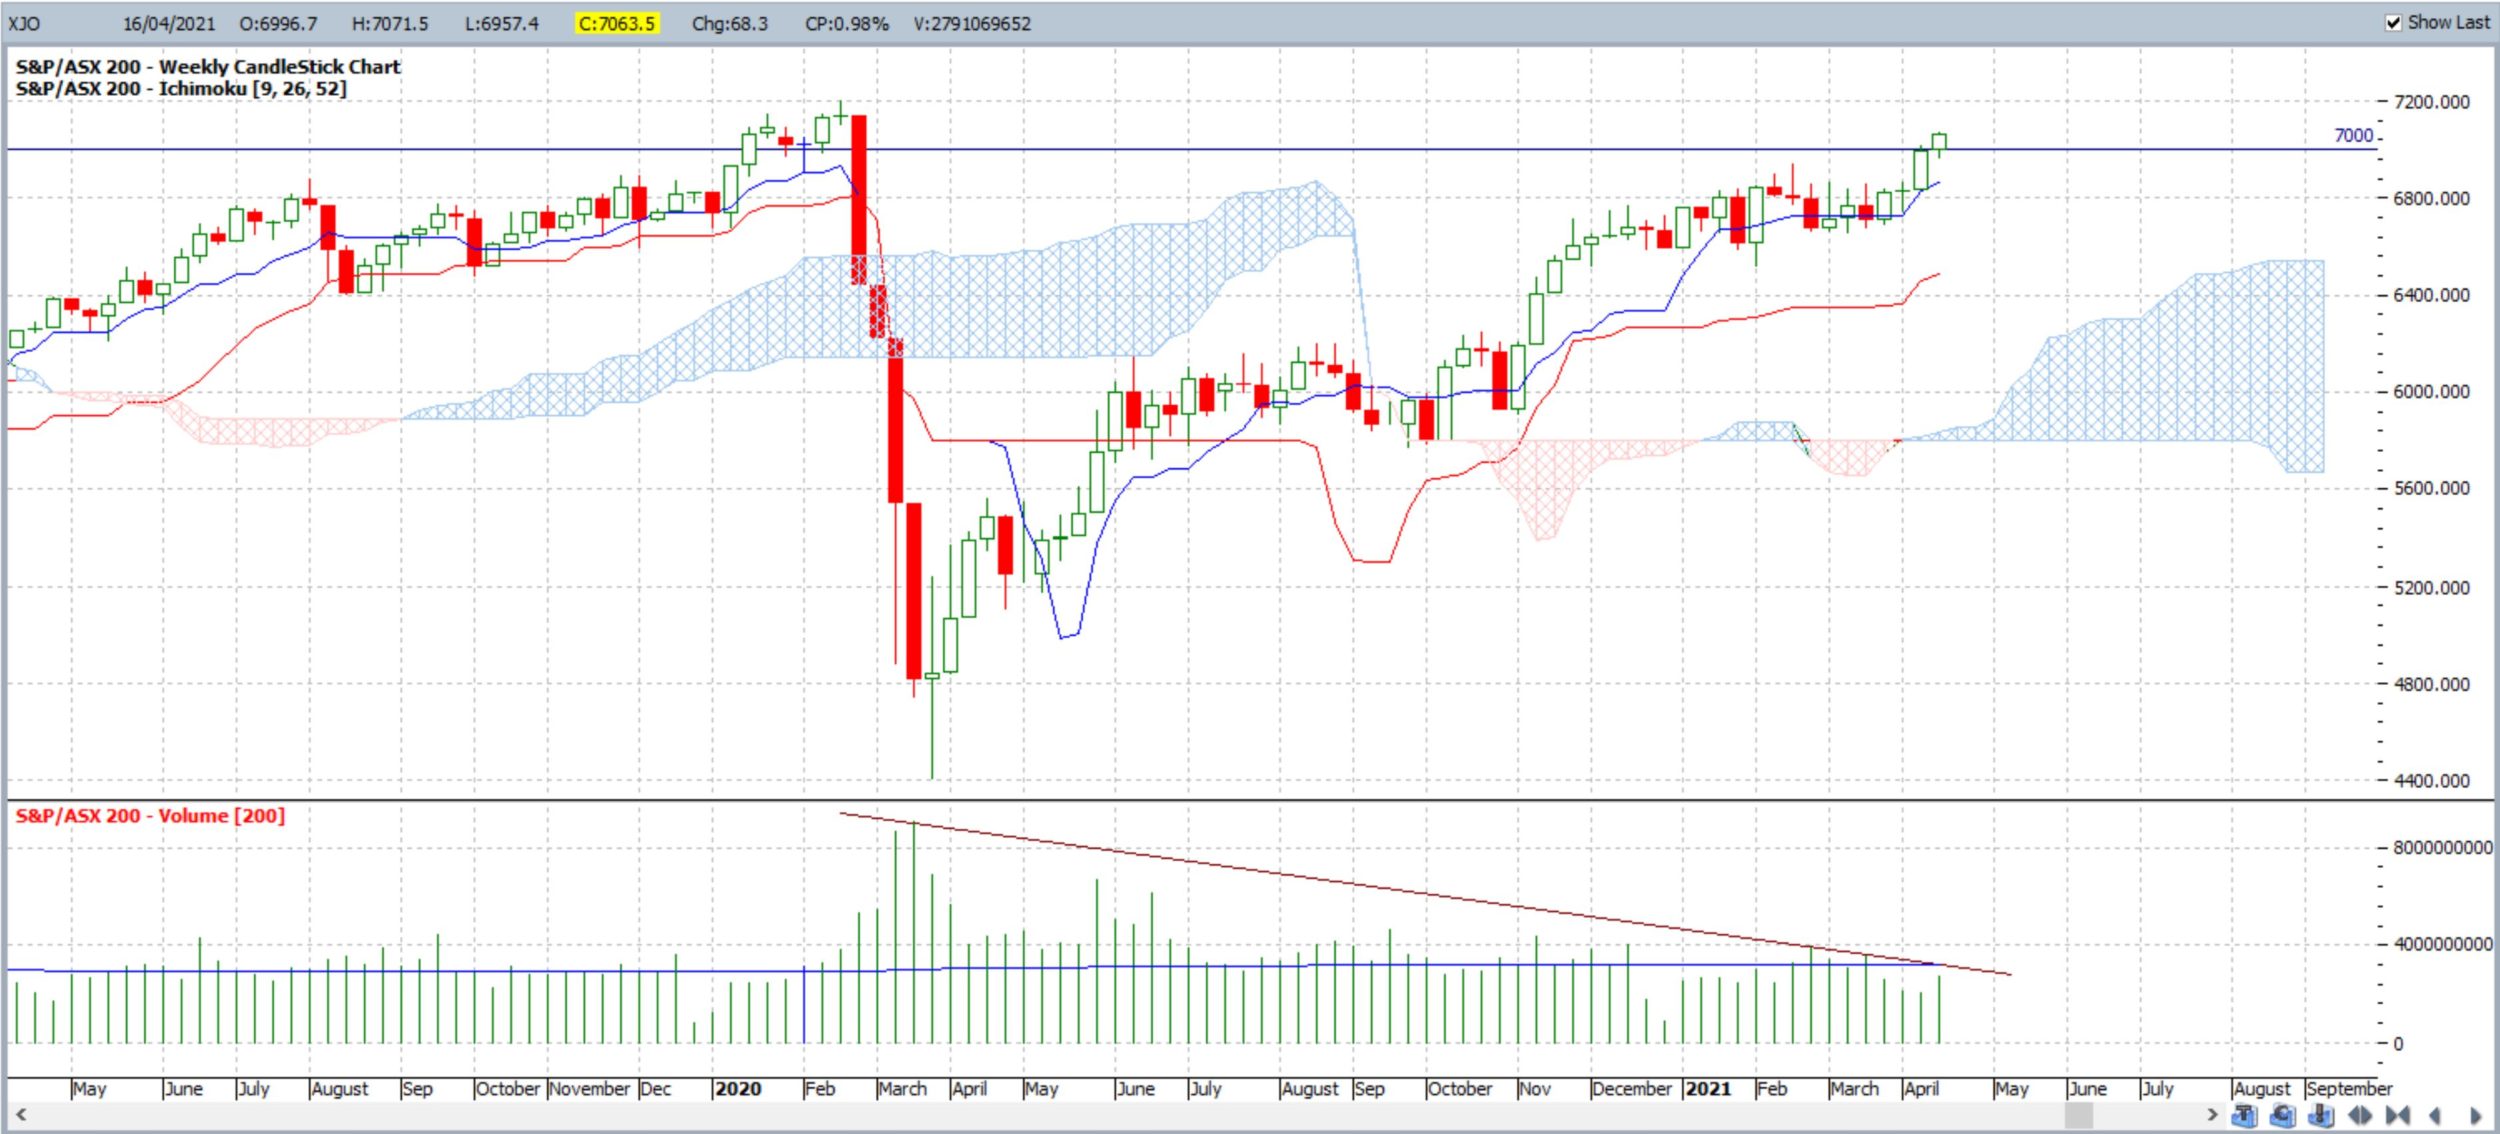
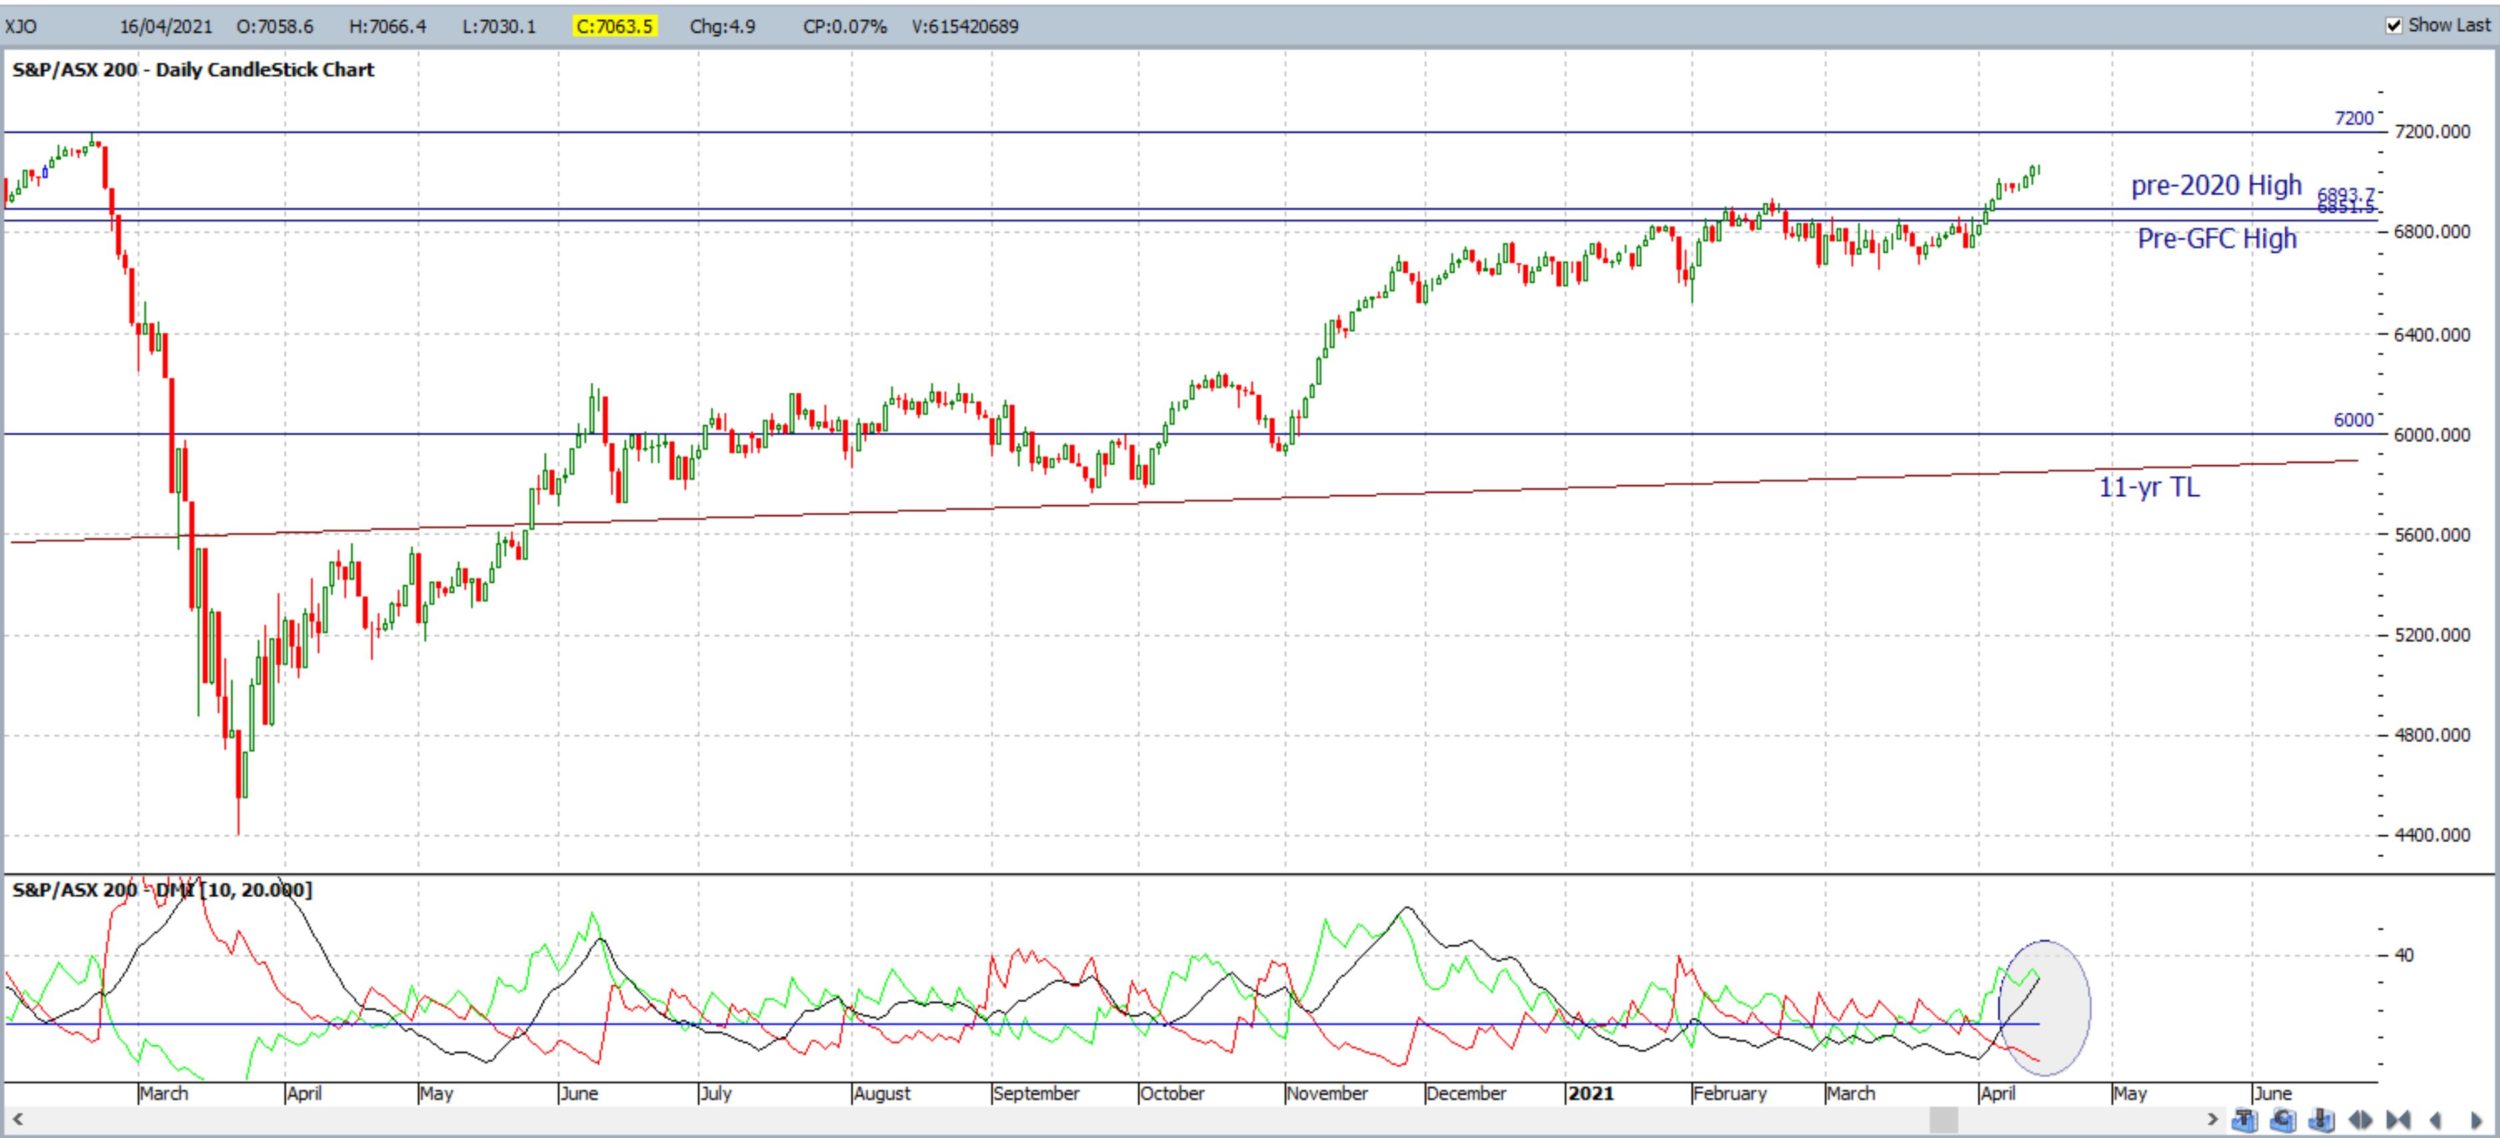
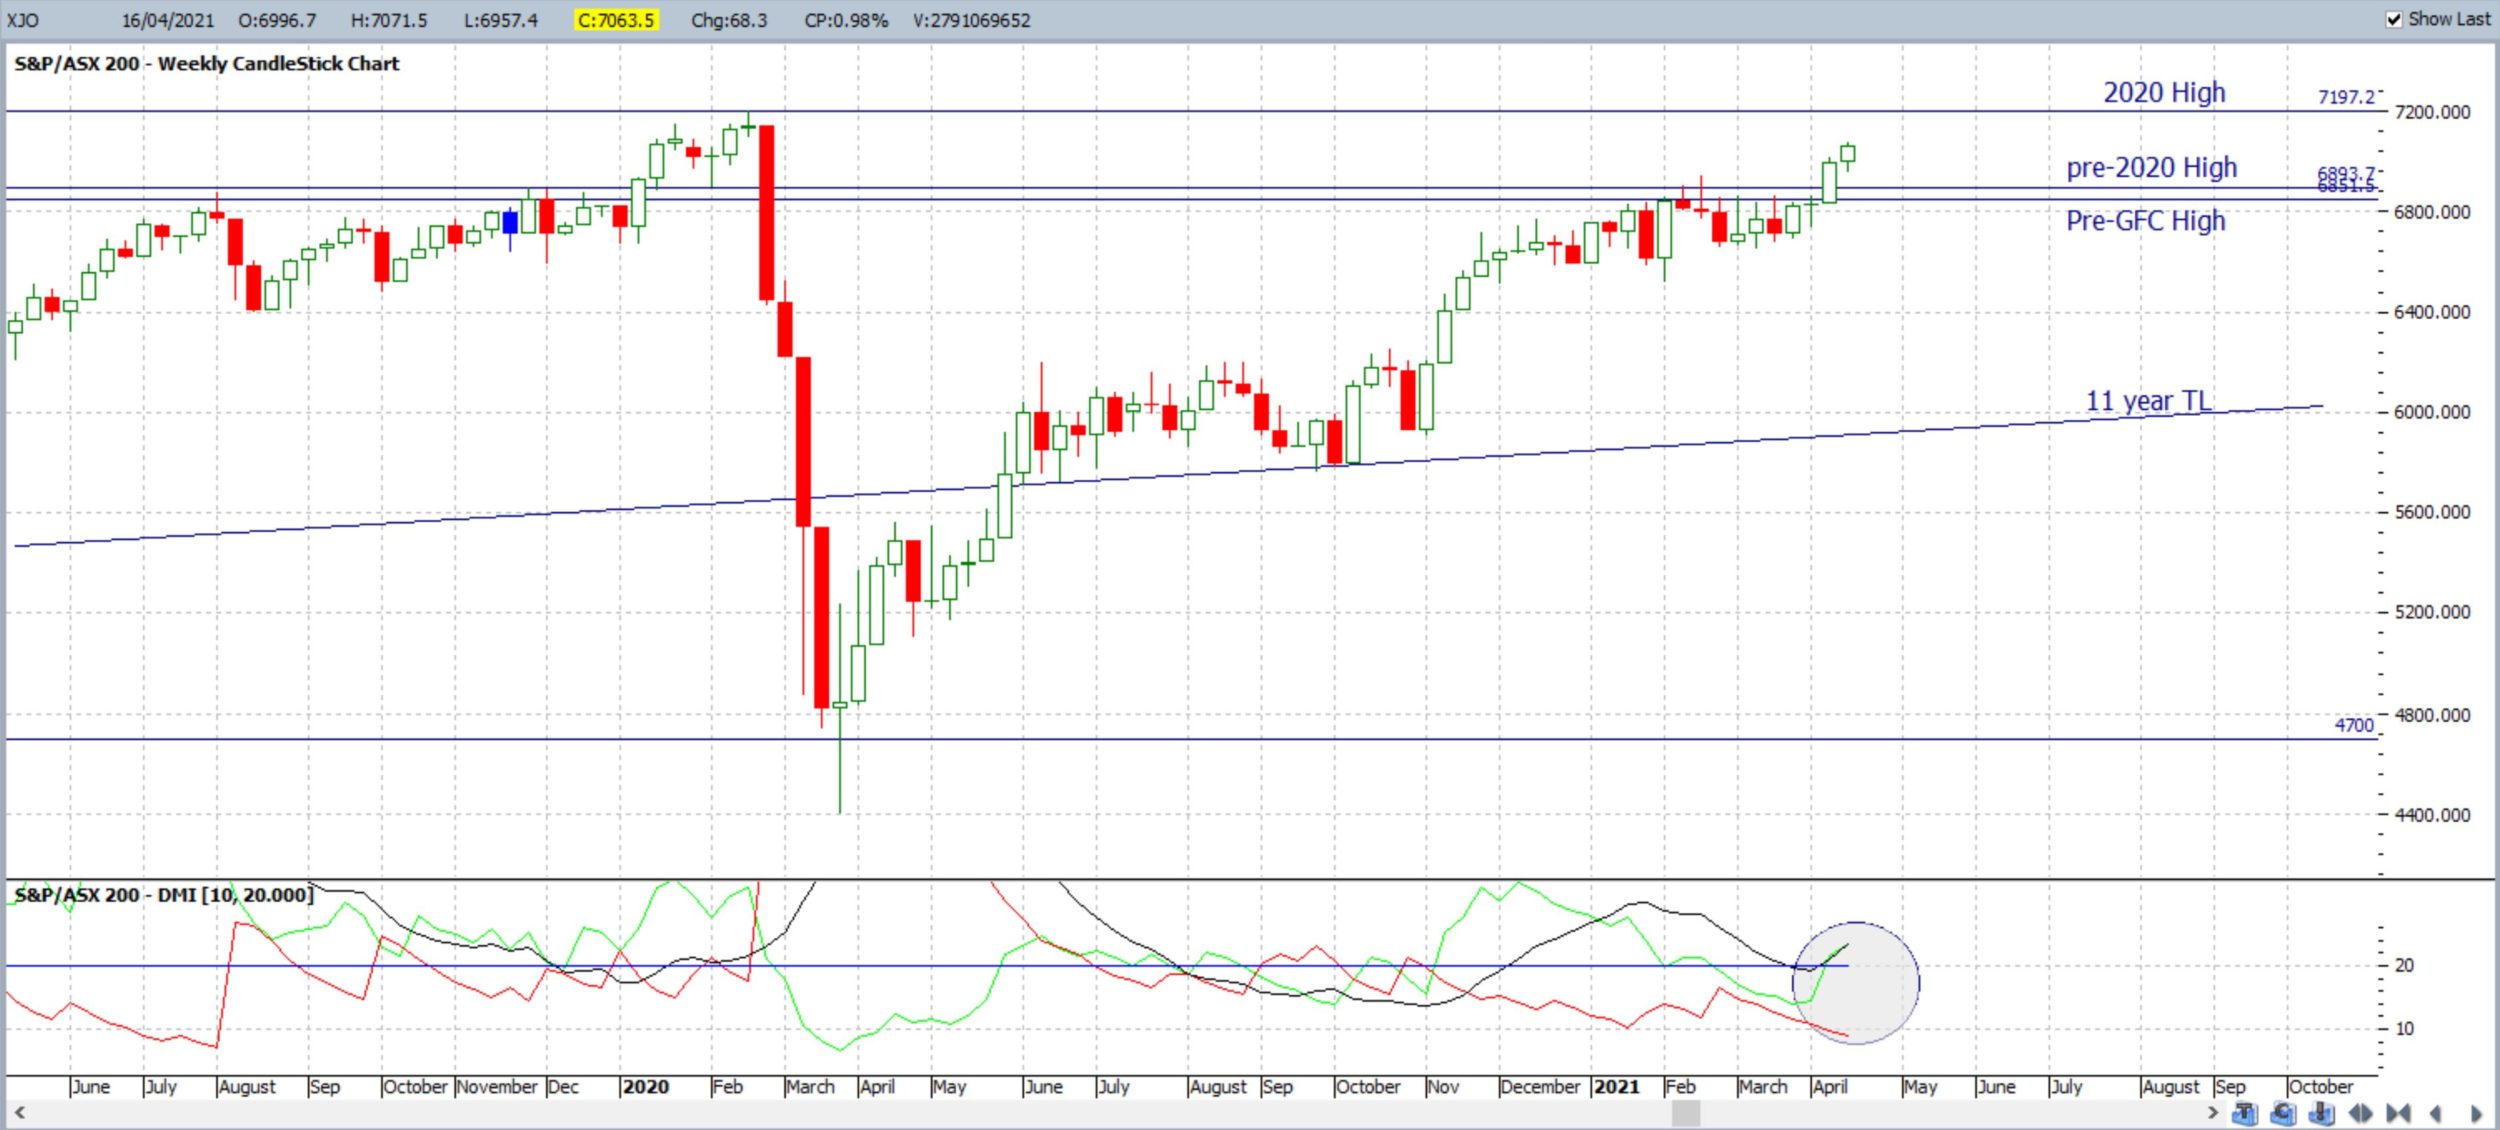
ASX-200: XJO: The ASX-200 closed with a bullish weekly candle, above the pre-GFC High of 6,851.50 and pre-2020 High of 6,893.7 and now above the 7,000 whole-number level making the 2020 High of 7,197.20 the resistance level to monitor for any significant breakout move. I noted in last week’s update how bullish momentum was building and this proved to be a good clue here!
Trading volume was a bit higher last week but still remains below the 200 MA and the bear trend line.
XJO weekly: keep watch for any new b/o above the 200 MA and bear TL:
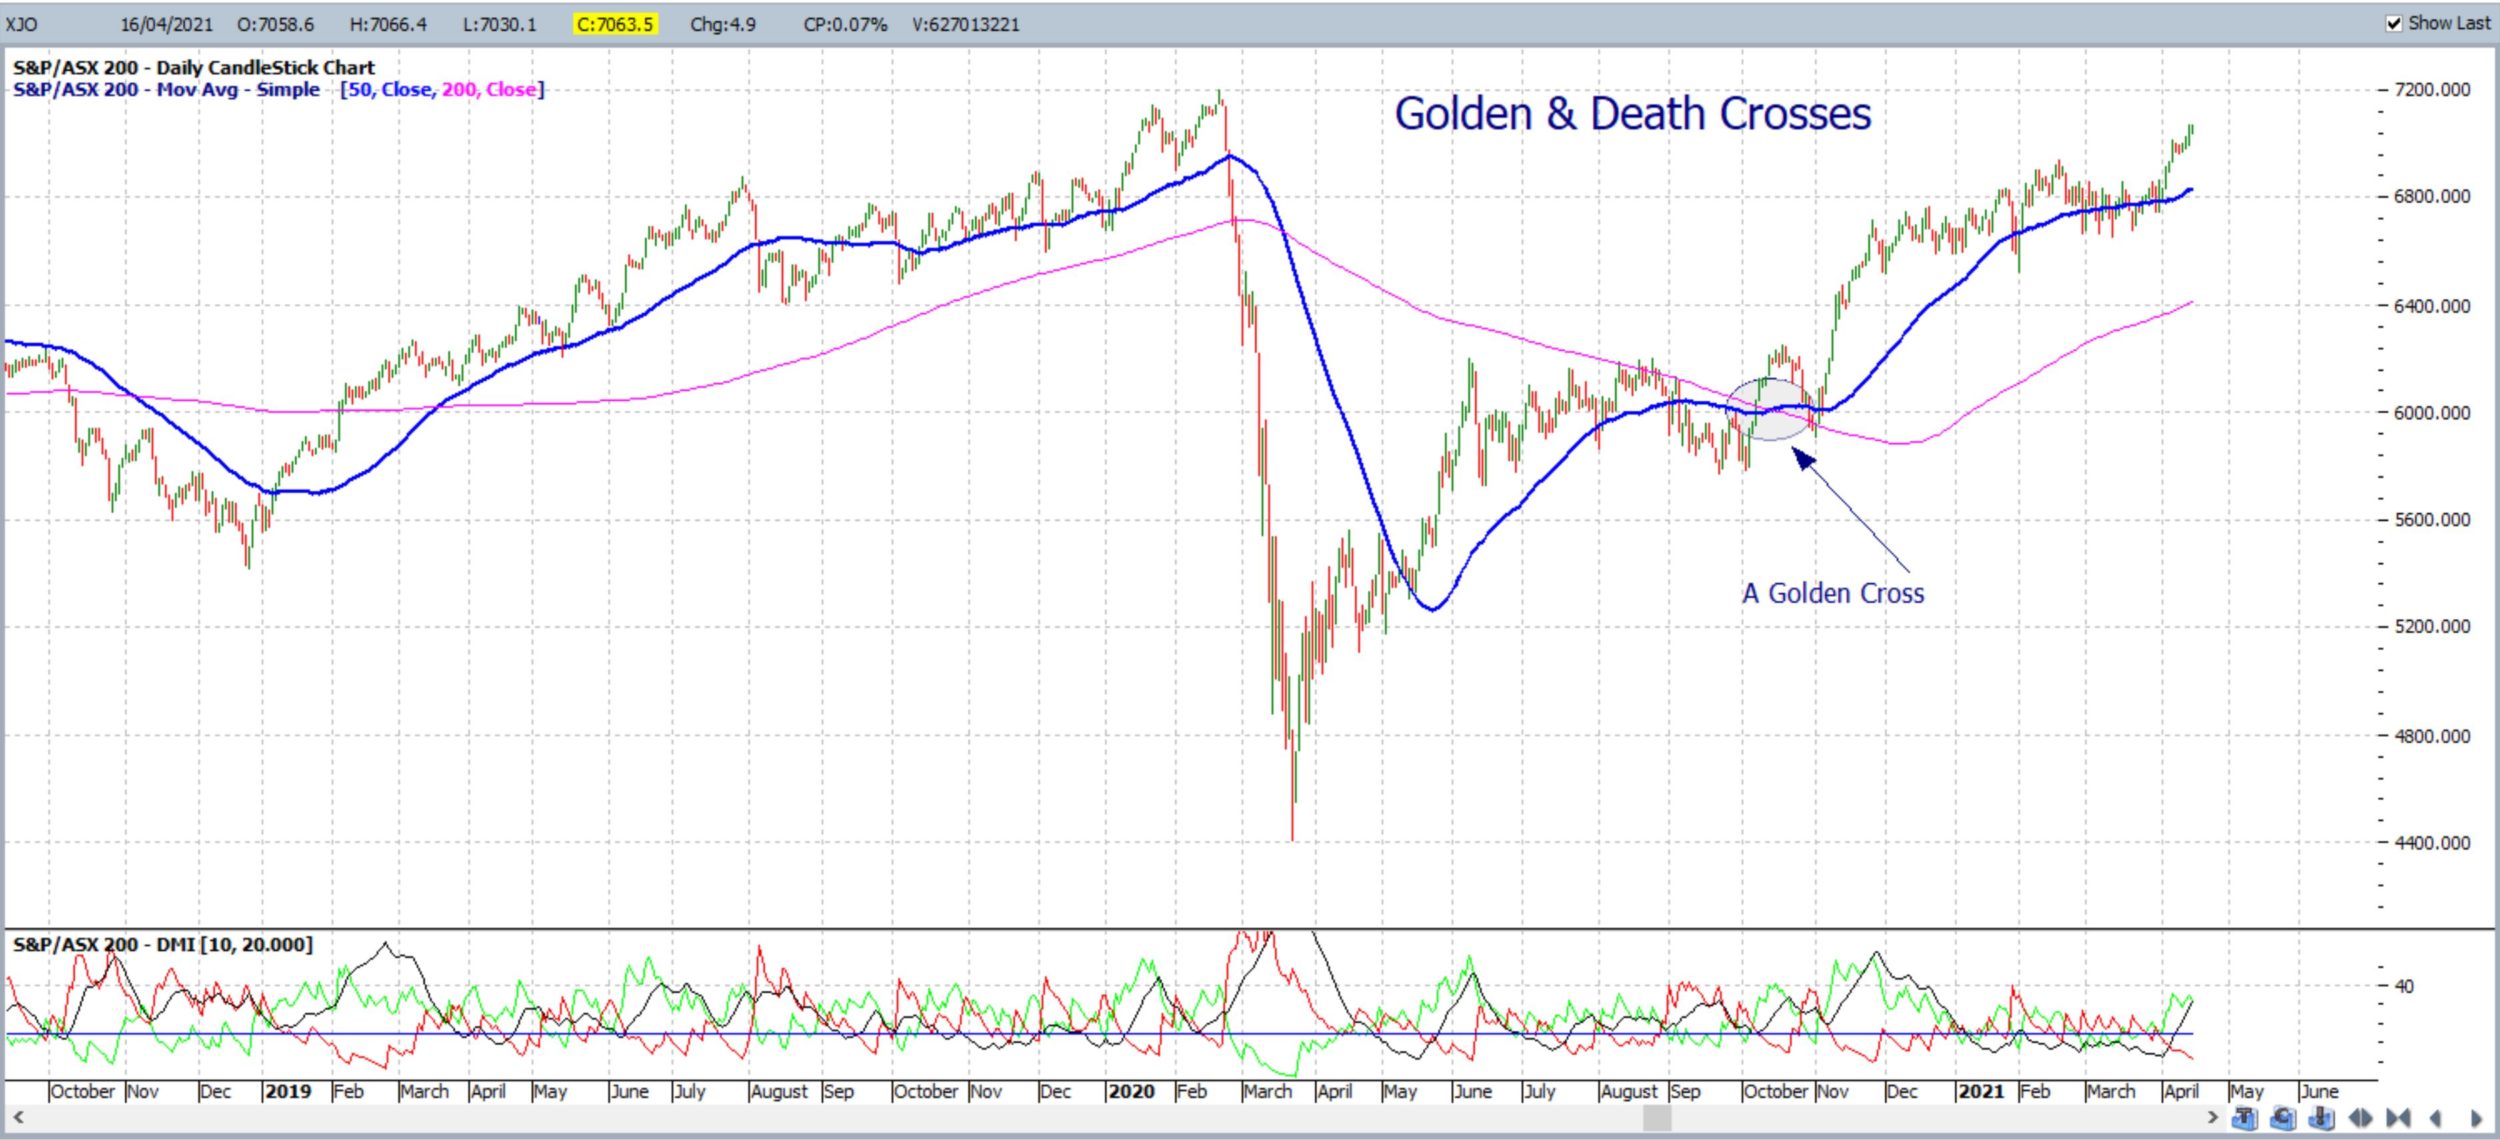
Keep in mind that the recent Golden Cross still remains valid. The Golden Cross is a bullish signal where the 50 SMA crosses above the 200 SMA. Such crosses are often, but not always, followed by a decent bullish run so these crosses are worth noting:
XJO daily: the recent Golden Cross remains valid for the time being:
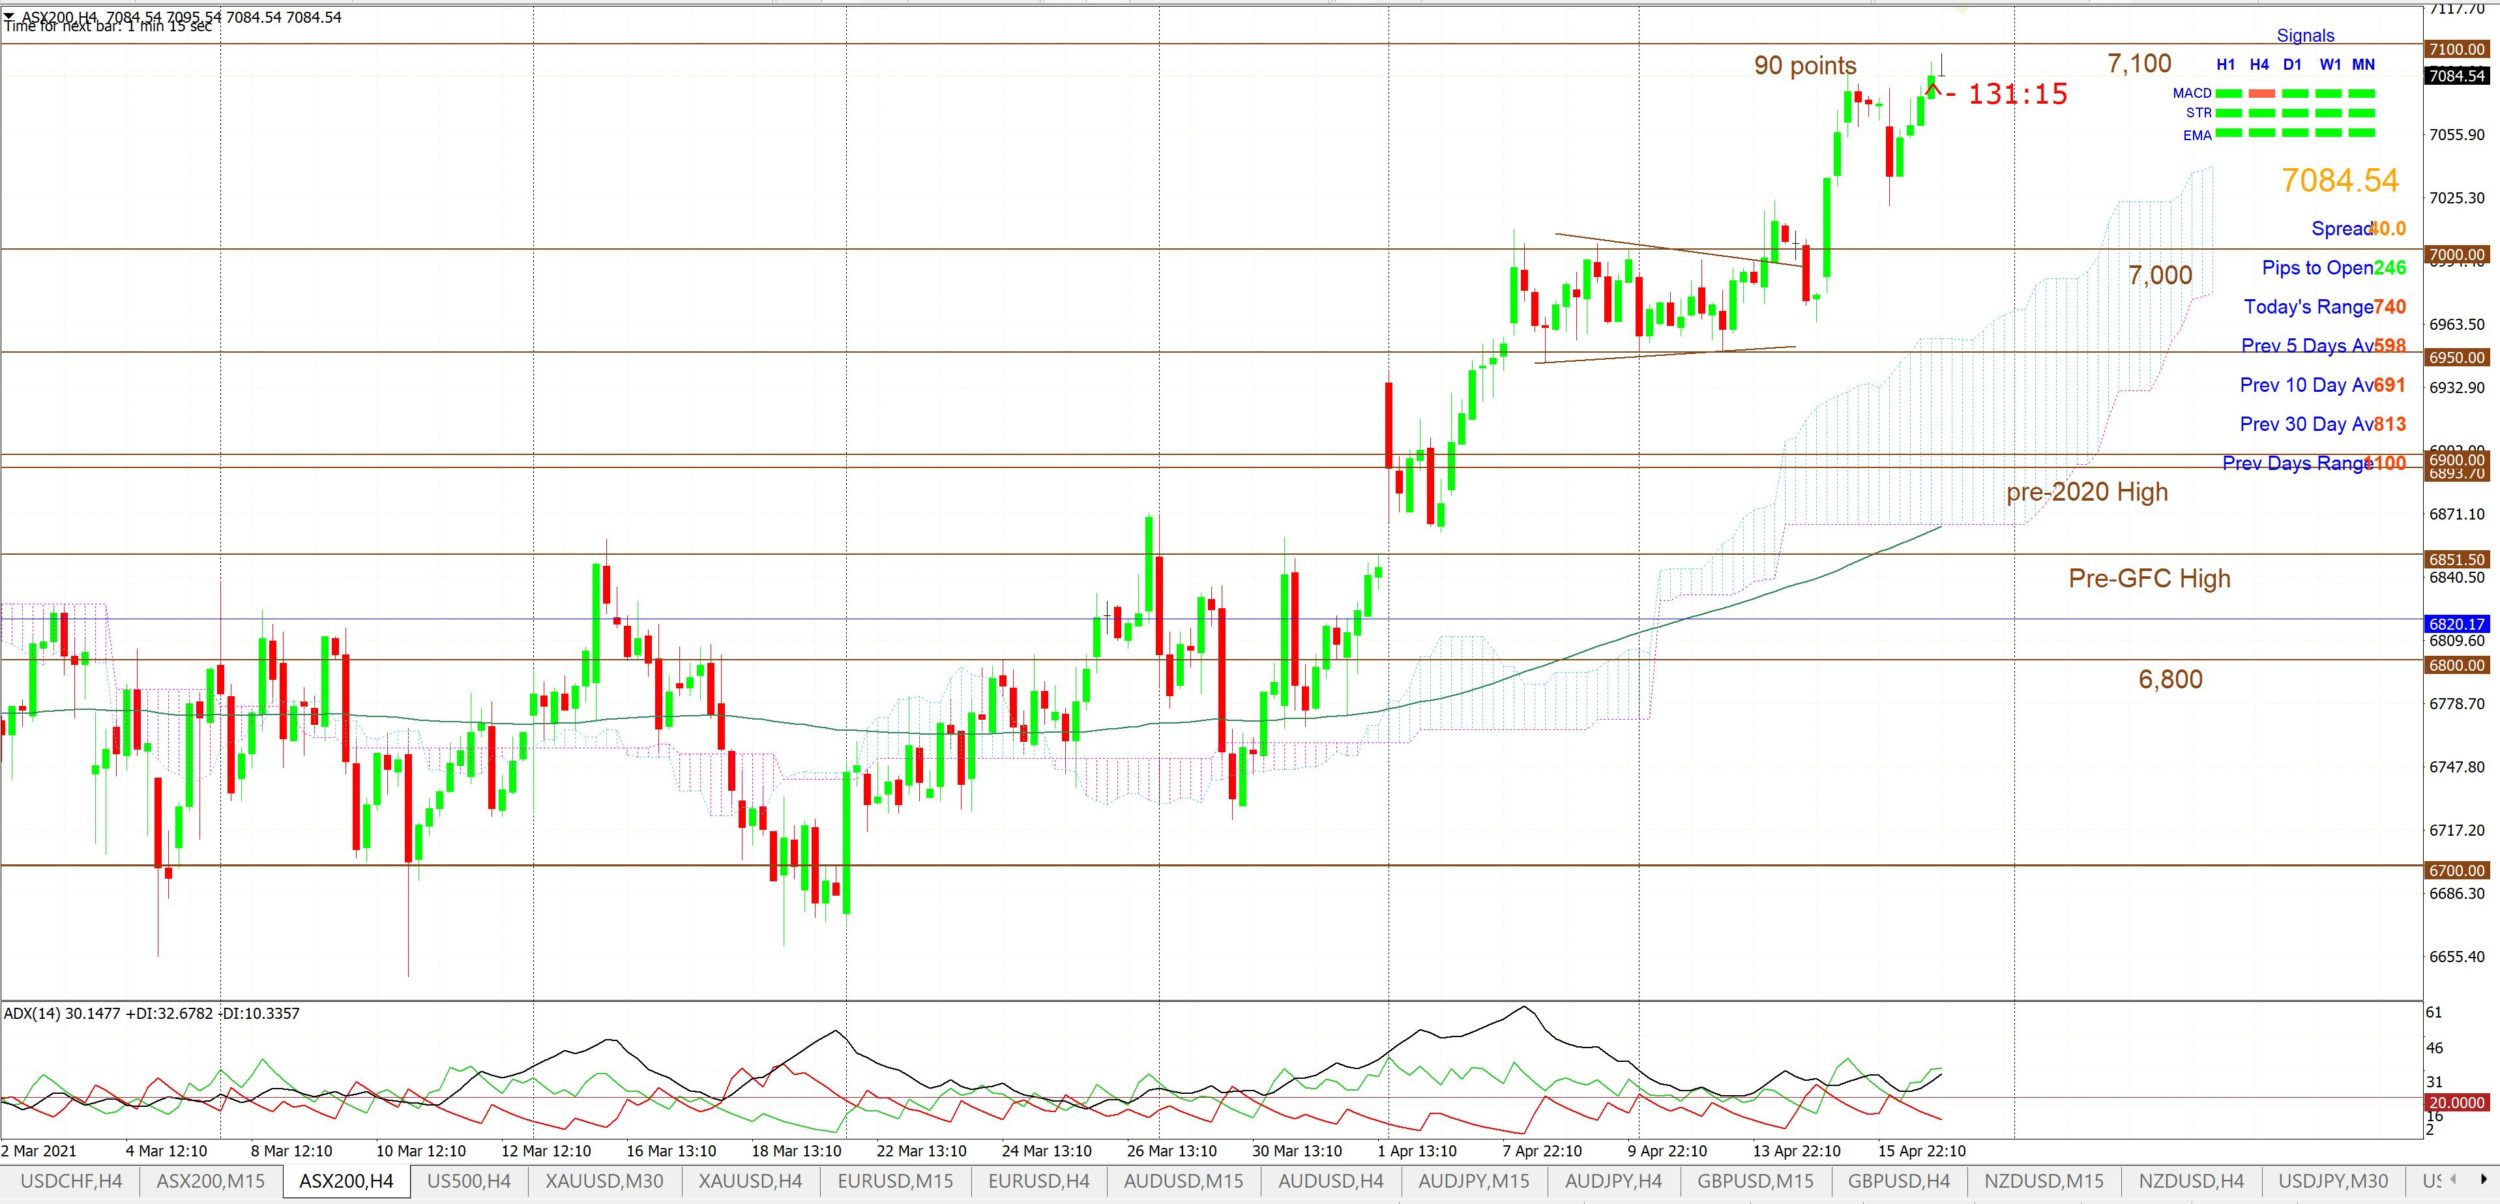
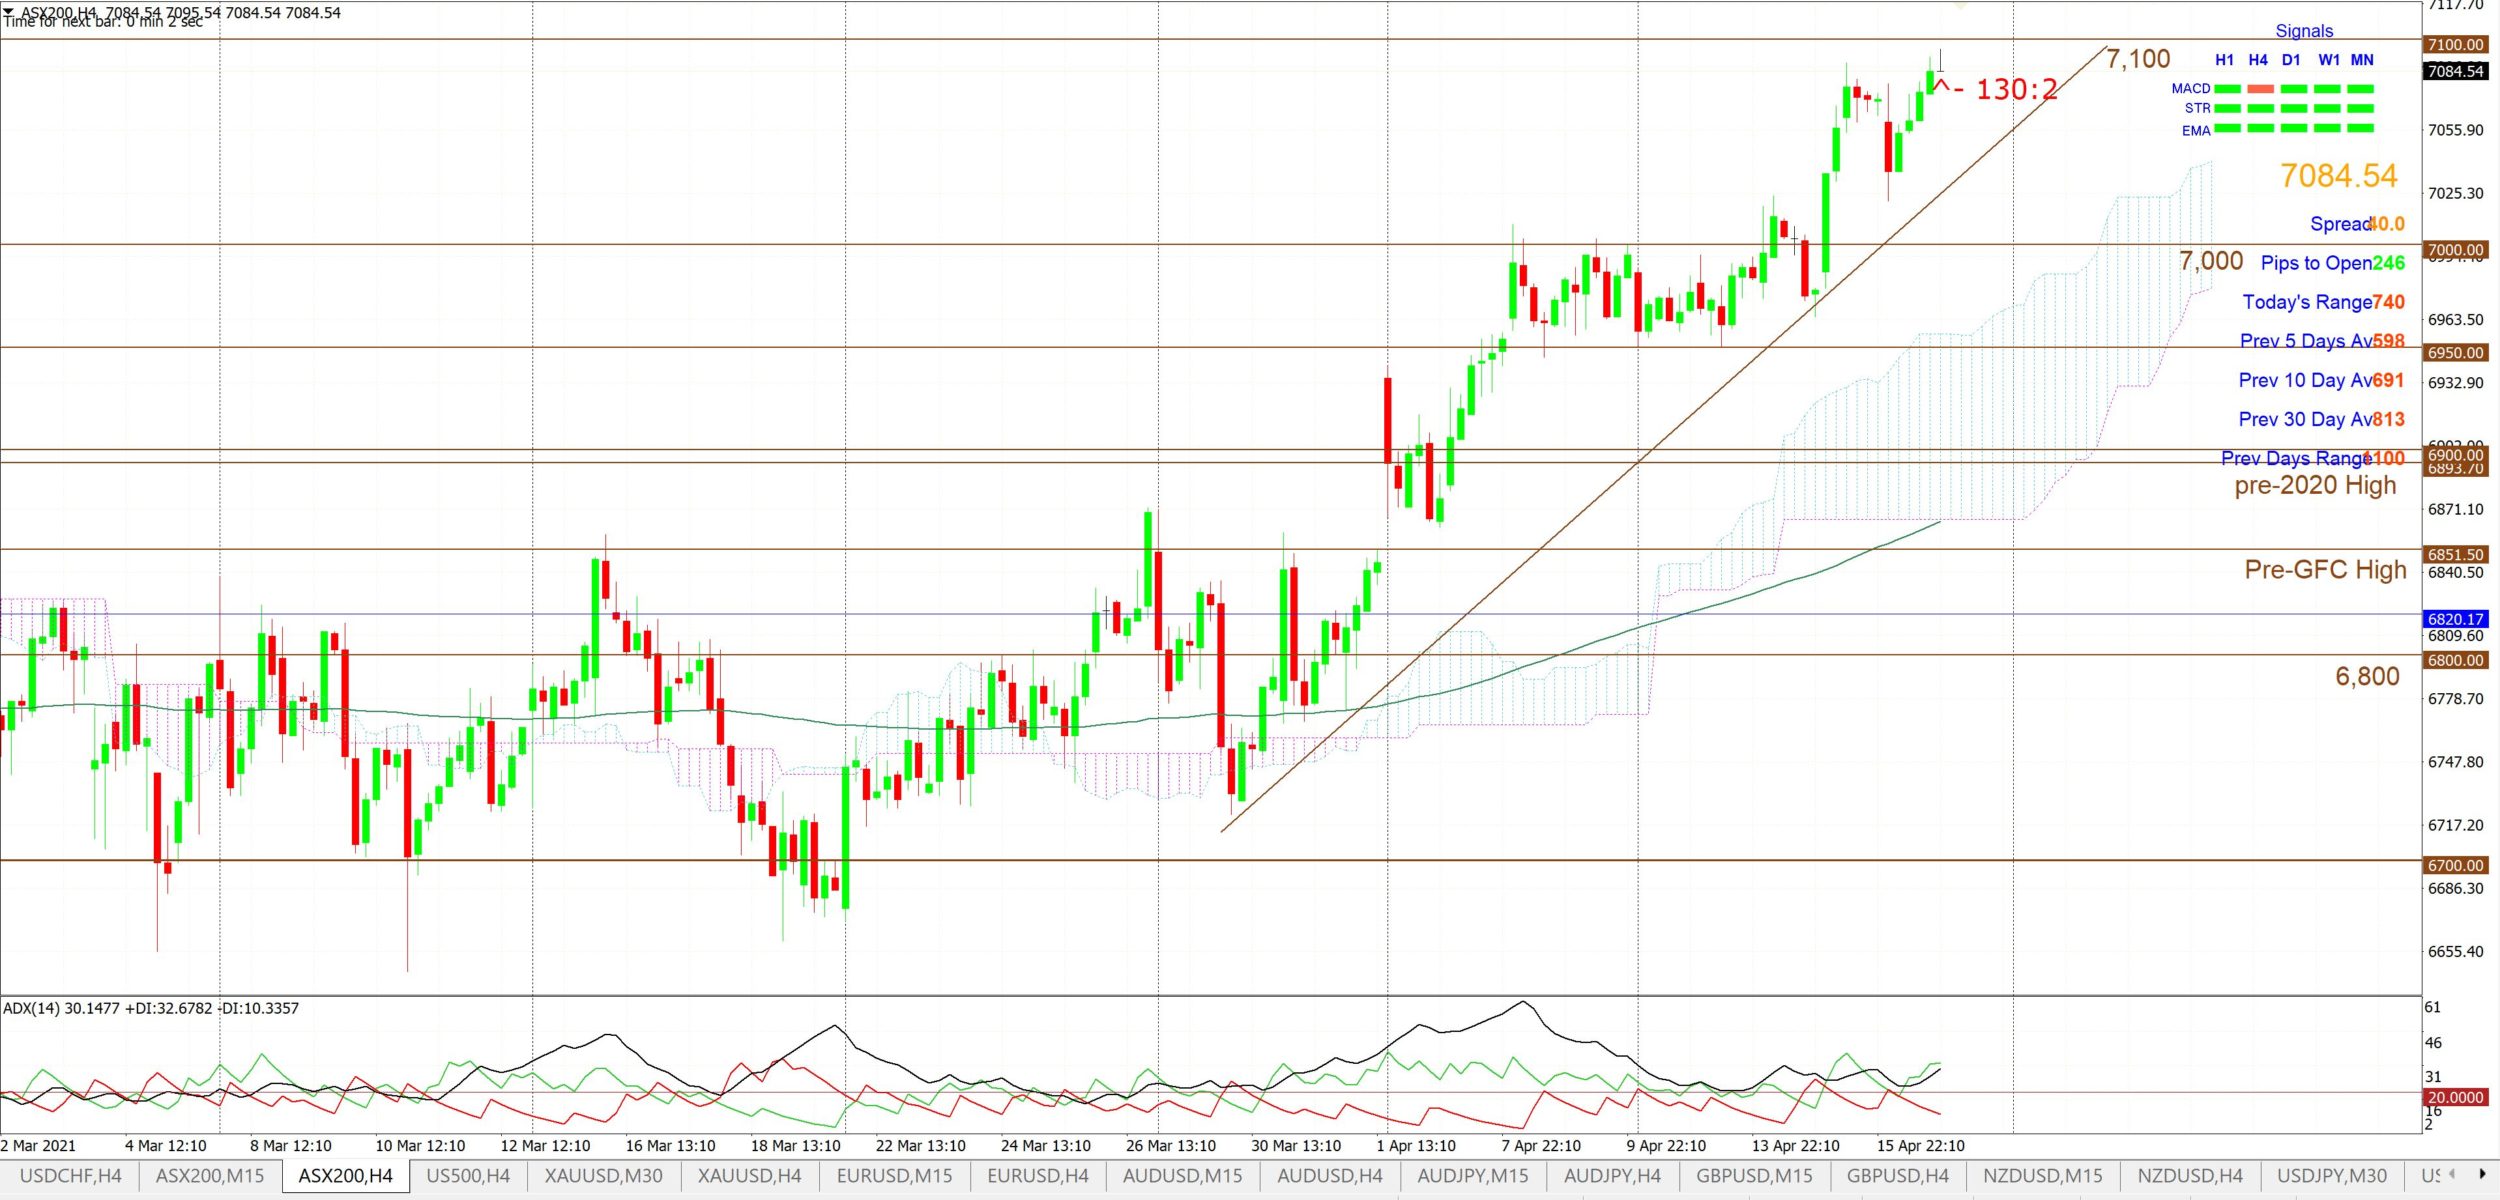
There are revised 4hr chart trend lines (on the second chart) to monitor for any new breakout.
As pointed out last week: Note how bullish ADX momentum is above the 20 threshold, and now moving higher, on both the daily chart and weekly charts.
Bullish targets: Any bullish 4hr chart breakout above 7,100 would bring the 2020 High of 7,197.20 into focus.
Bearish targets: Any bearish hold below 7,100 and break of the recent support trend line would bring 7,000, the pre-2020 High of 6,893.70 and the pre-GFC High of 6,851.50 back into focus followed by 6,800 and 6,700 into focus.
- Watch 7,100 and for any new 4hr chart trend line breakout:
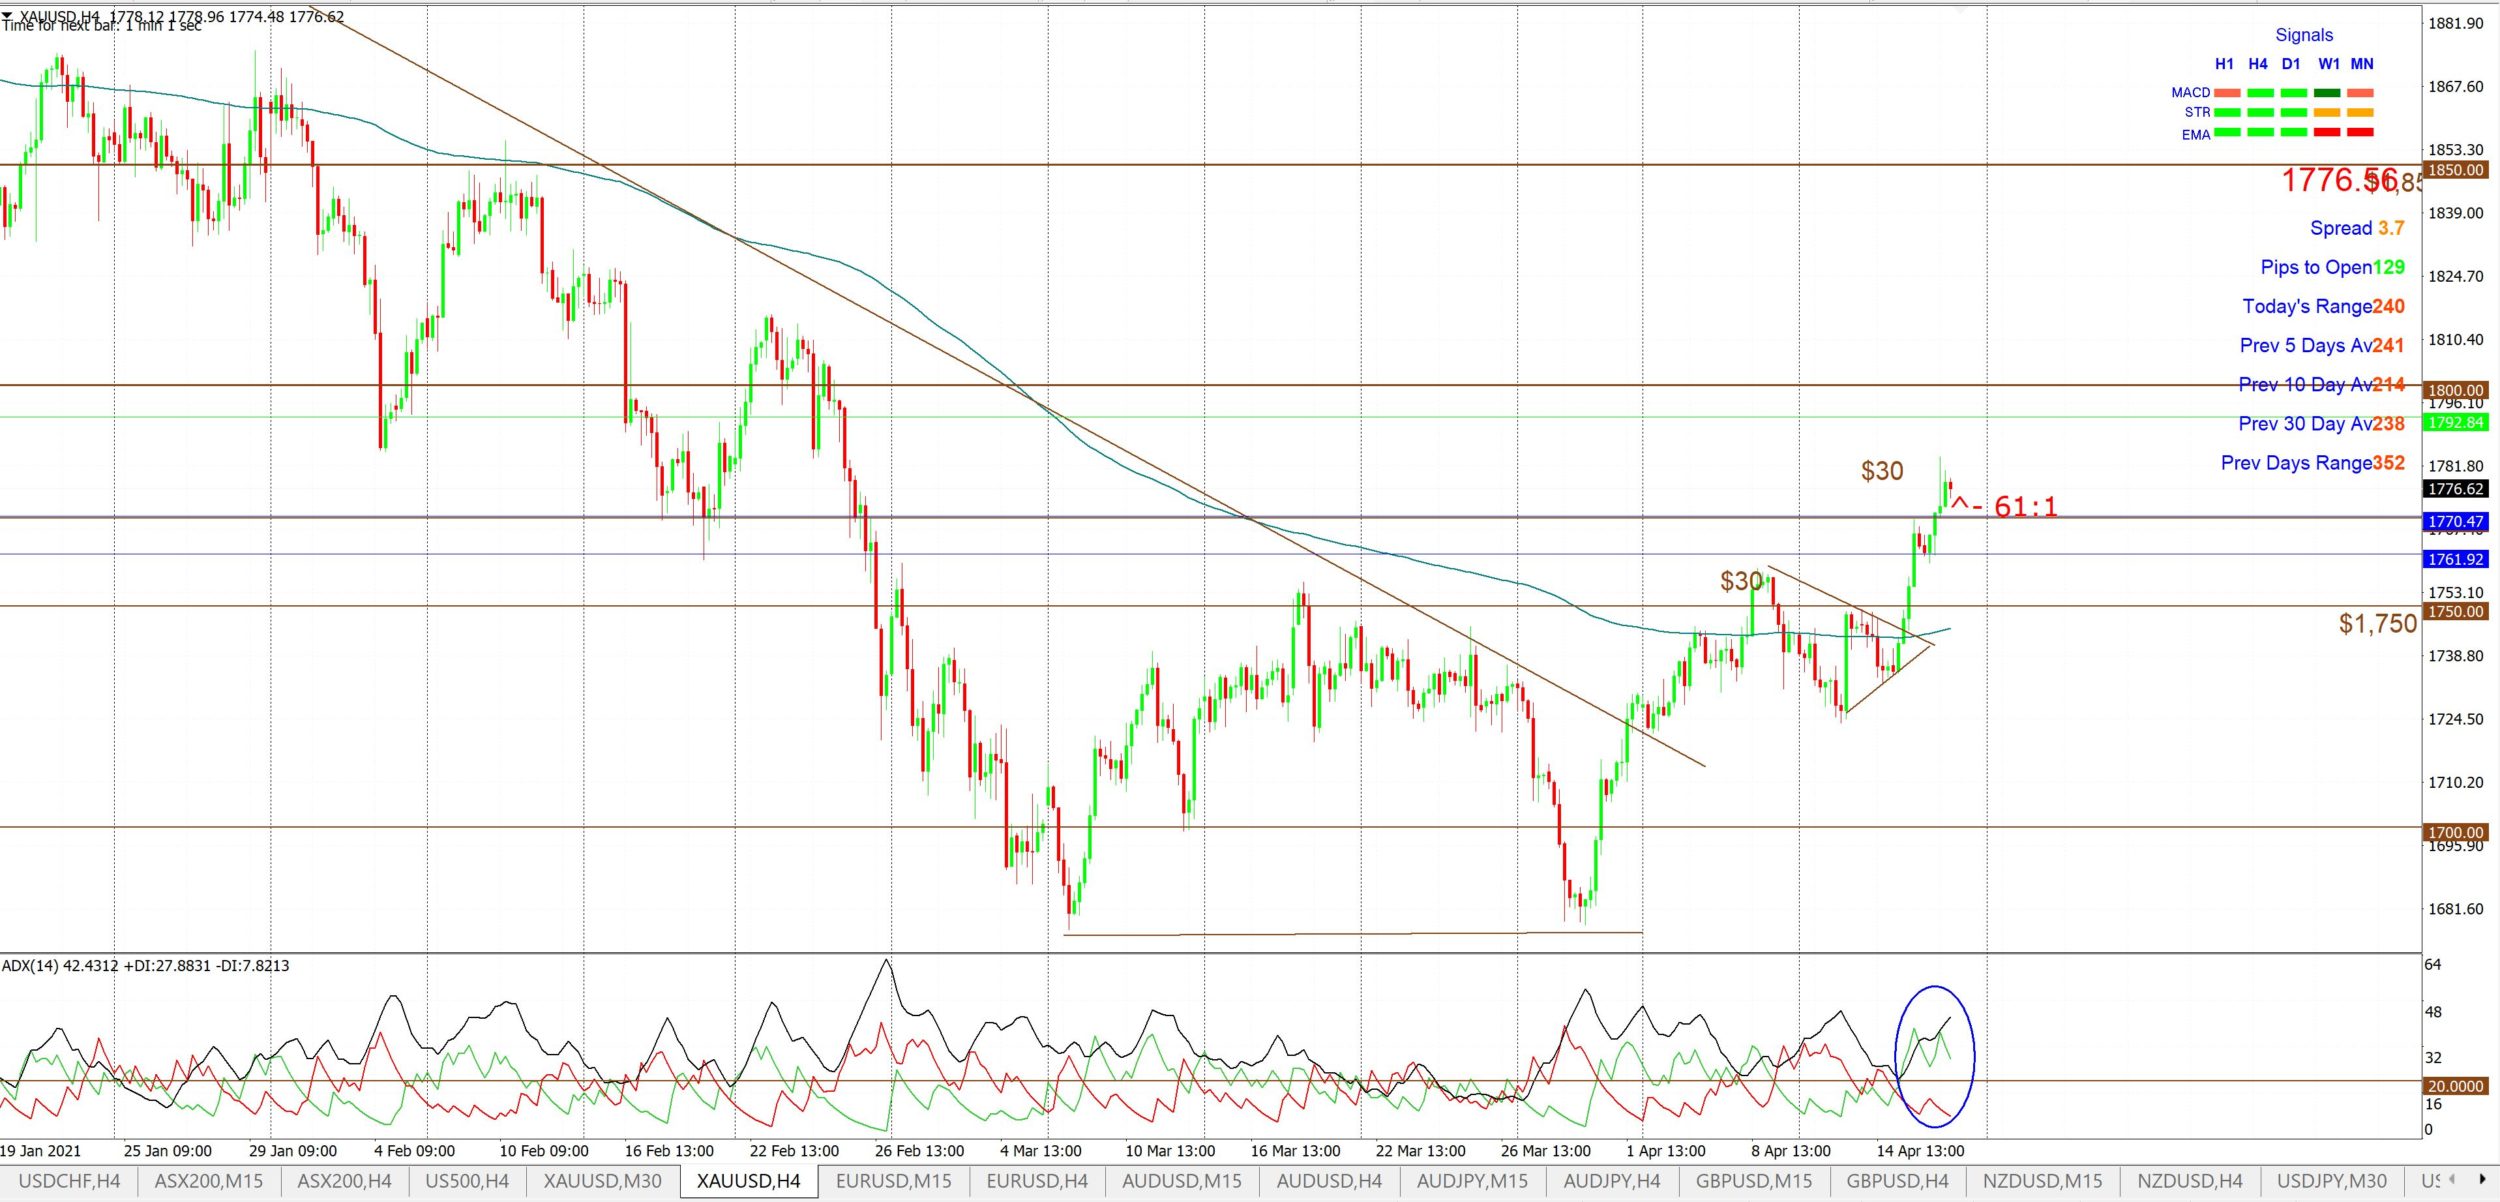
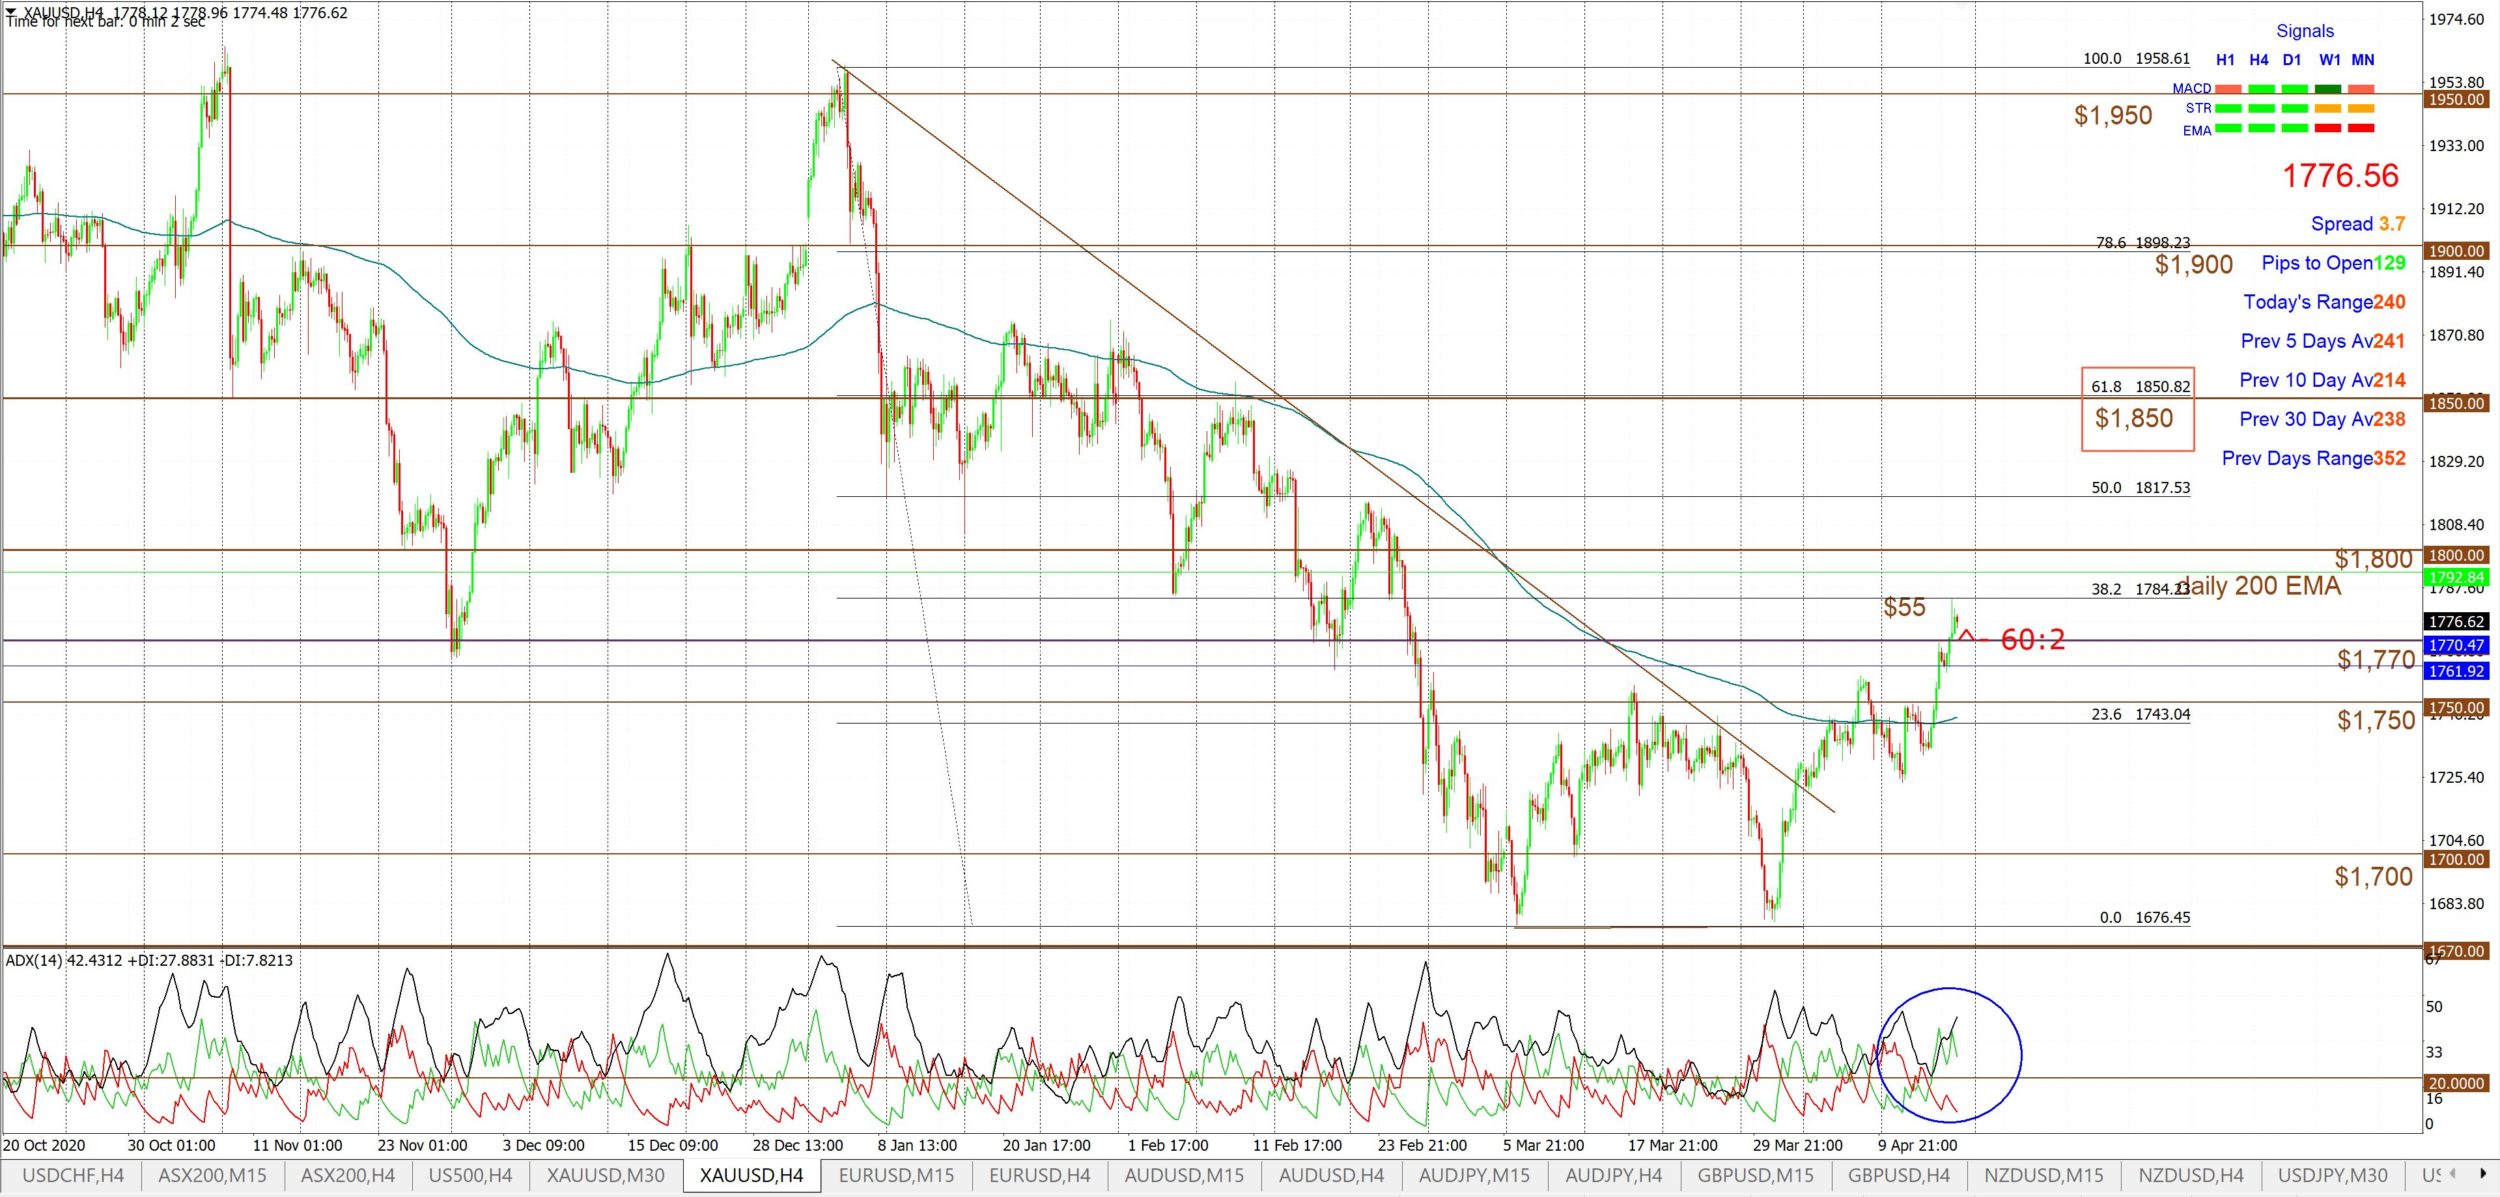
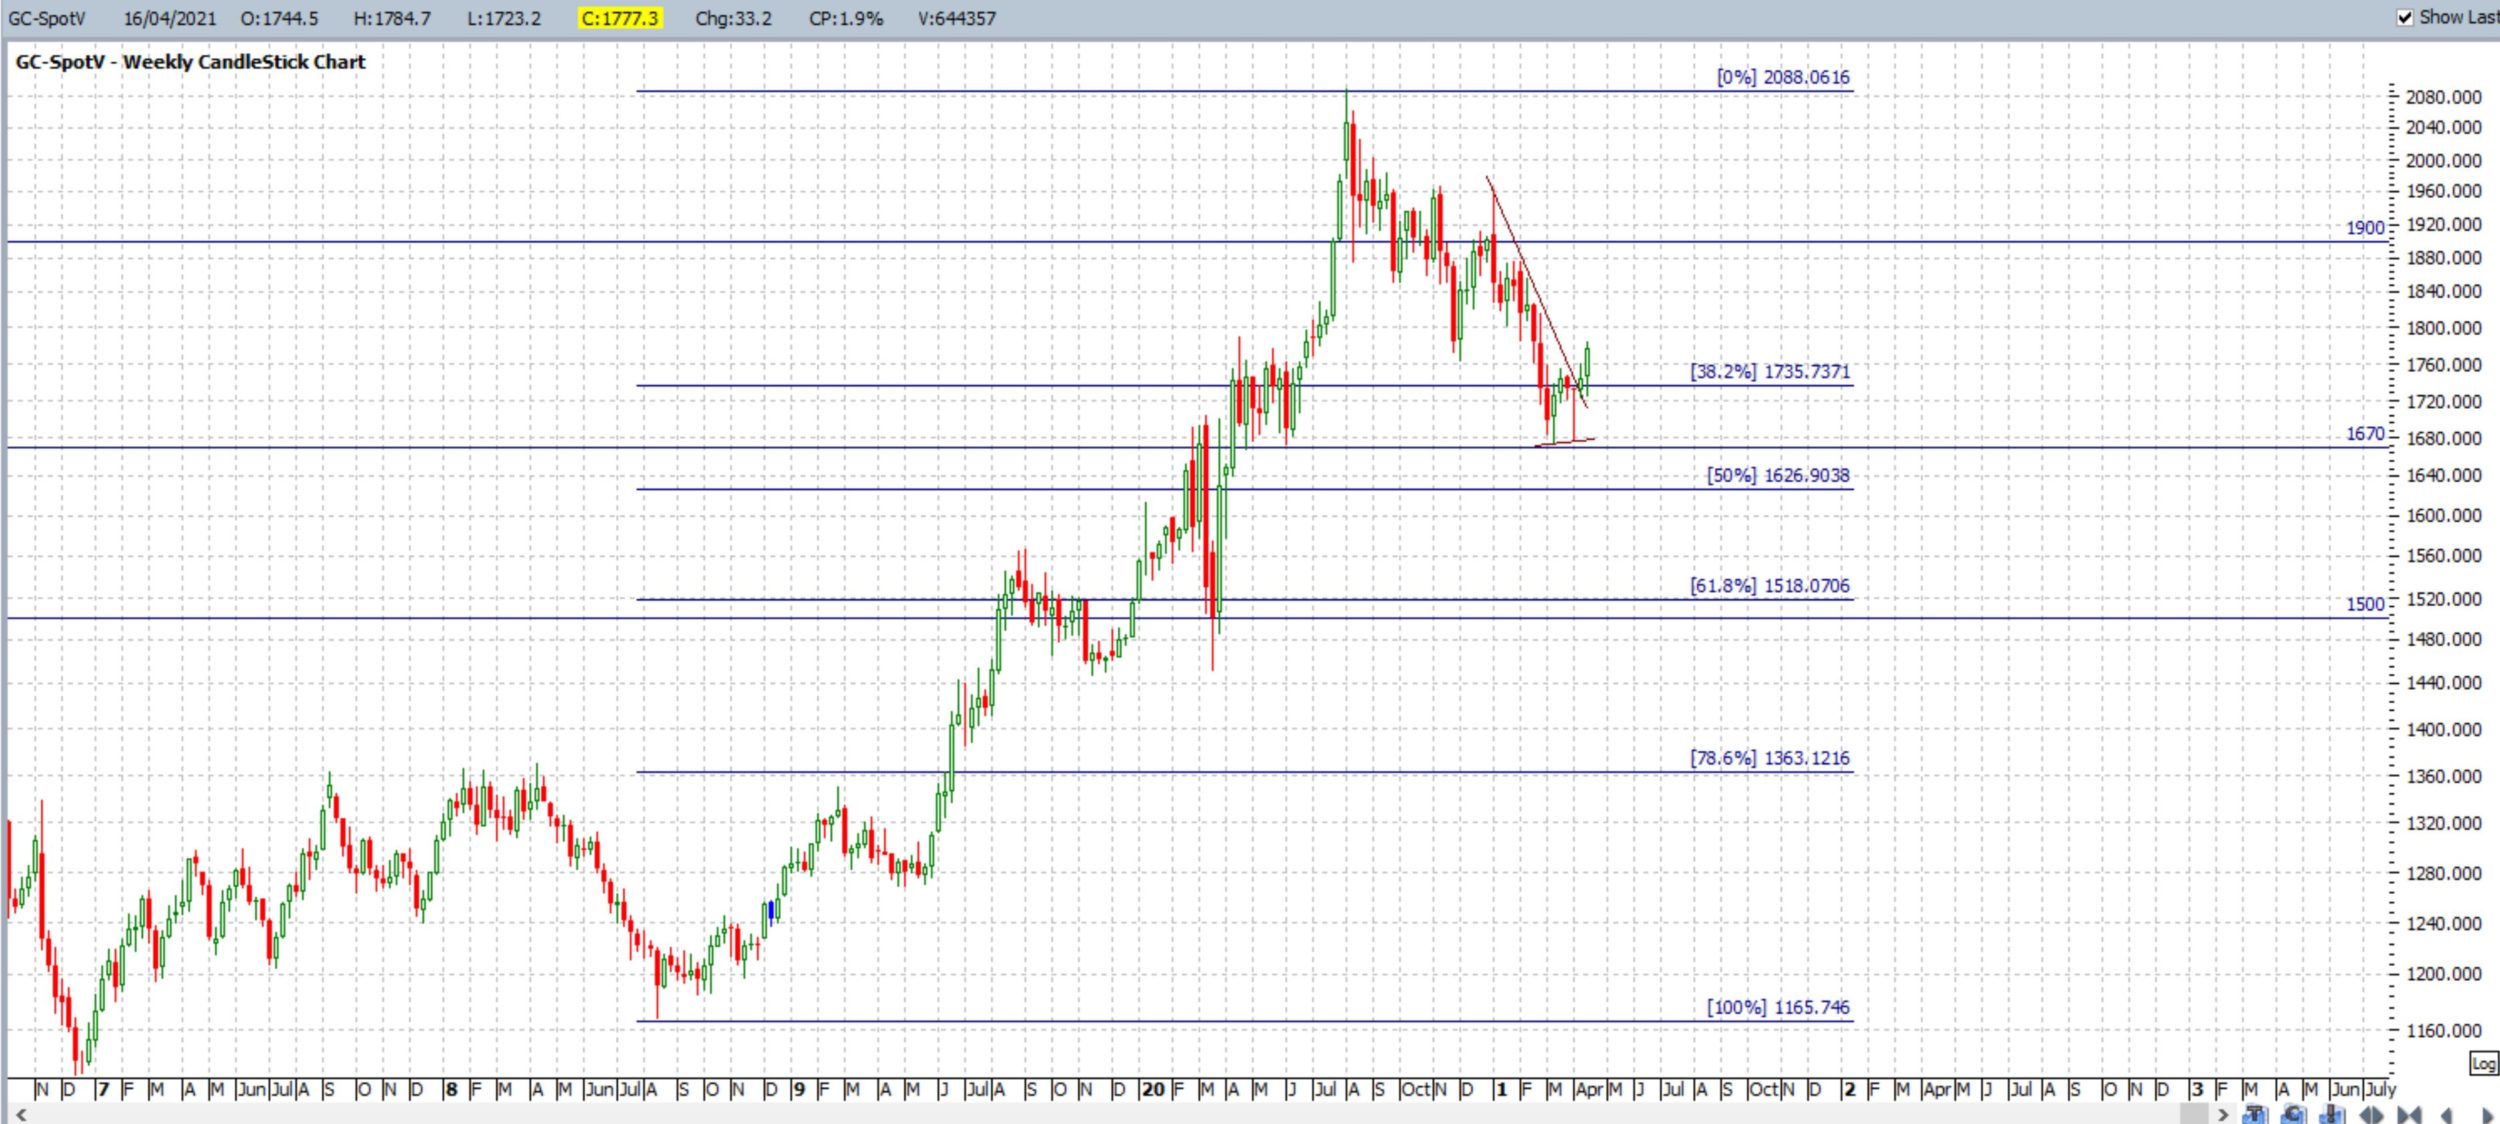
Gold: Gold closed with a bullish weekly candle and just under $1,780 making this the resistance level to watch for any new make or break. The recent bullish wedge breakout continues and has given around $55 but watch for any new break above $1,780 to support any continuation move.
Bullish +DMI momentum and the ADX are now both above the 20 threshold on the 4hr and daily time frames so watch for any continued bullish shift here.
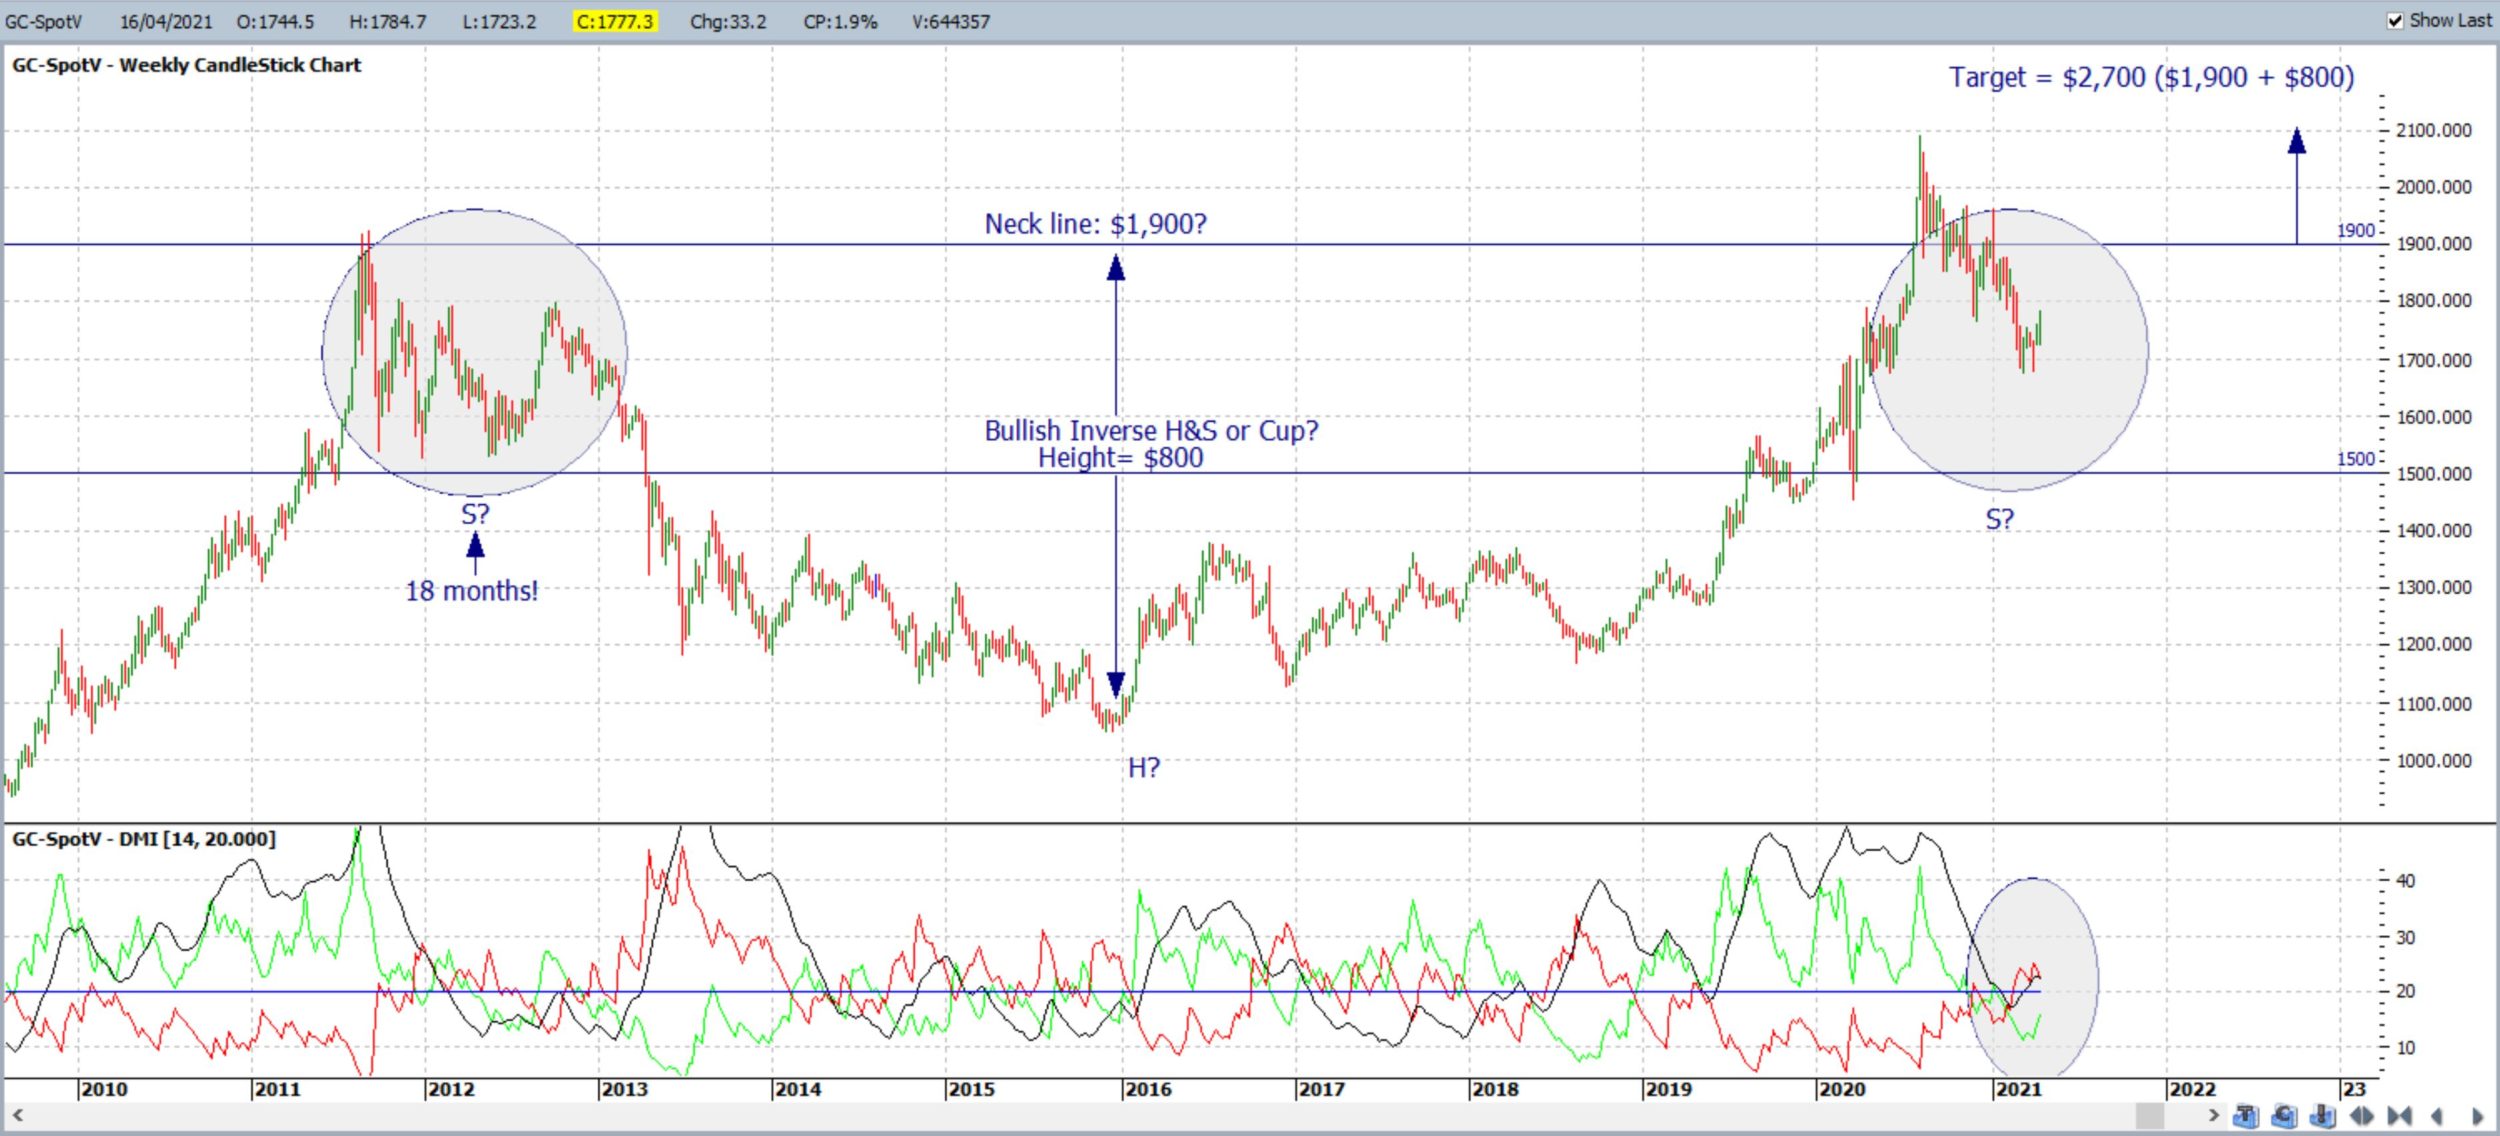
As mentioned over recent months: The hold below $1,900 acts as further evidence in support of the longer-term Inverse H&S thesis that I have been discussing as an option here for many months.
The weekly chart still has the look of a broad Inverse H&S pattern; or some may see this as a broad Cupping style pattern. Both are rather similar though as they are bullish patterns and suggest follow-through to the order of magnitude of the depth of the Cup / height of Head. In this case, that move is of around either $800. Keep watch of $1,900 now that price action is trading below this neckline region!
$1,900 remains the region in focus for any bullish Cup or Inverse H&S breakout:
- Any hold above $1,900 would support the Cup pattern thesis.
- Any move back below $1,900 would support the Inverse H&S pattern thesis.
Traders need to watch this $1,900 level over the coming sessions especially as the US$ index is still below the recently broken 10-year support trend line:
- any US$ hold below the multi-year support trend line could help send Gold higher.
- any US$ move back above this support trend line could keep Gold range-bound. This would help to further develop the Inverse H&S pattern.
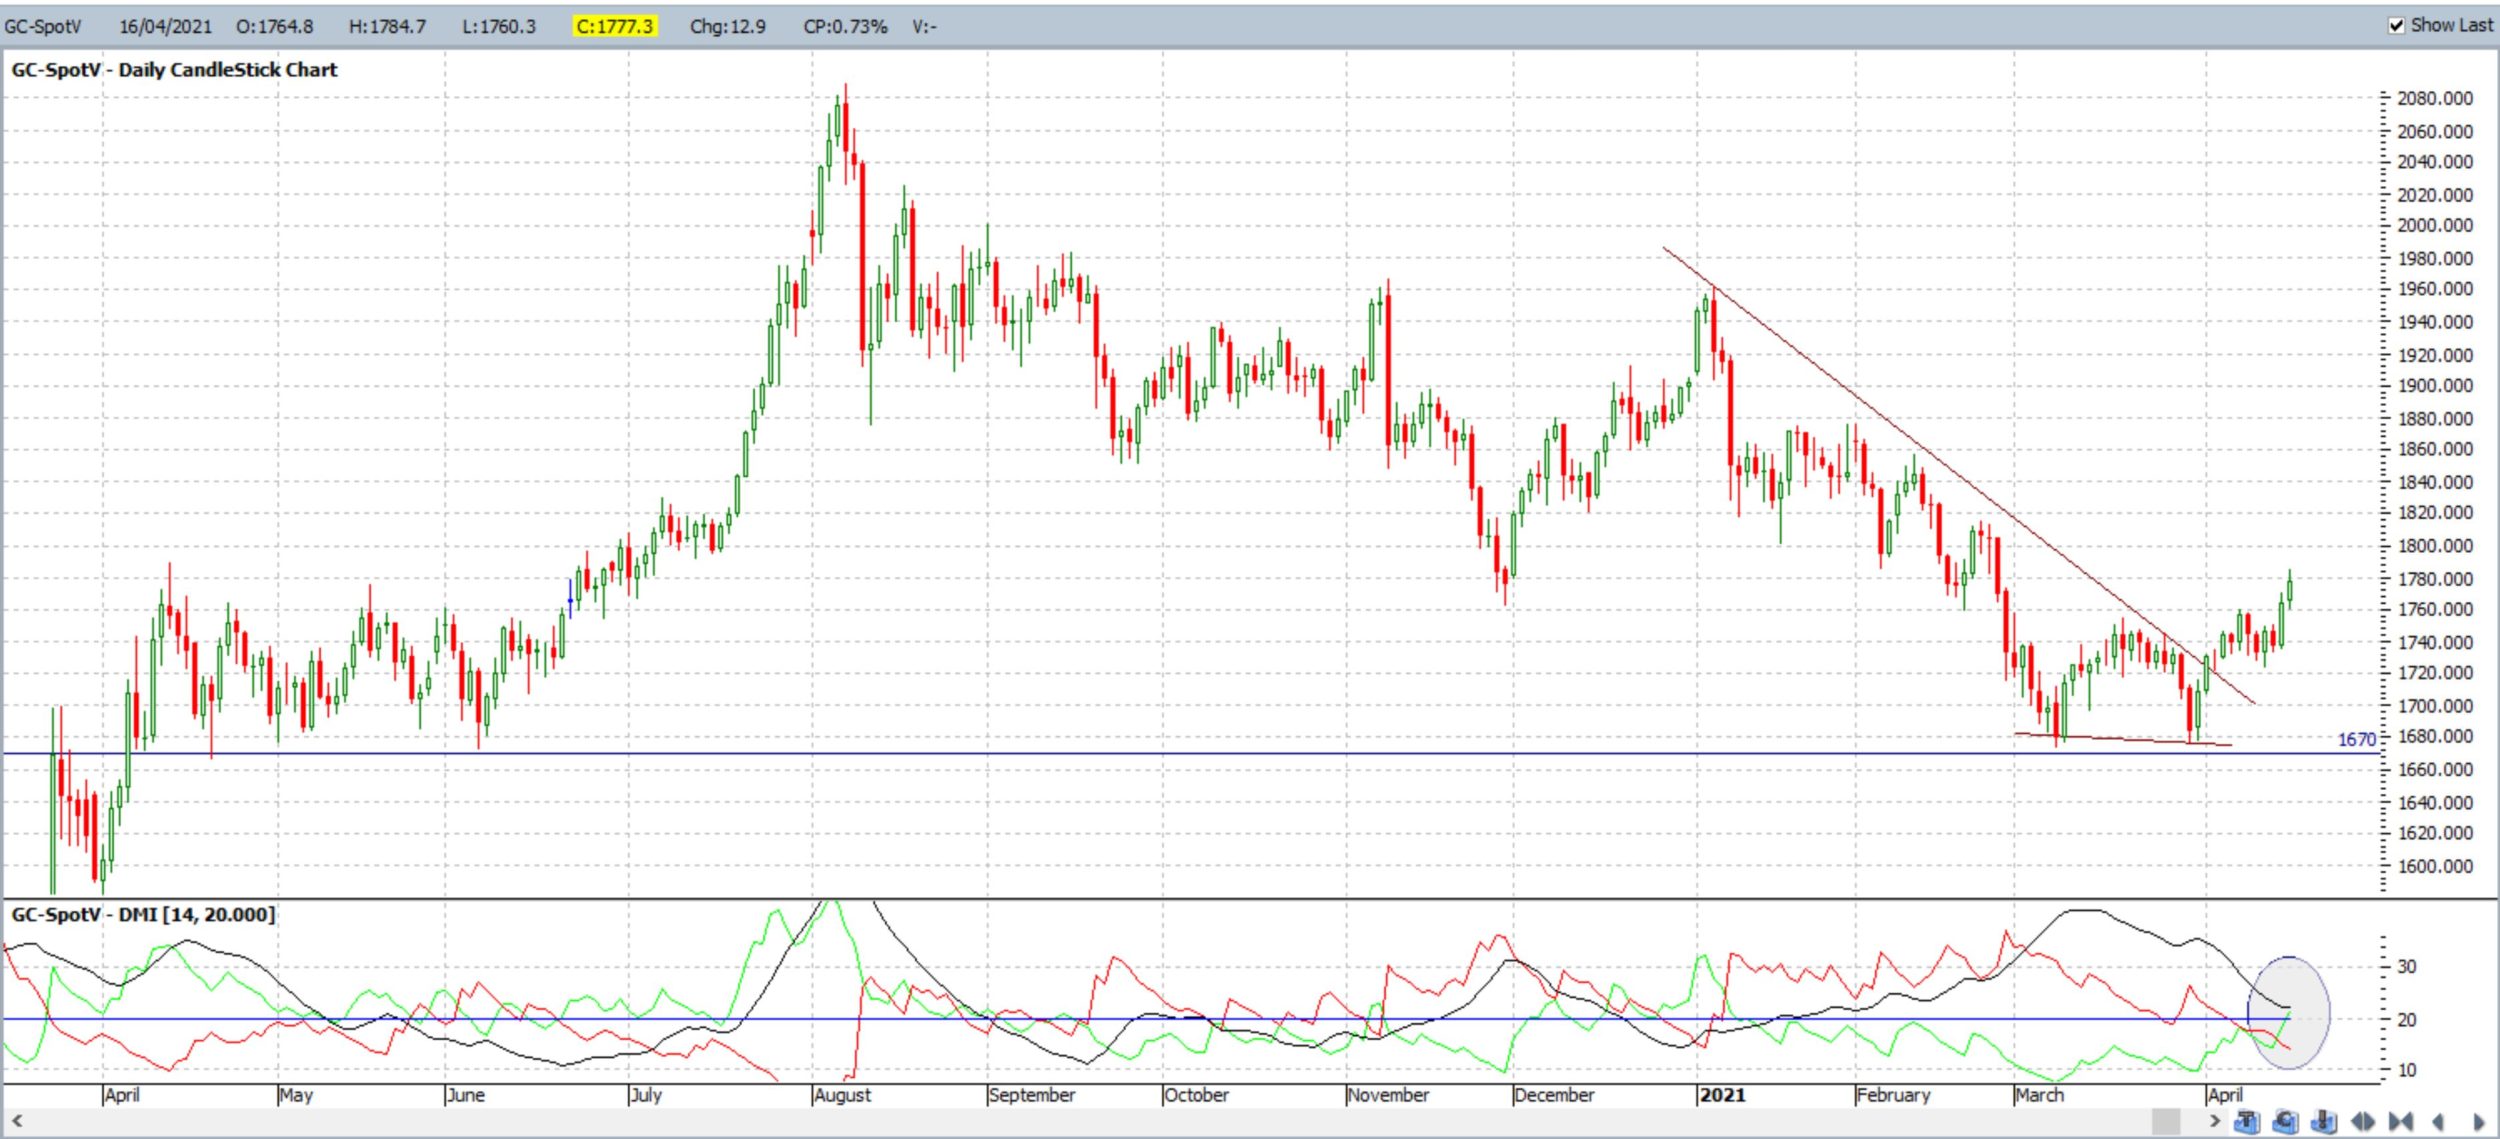
The daily chart reveals the importance of the $1,670 level so this continues to be a ‘line in the sand’ support level to monitor. Any new weekly close below the $1,670 level would bring $1,500 into greater focus. The two weekly charts show that $1,500 is:
- near the 61.8% Fibonacci of the Aug 2018 – Aug 2020 swing High move.
- forms the lower boundary of the Inverse H&S pattern I have had on my charts for many months.
Bullish targets: any bullish 4hr chart continuation move above $1,780 would bring $1,800 into focus followed by $1,850 and $1,900.
Bearish targets: any bearish 4hr chart retreat from $1,780 would bring $1,770, $1,750 and $1,700 into focus followed by the $1,670 support level.
- Watch $1,780 for any new make or break:
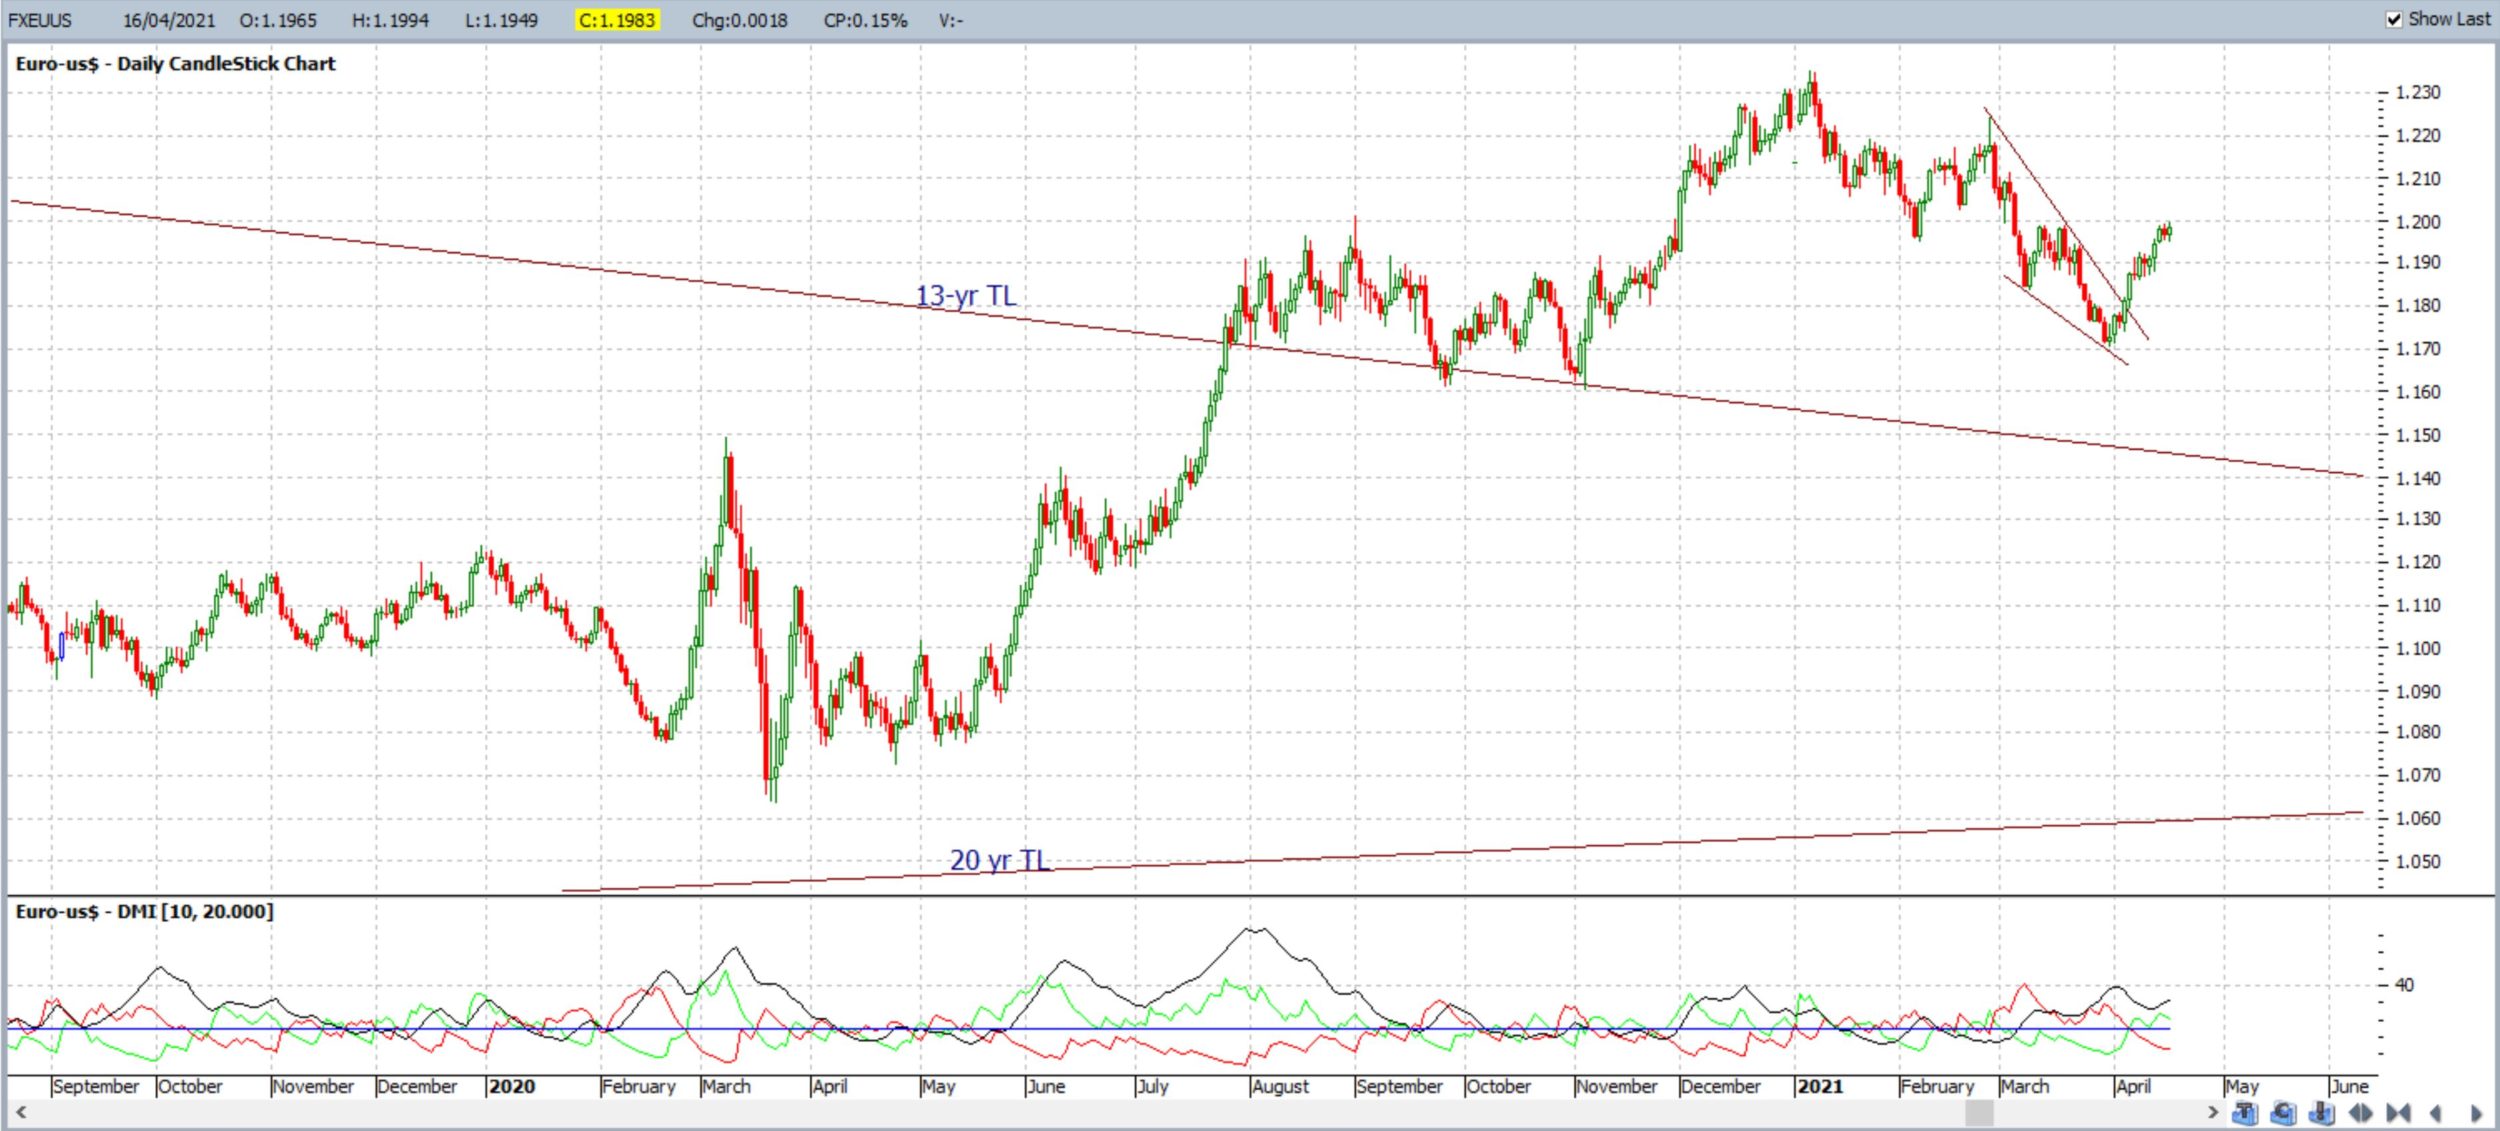
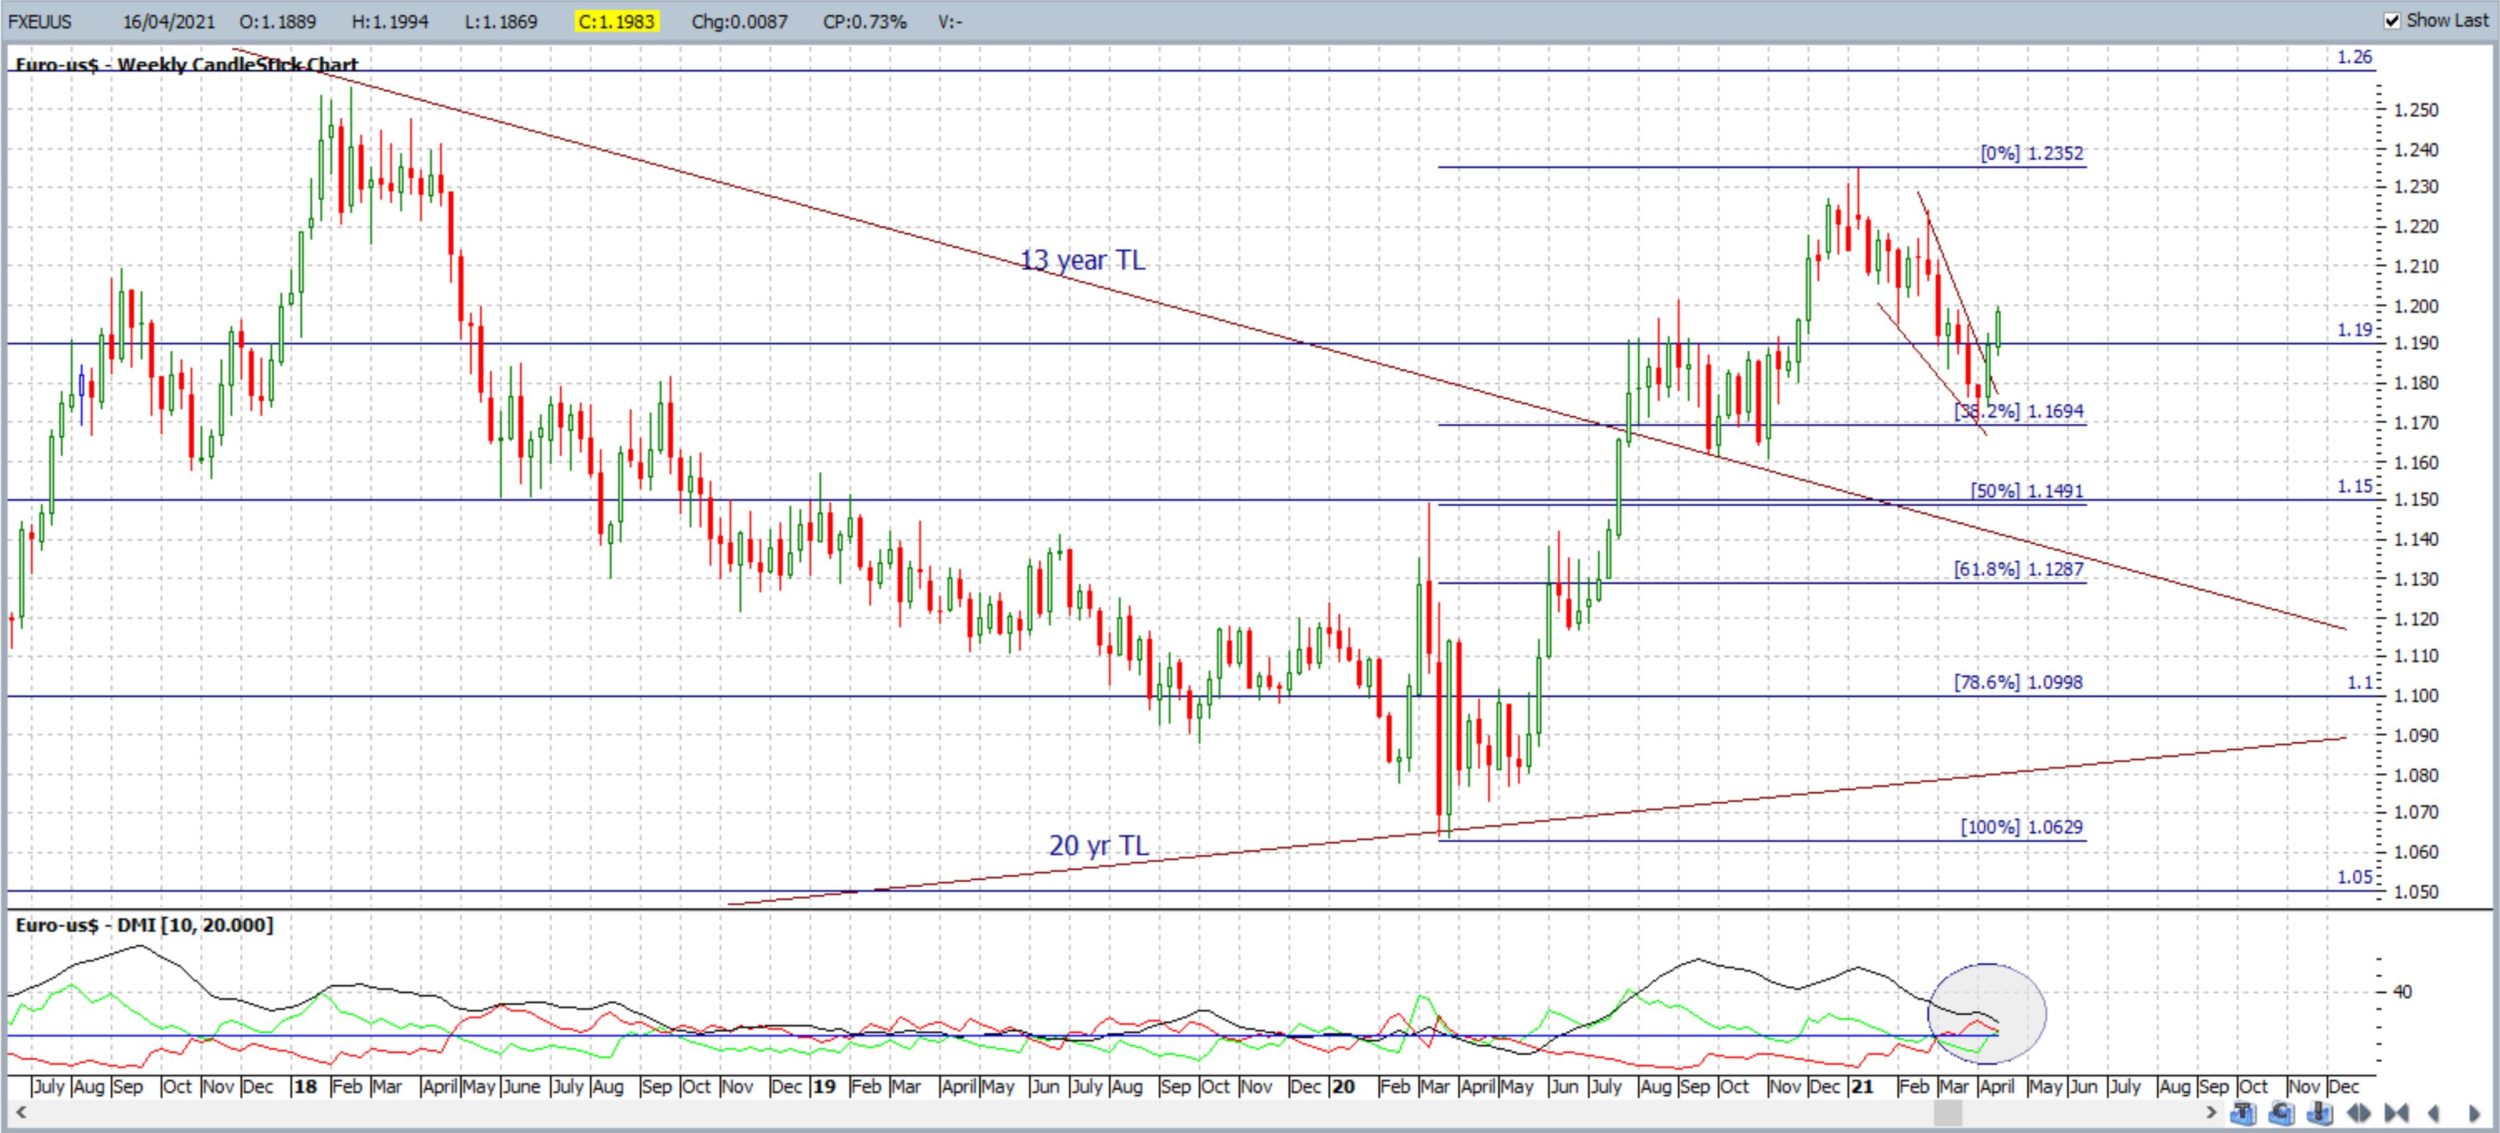
EUR/USD: The EUR/USD closed with a bullish weekly candle as the recent bullish descending wedge breakout continues. Last week’s bullish-reversal Morning Star pattern was also a good clue here about bullish continuation. The wedge breakout has now given around 200 pips, and is still going, and so watch the 1.20 level for any bullish continuation move.
NB: Note that the longer-term target for any continued bullish movement following the previous break of the 13-yr trend line is the monthly chart’s 61.8% Fibonacci, near 1.40. This trend line breakout was flagged back in a post on August 2nd 2020. Price at the breakout was around 1.17 and has reached up as far as 1.23, a move of around 600 pips, so this has been a breakout worth monitoring.
Bullish targets: Any bullish 4hr chart continuation above 1.20 would bring 1.21 into focus followed by the monthly 200 EMA and 1.22 level. After that, watch whole-numbers on the way up to a previous weekly chart High, circa 1.26 and, for any continued push up to 1.40.
Bearish targets: Any bearish 4hr chart retreat from 1.20 would bring 1.19, 1.18 and 1.17 back into focus.
- Watch 1.20 and for any continuation 4hr chart wedge breakout; especially with next week’s ECB rate update;
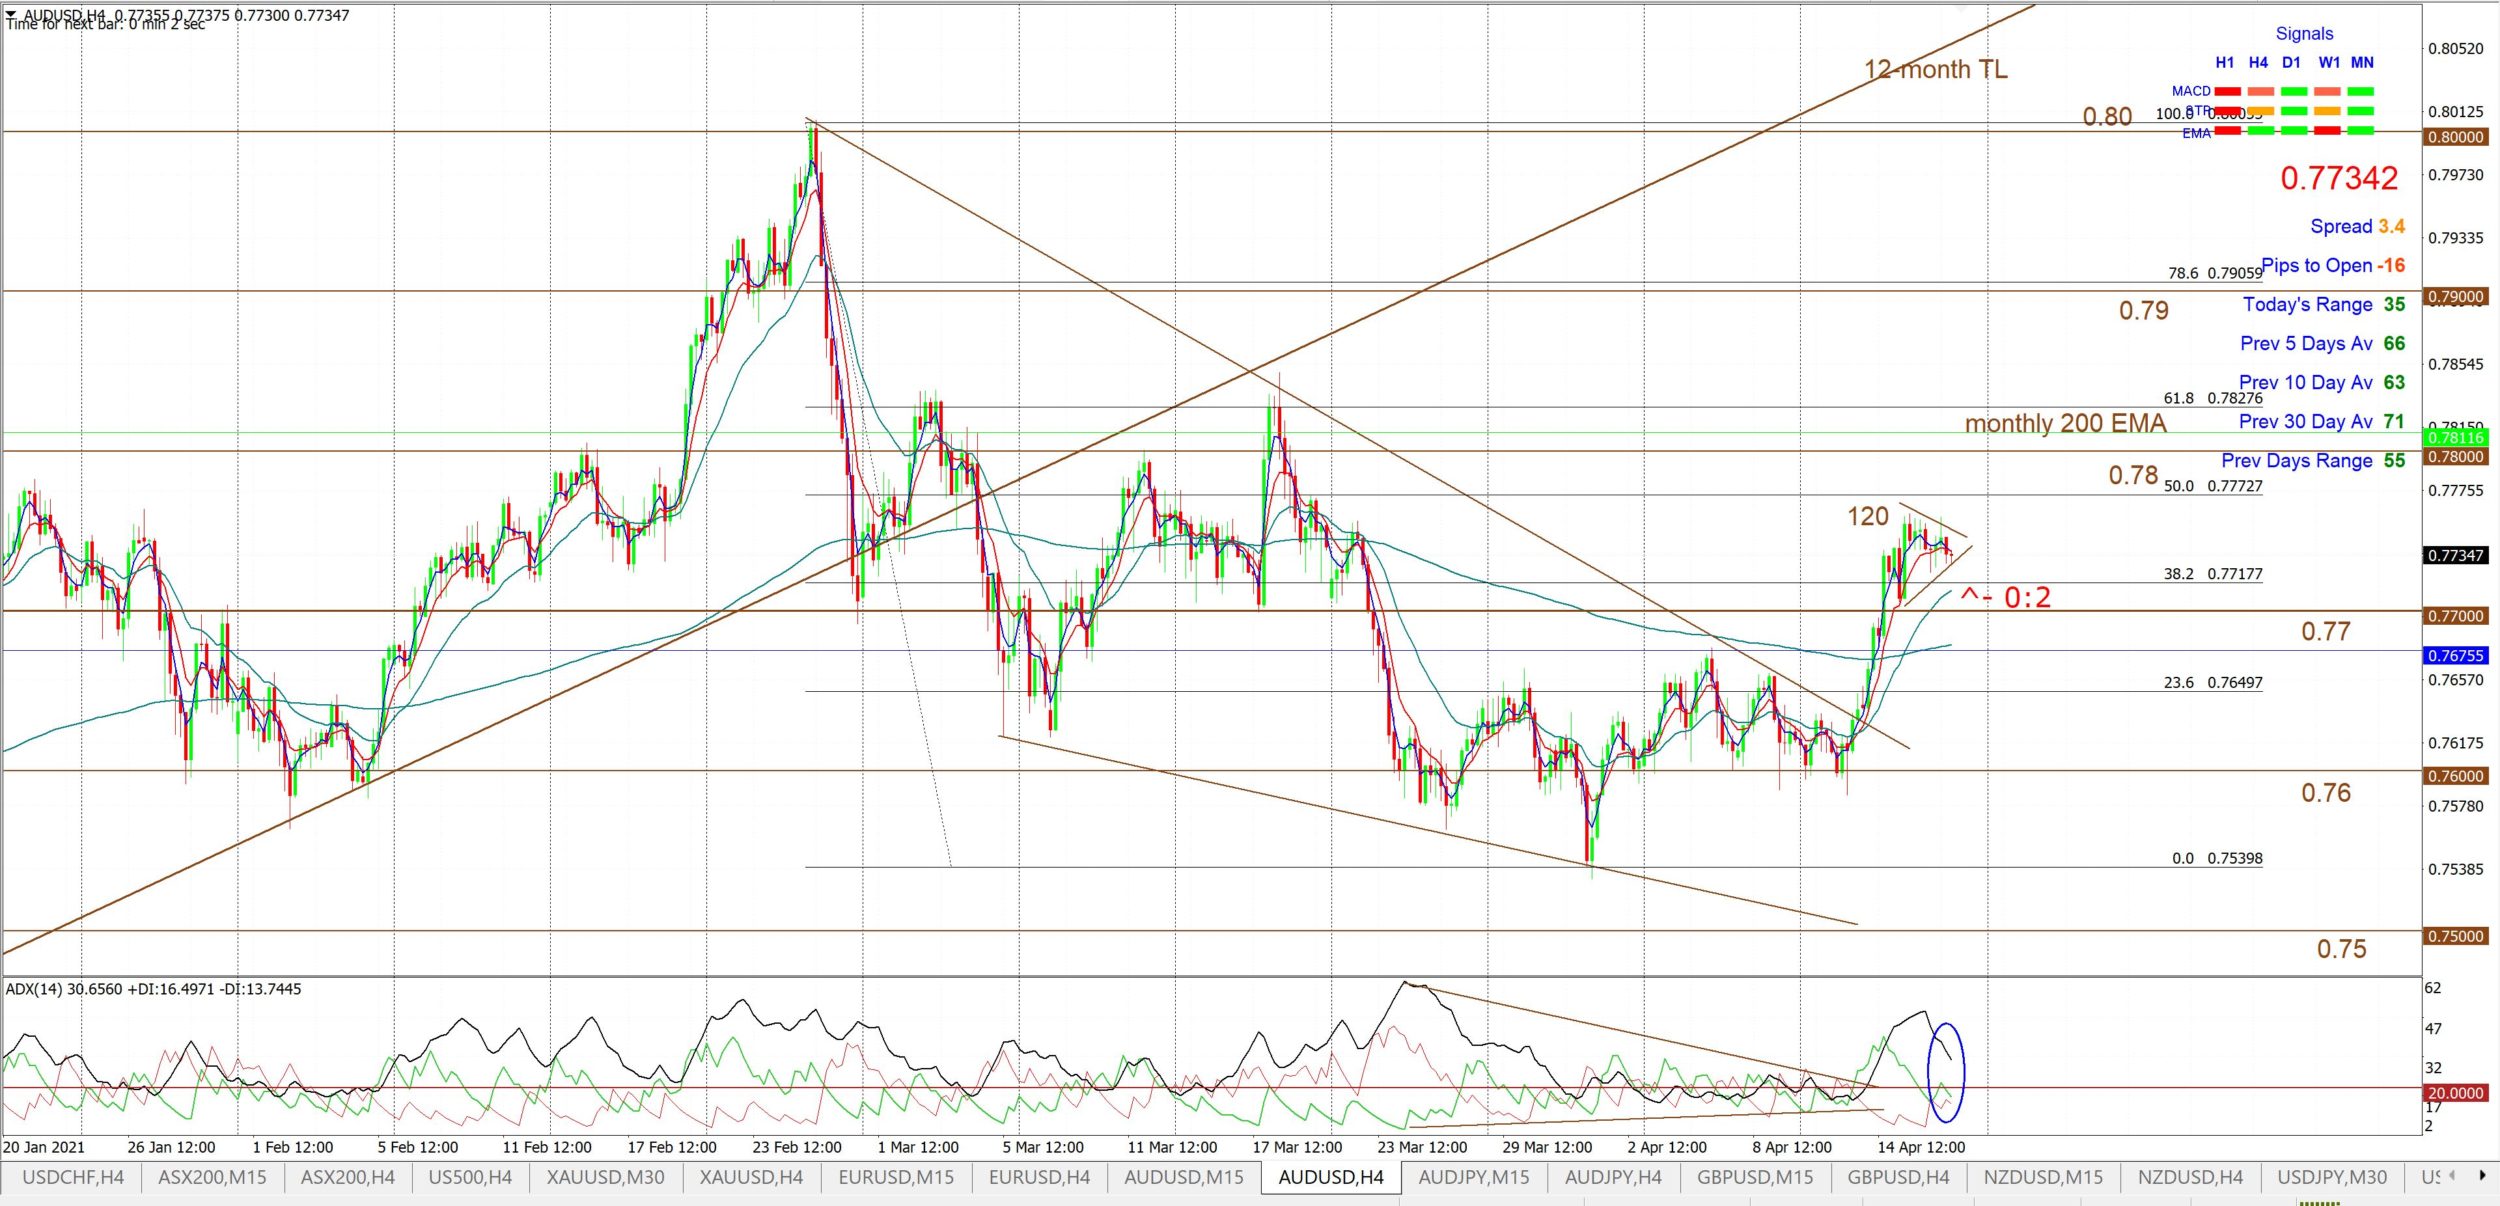
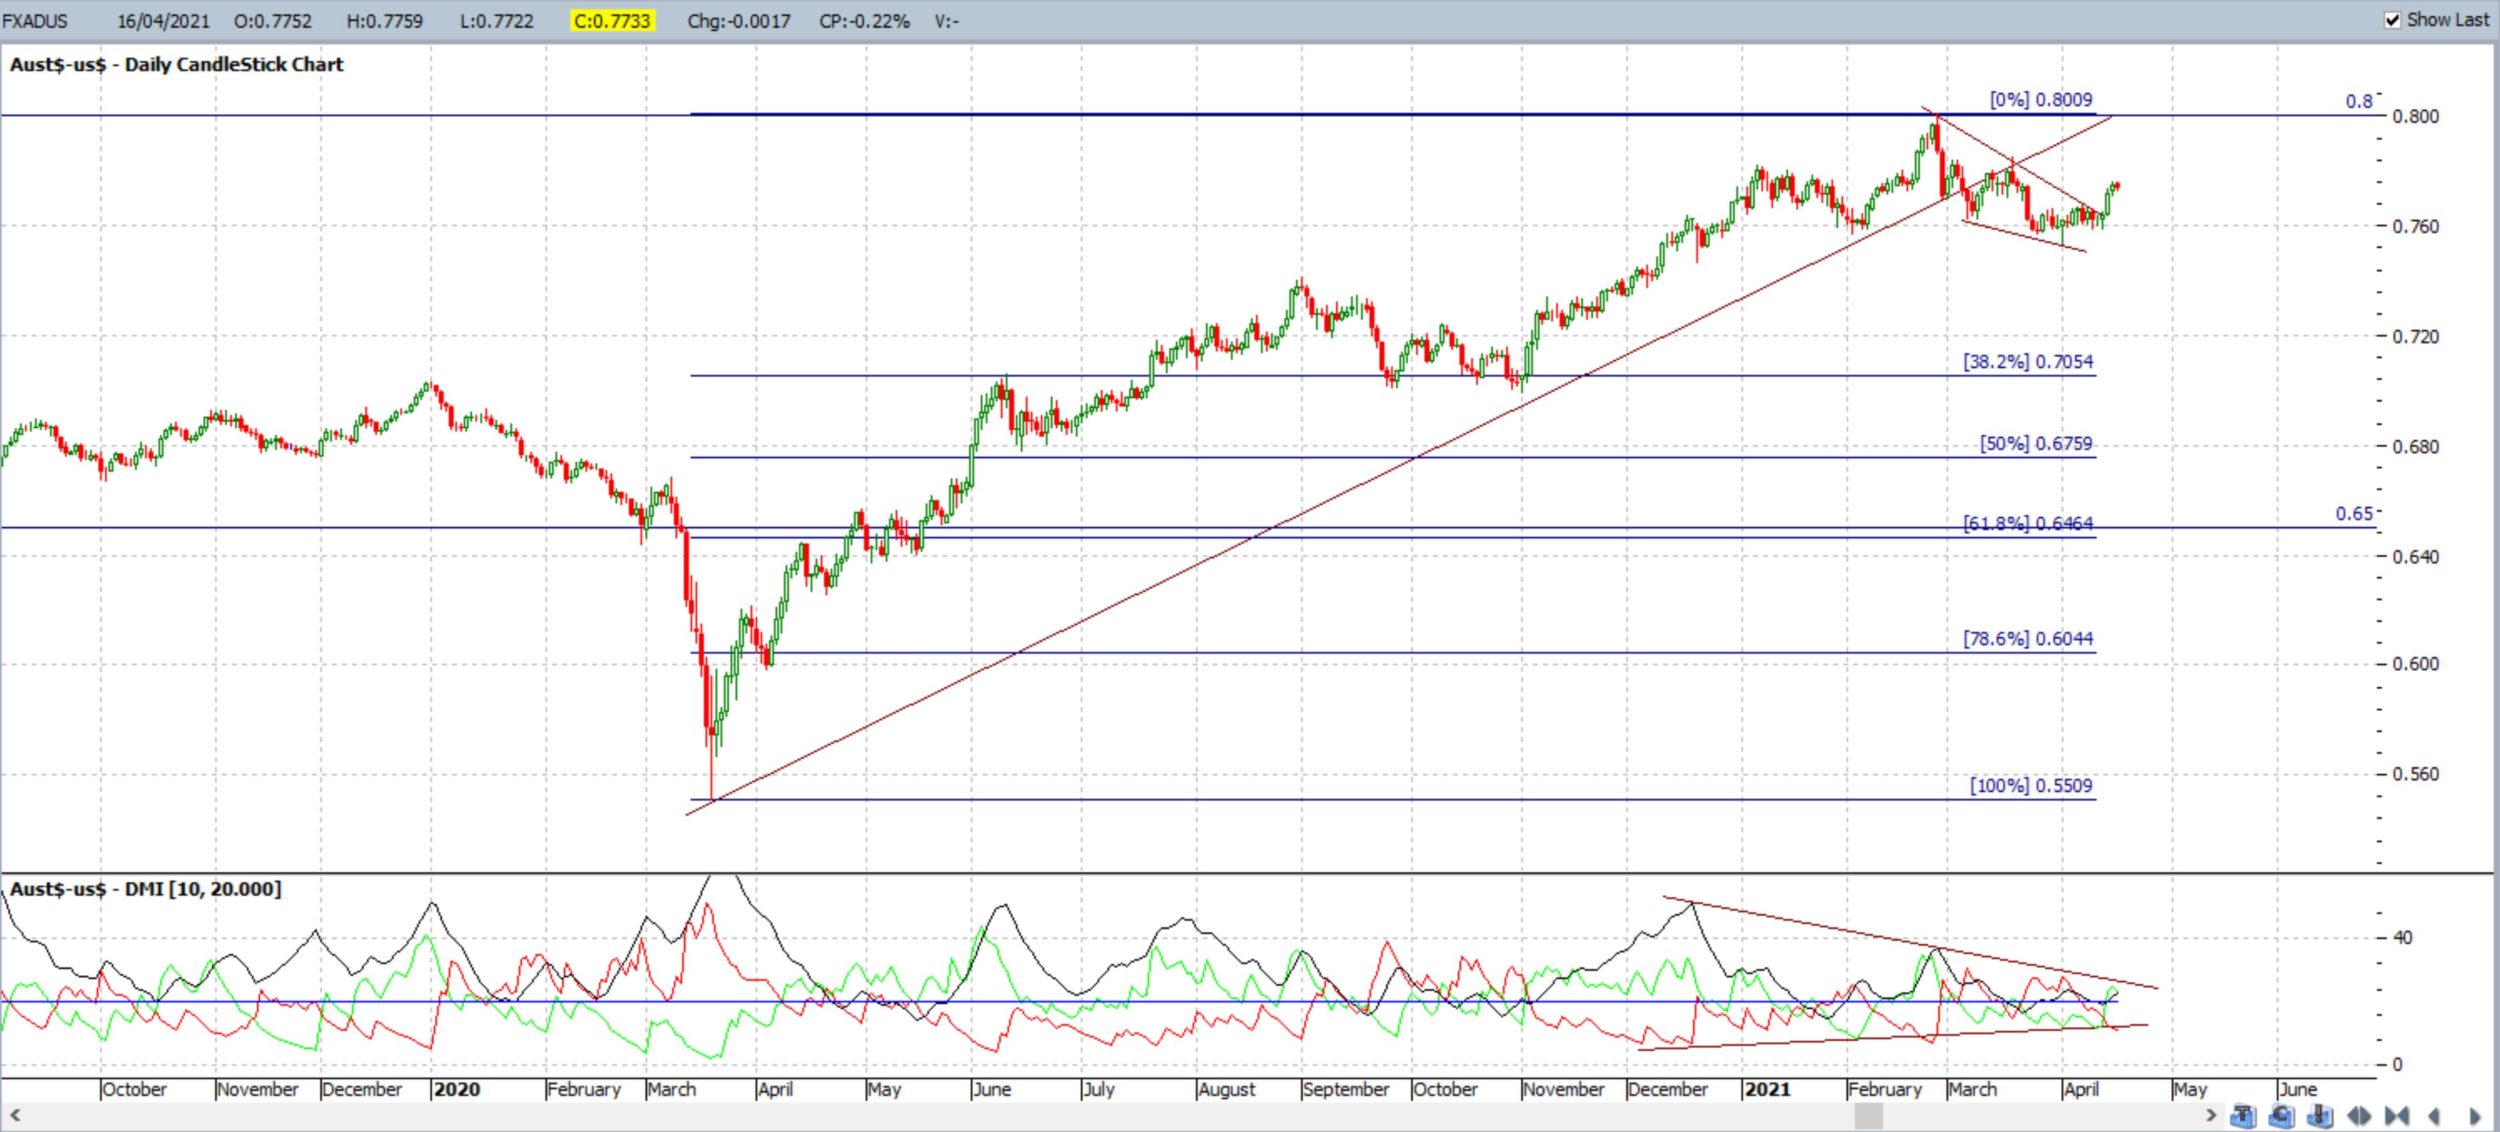
AUD/USD: The Aussie closed with a bullish weekly candle and finally made a bullish breakout from the 4hr chart’s bullish-reversal descending wedge that had been brewing for some weeks. This wedge breakout is still in progress but price action is currently consolidating in a triangle above the 0.77 level so watch these trend lines for any new breakout.
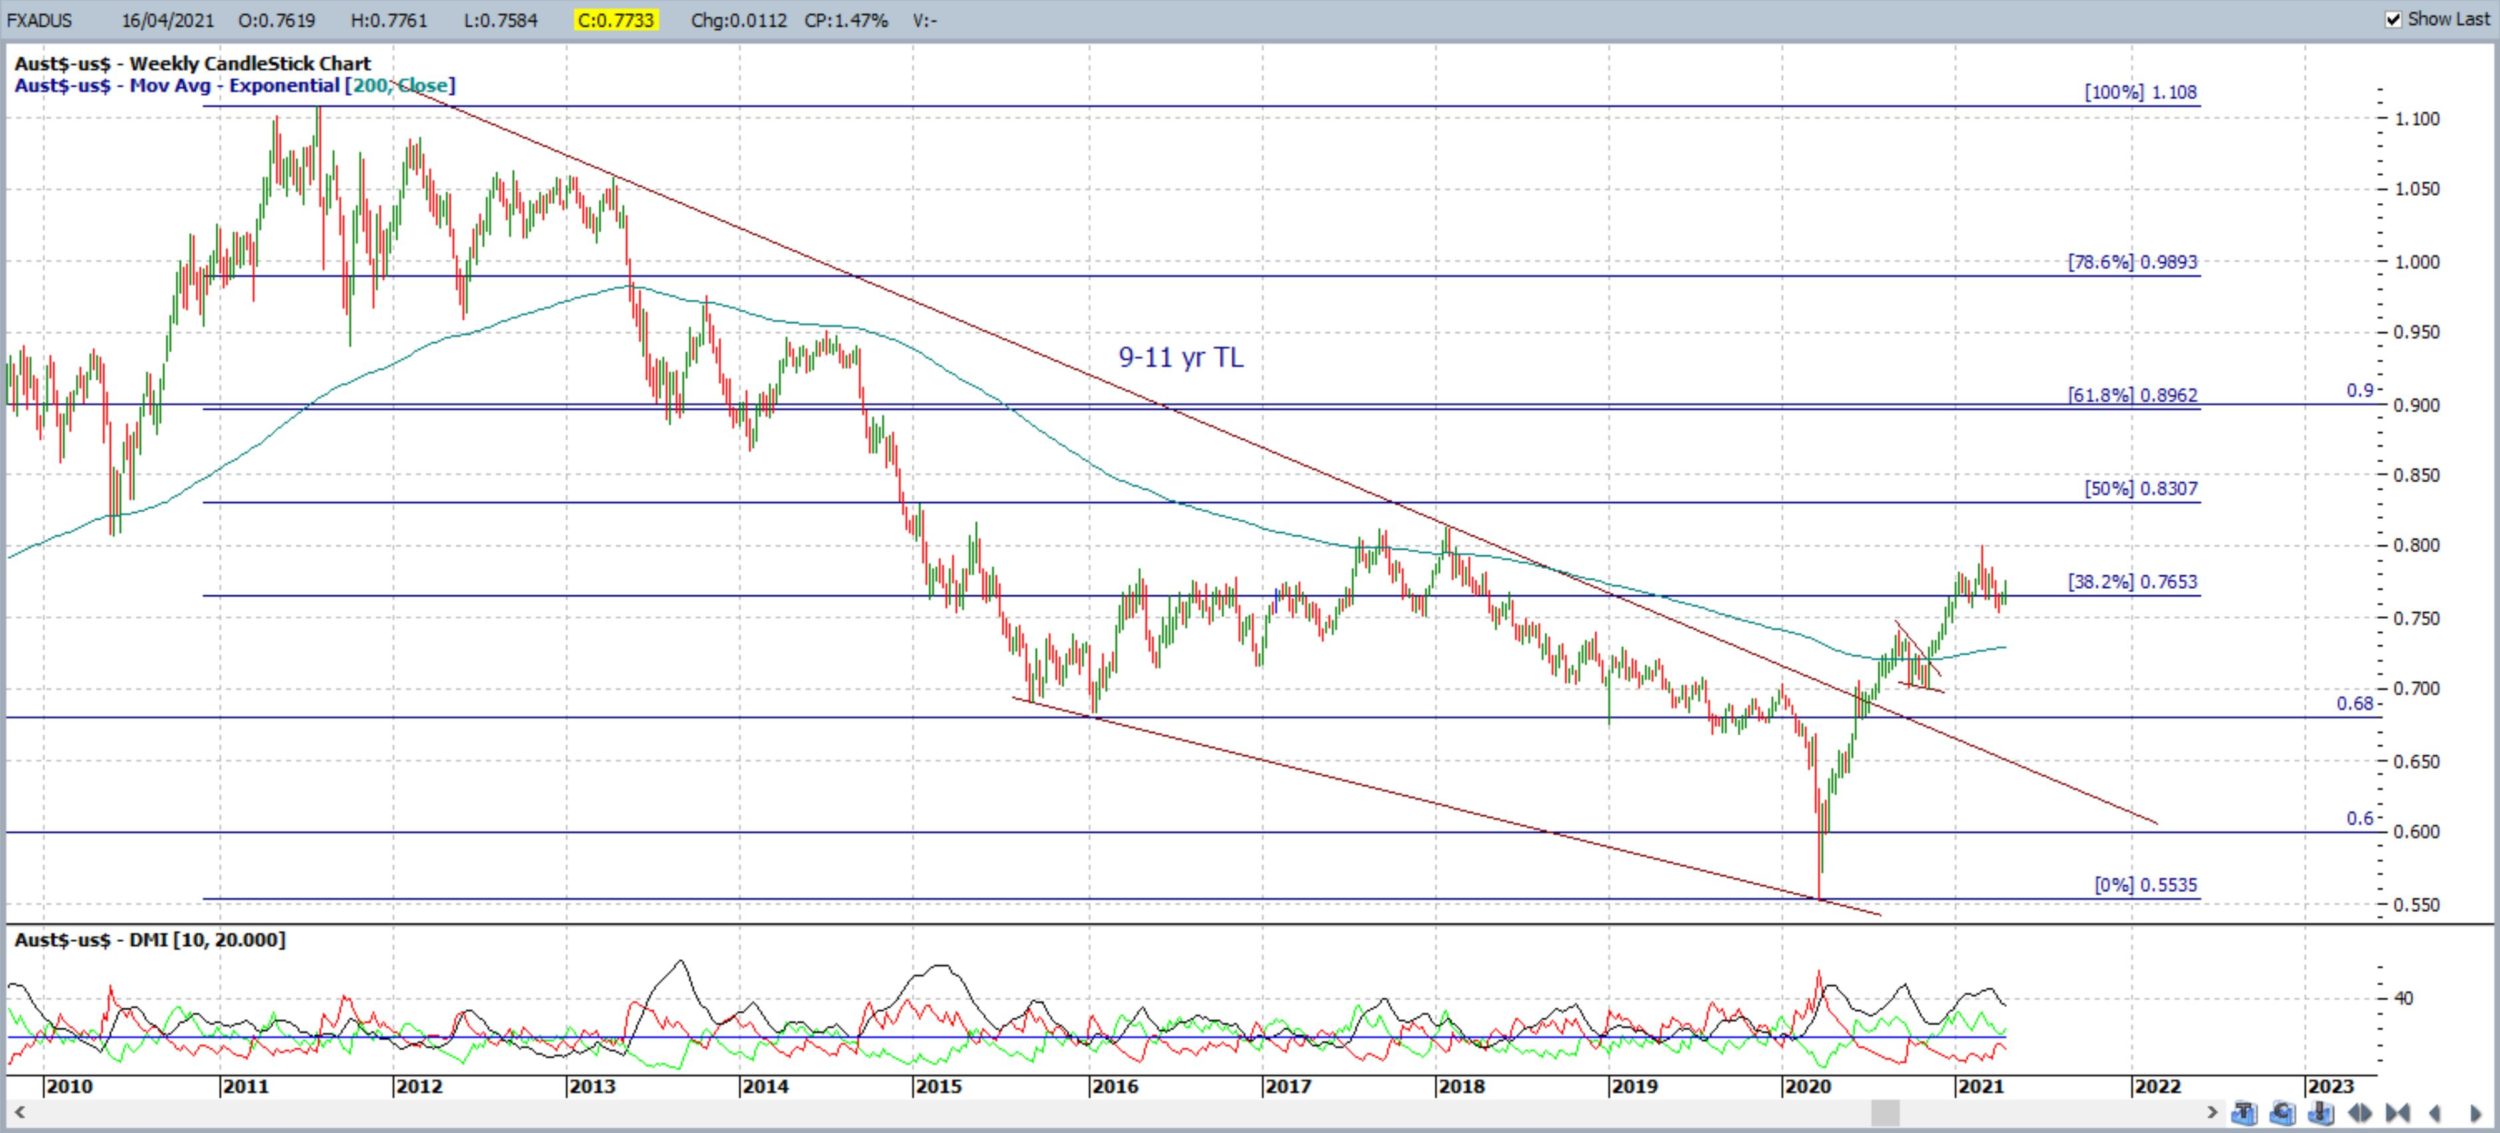
NB: The longer-term target for any bullish continuation from the weekly/monthly chart’s Descending Wedge breakout is the weekly 61.8% Fibonacci, near 0.90. This monthly wedge trend line breakout was also flagged back in the post on August 2nd 2020. Price at the breakout was around 0.71 and has reached up as far as 0.80, a move of around 900 pips, so has been another breakout worth monitoring.
Bullish targets: Any bullish 4hr chart triangle breakout would bring 0.78 into focus. After that, watch whole-numbers on the way back to the 12-month TL and, then, whole-number levels on the way up to the weekly chart’s Descending Wedge breakout target of 0.90.
Bearish targets: Any bearish 4hr chart triangle breakout would bring 0.77 into focus. After that, watch whole-number levels on the way down to 0.65 as this is near the 61.8% Fibonacci of the March 2020 – Feb 2021 swing High move.
- Watch for any new 4hr chart triangle breakout:
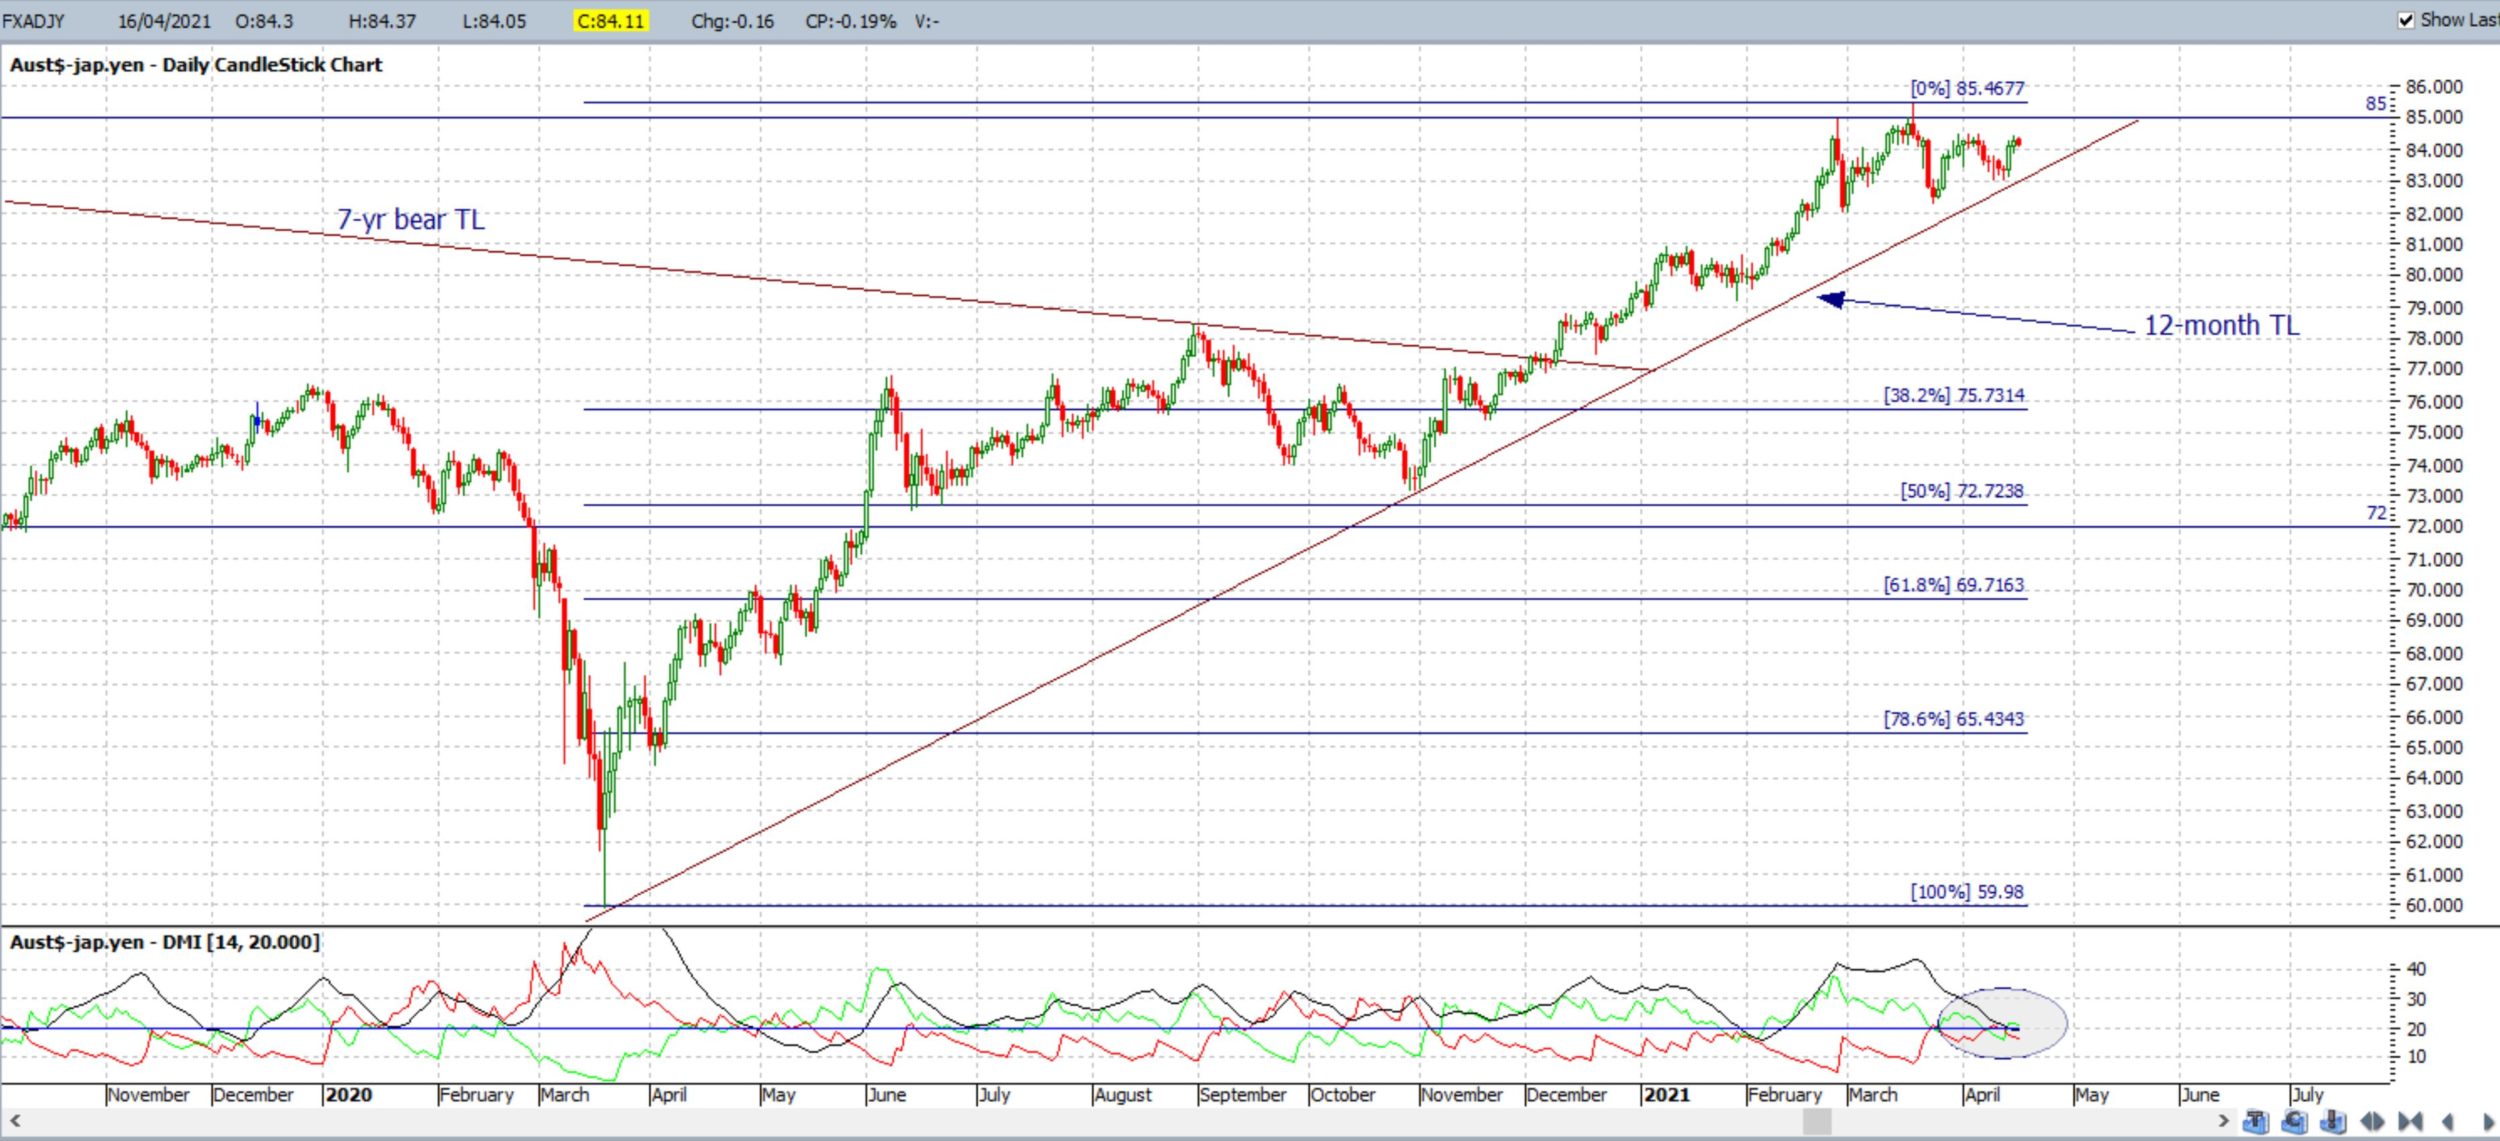
AUD/JPY: The AUD/JPY closed with a bullish-coloured Spinning Top, and almost Inside, weekly candle with both reflecting indecision as price keeps hovering near 84, and under the key 85 level, keeping these as the two regions to watch for any new make or break.
As noted over recent weeks:
- The weekly chart reveals that the 85 level has been a significant reaction zone for the AUD/JPY and has been resistance for the last three years; this level was peppered many times throughout 2018 but could not be broken. The next major level above 85 is 90 so watch this target level if 85 is broken.
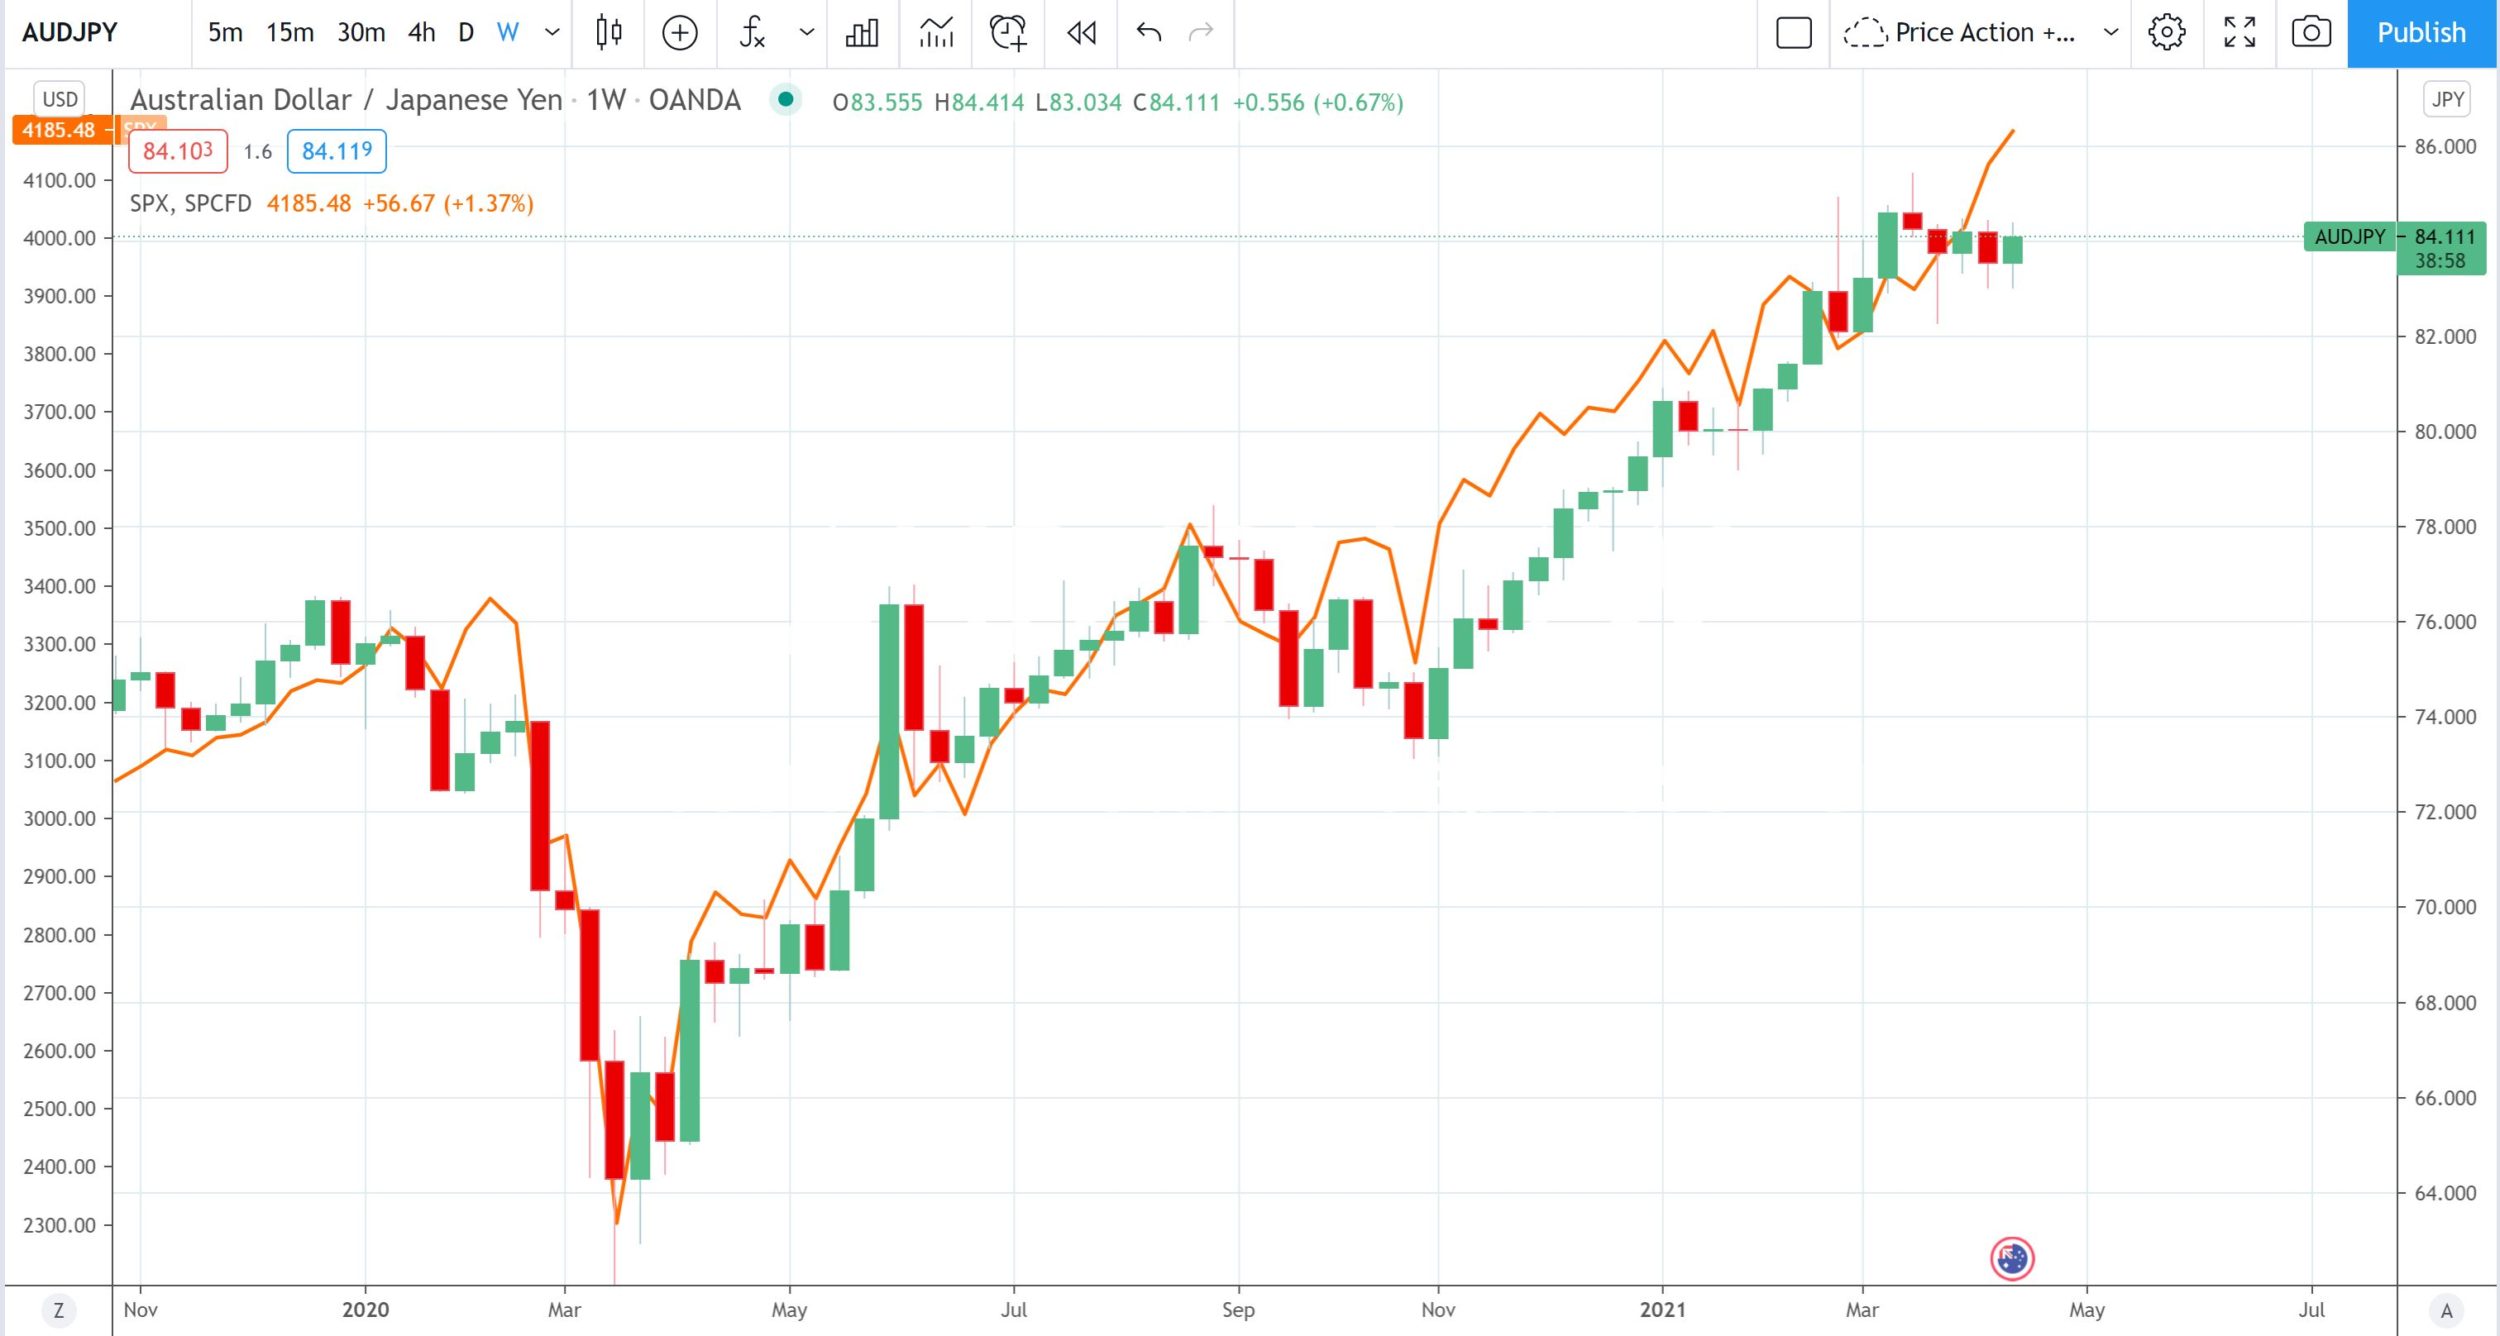
- AUD/JPY traders also need to keep an eye on the sentiment with stocks though, especially the S&P500 index, as the two are generally highly aligned; as the chart below reveals. Any pause or serious pullback with stocks might render similar for the AUD/JPY:
AUD/JPY versus S&P500 (gold line): a high degree of positive correlation:
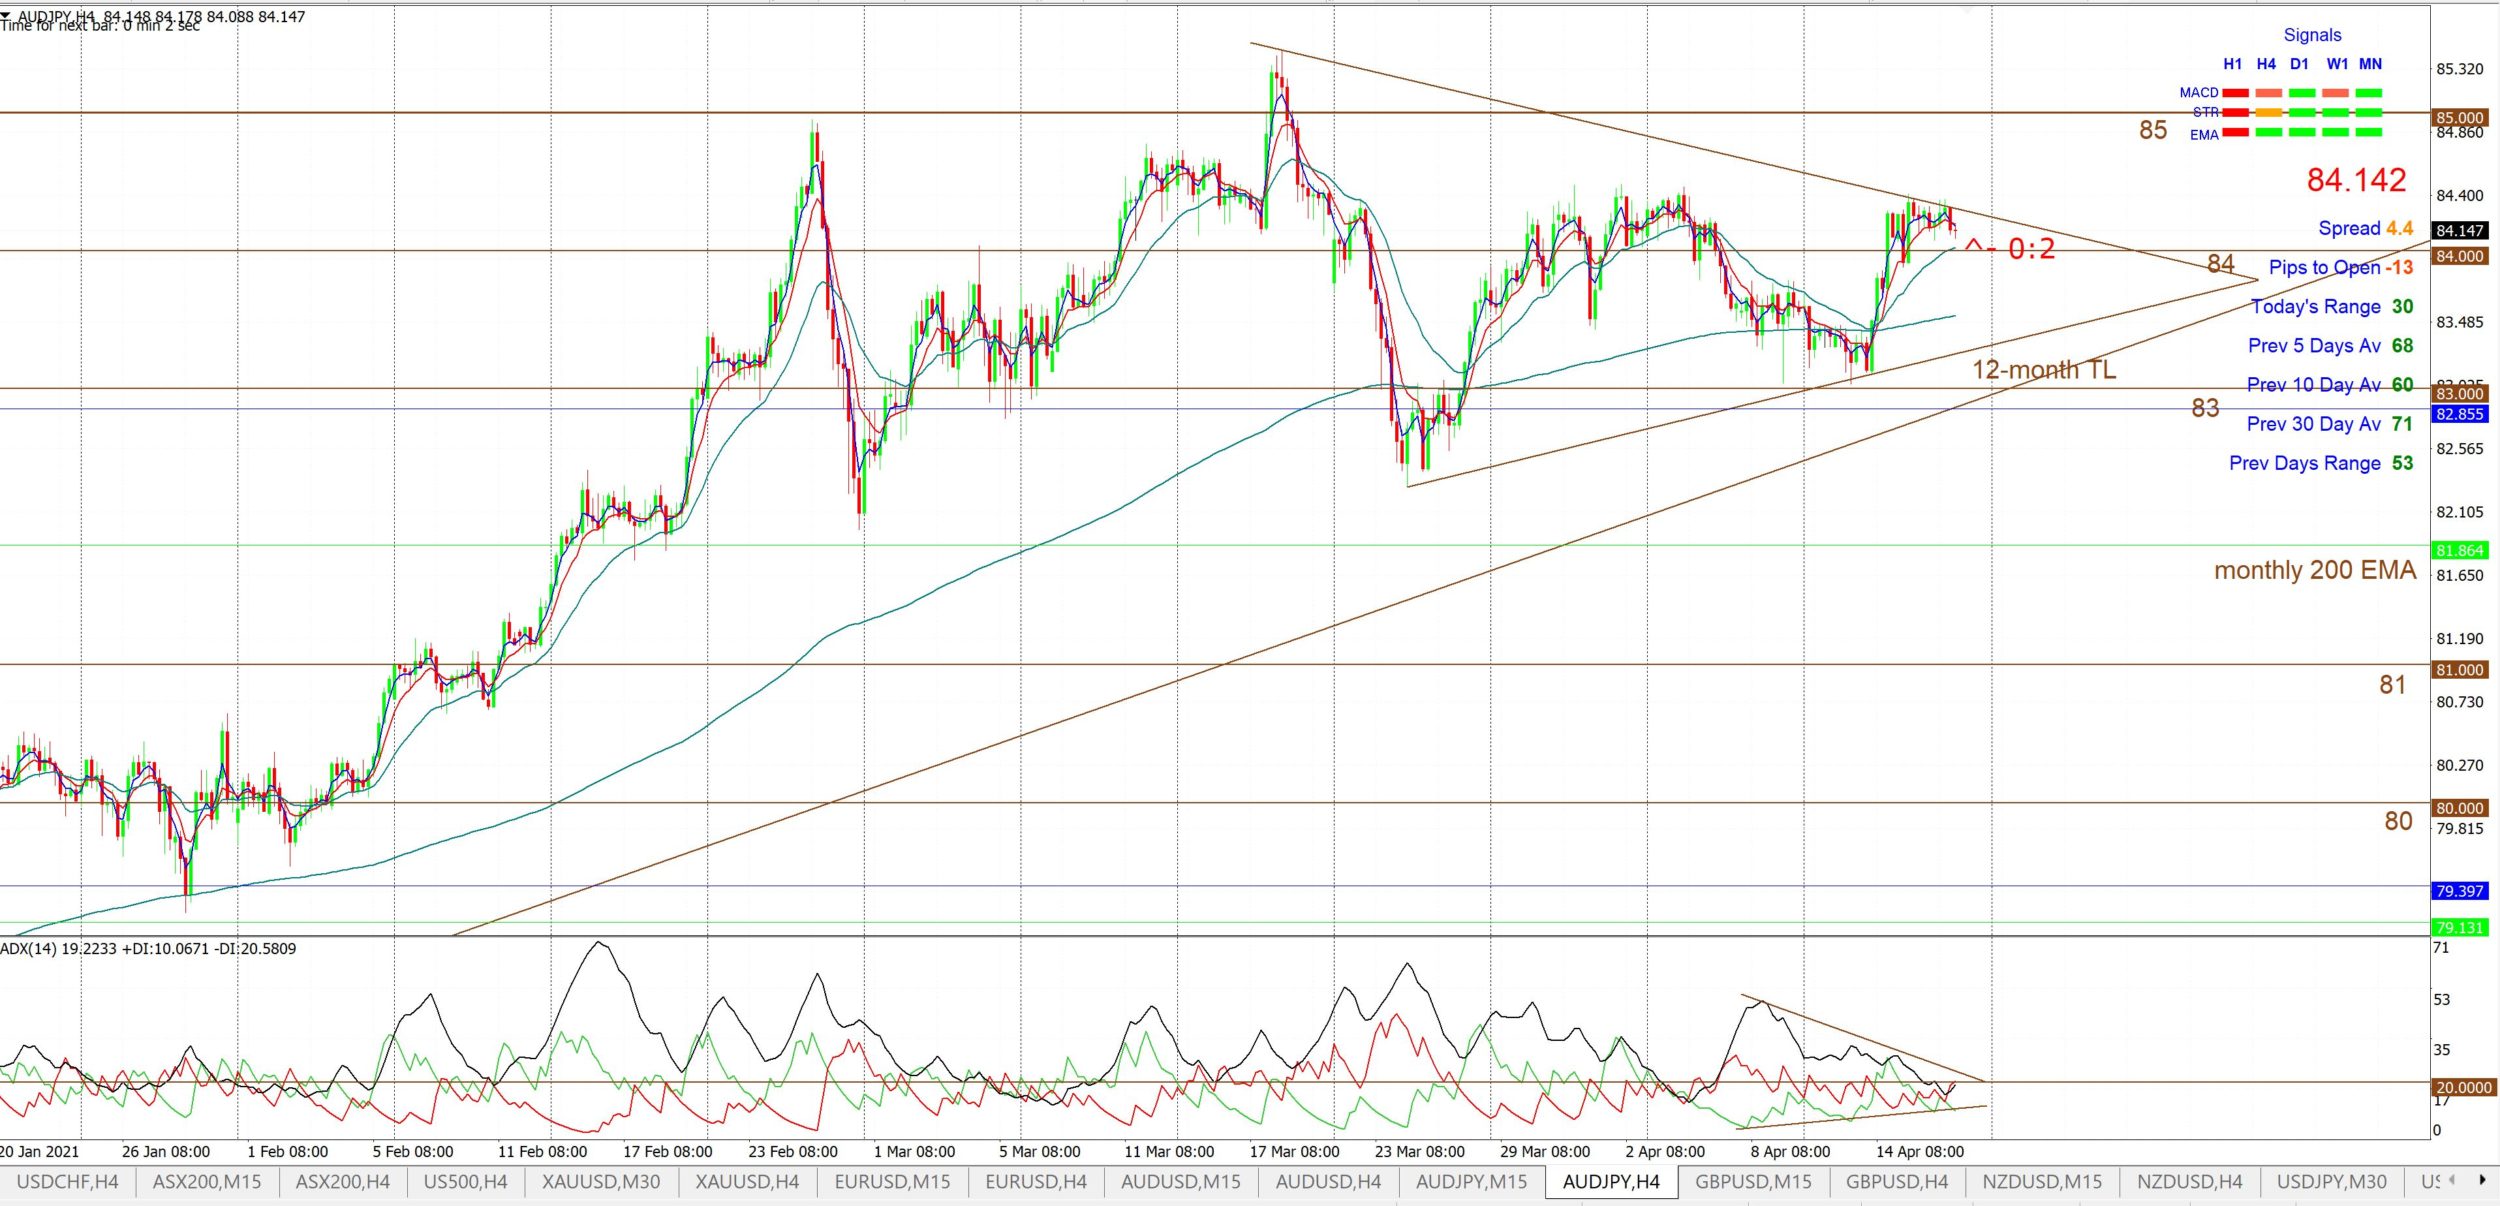
There are revised 4hr chart trend lines to monitor for any new breakout.
Bullish targets: Any bullish 4hr chart triangle breakout would bring 85 S/R back into focus followed by whole numbers on the way to 90 S/R.
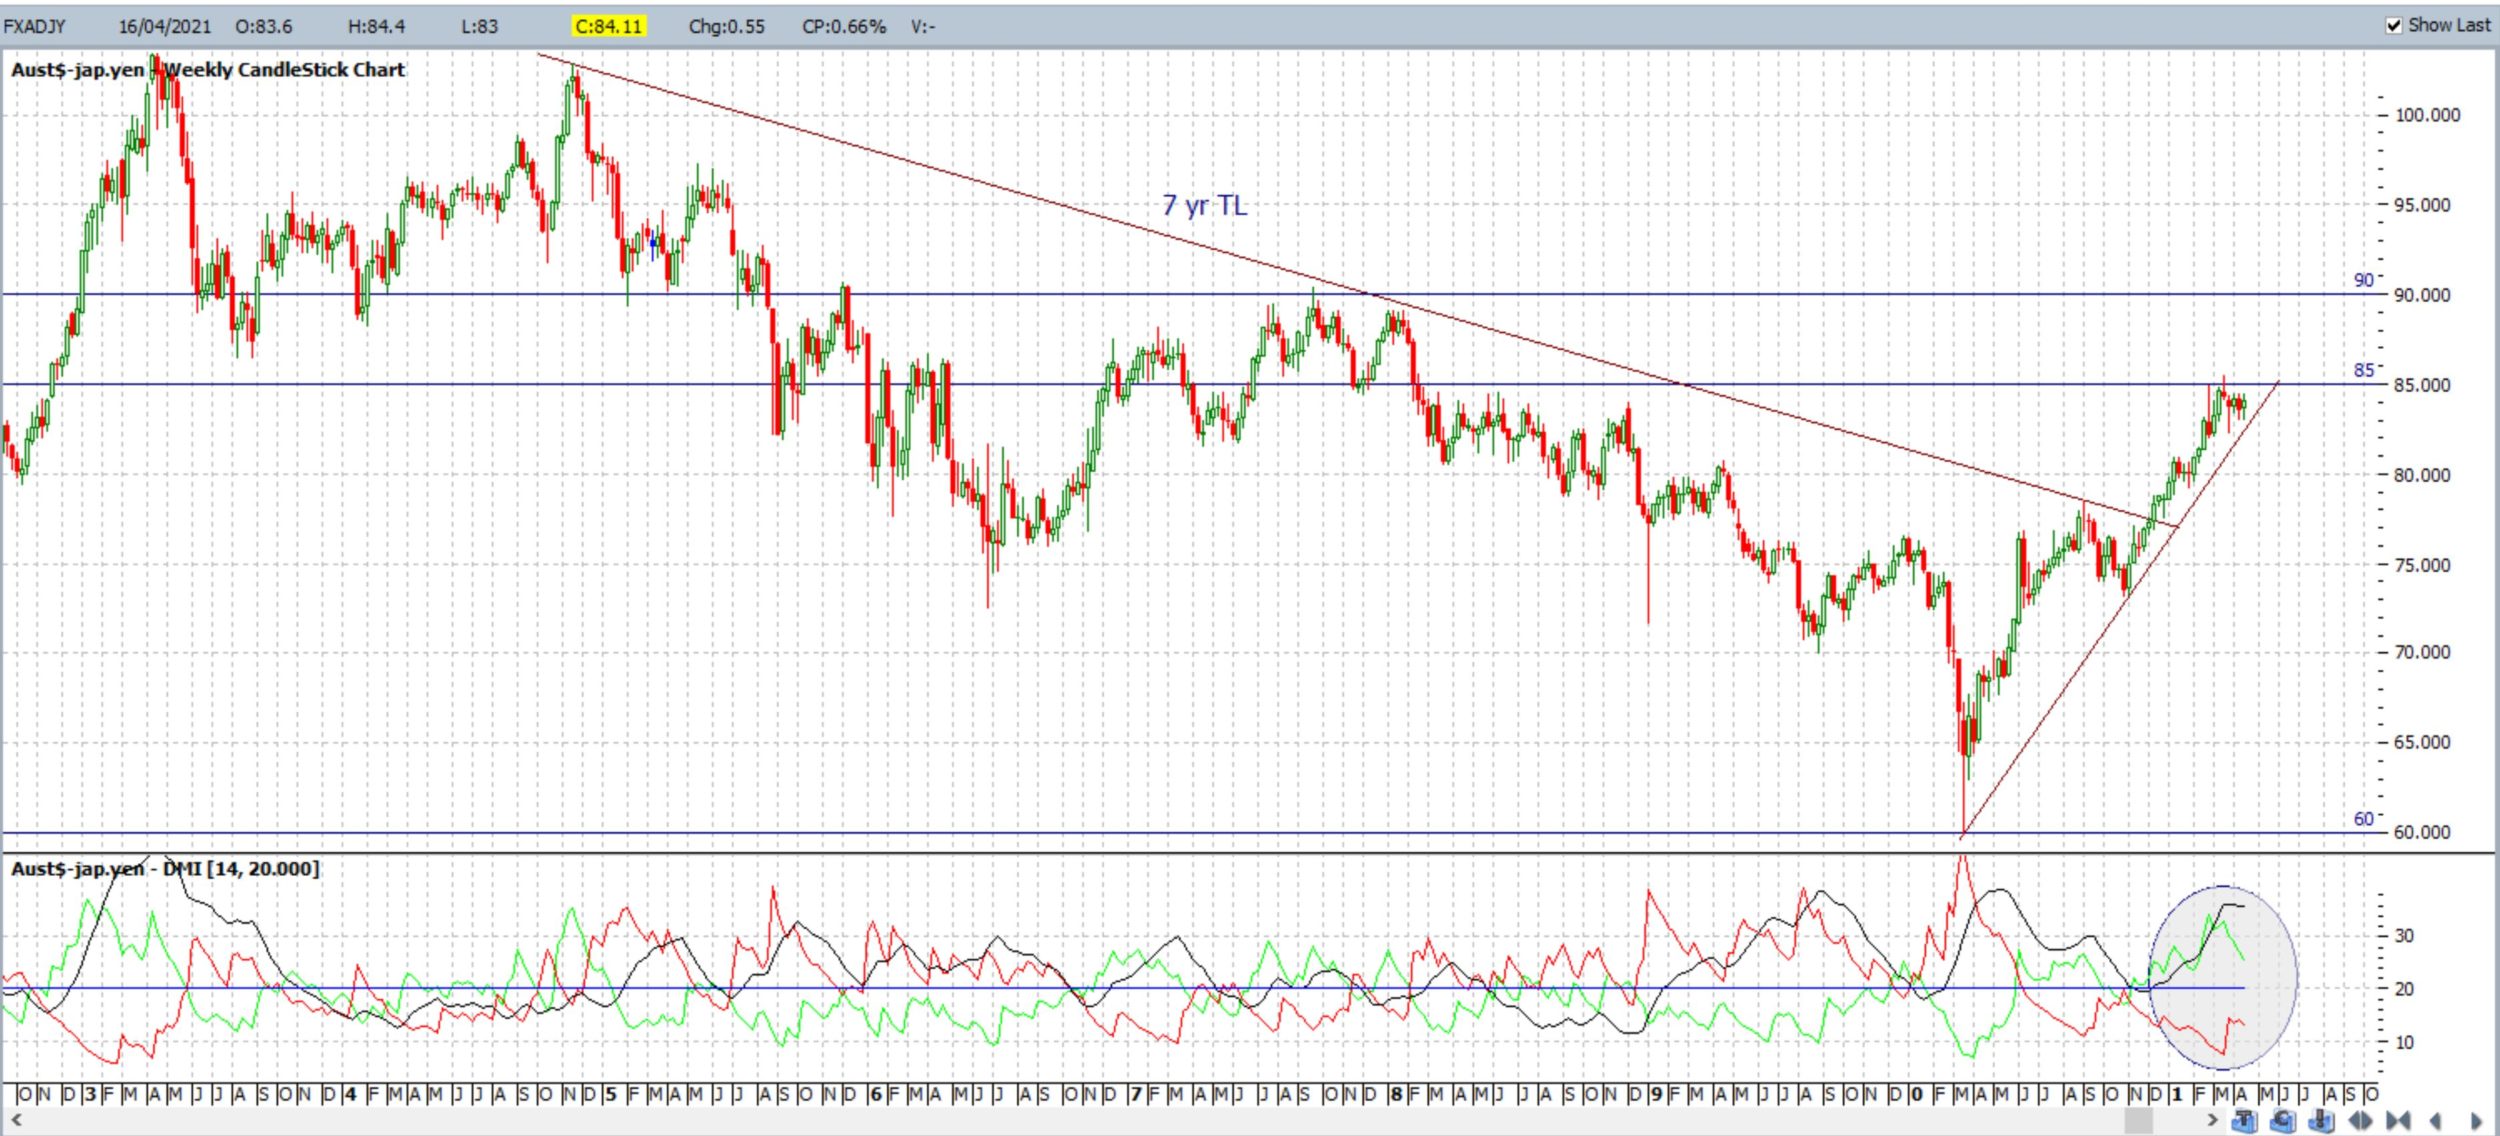
Bearish targets: Any bearish 4hr chart triangle breakout would bring the 12-month support trend line and 83 S/R into focus. After that, watch whole-numbers on the way down to 76 as this is still near the recently broken 7-yr bear trend line, and then 72 as this is near the 61.8% Fibonacci of the March 2020 – March 2021 swing High move.
- Watch for any new 4hr chart triangle breakout:
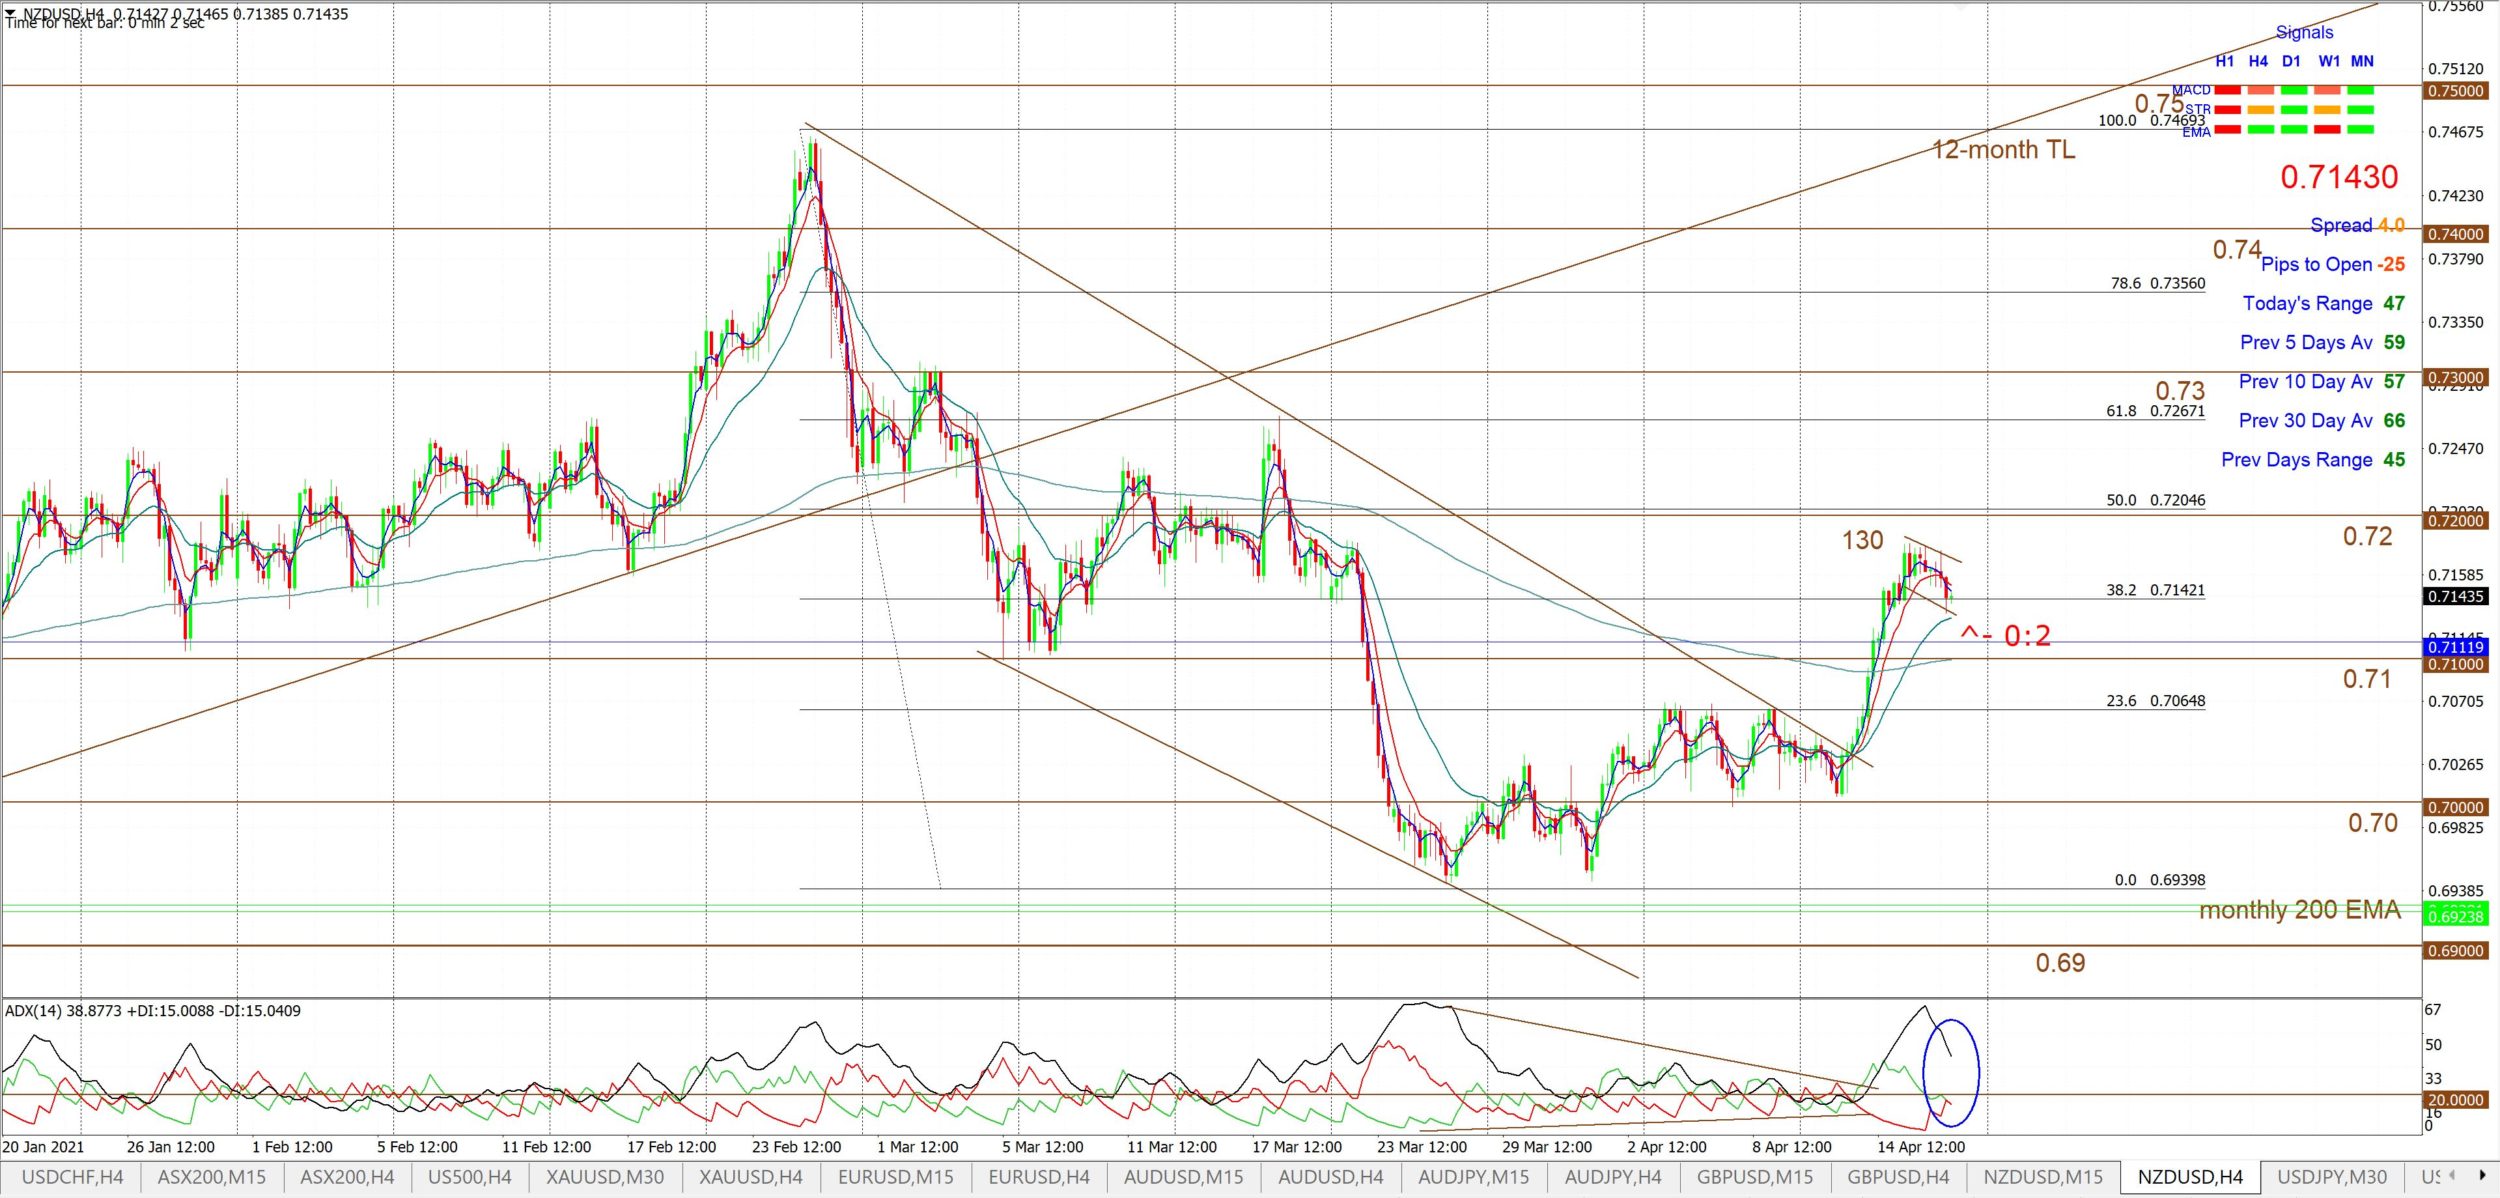
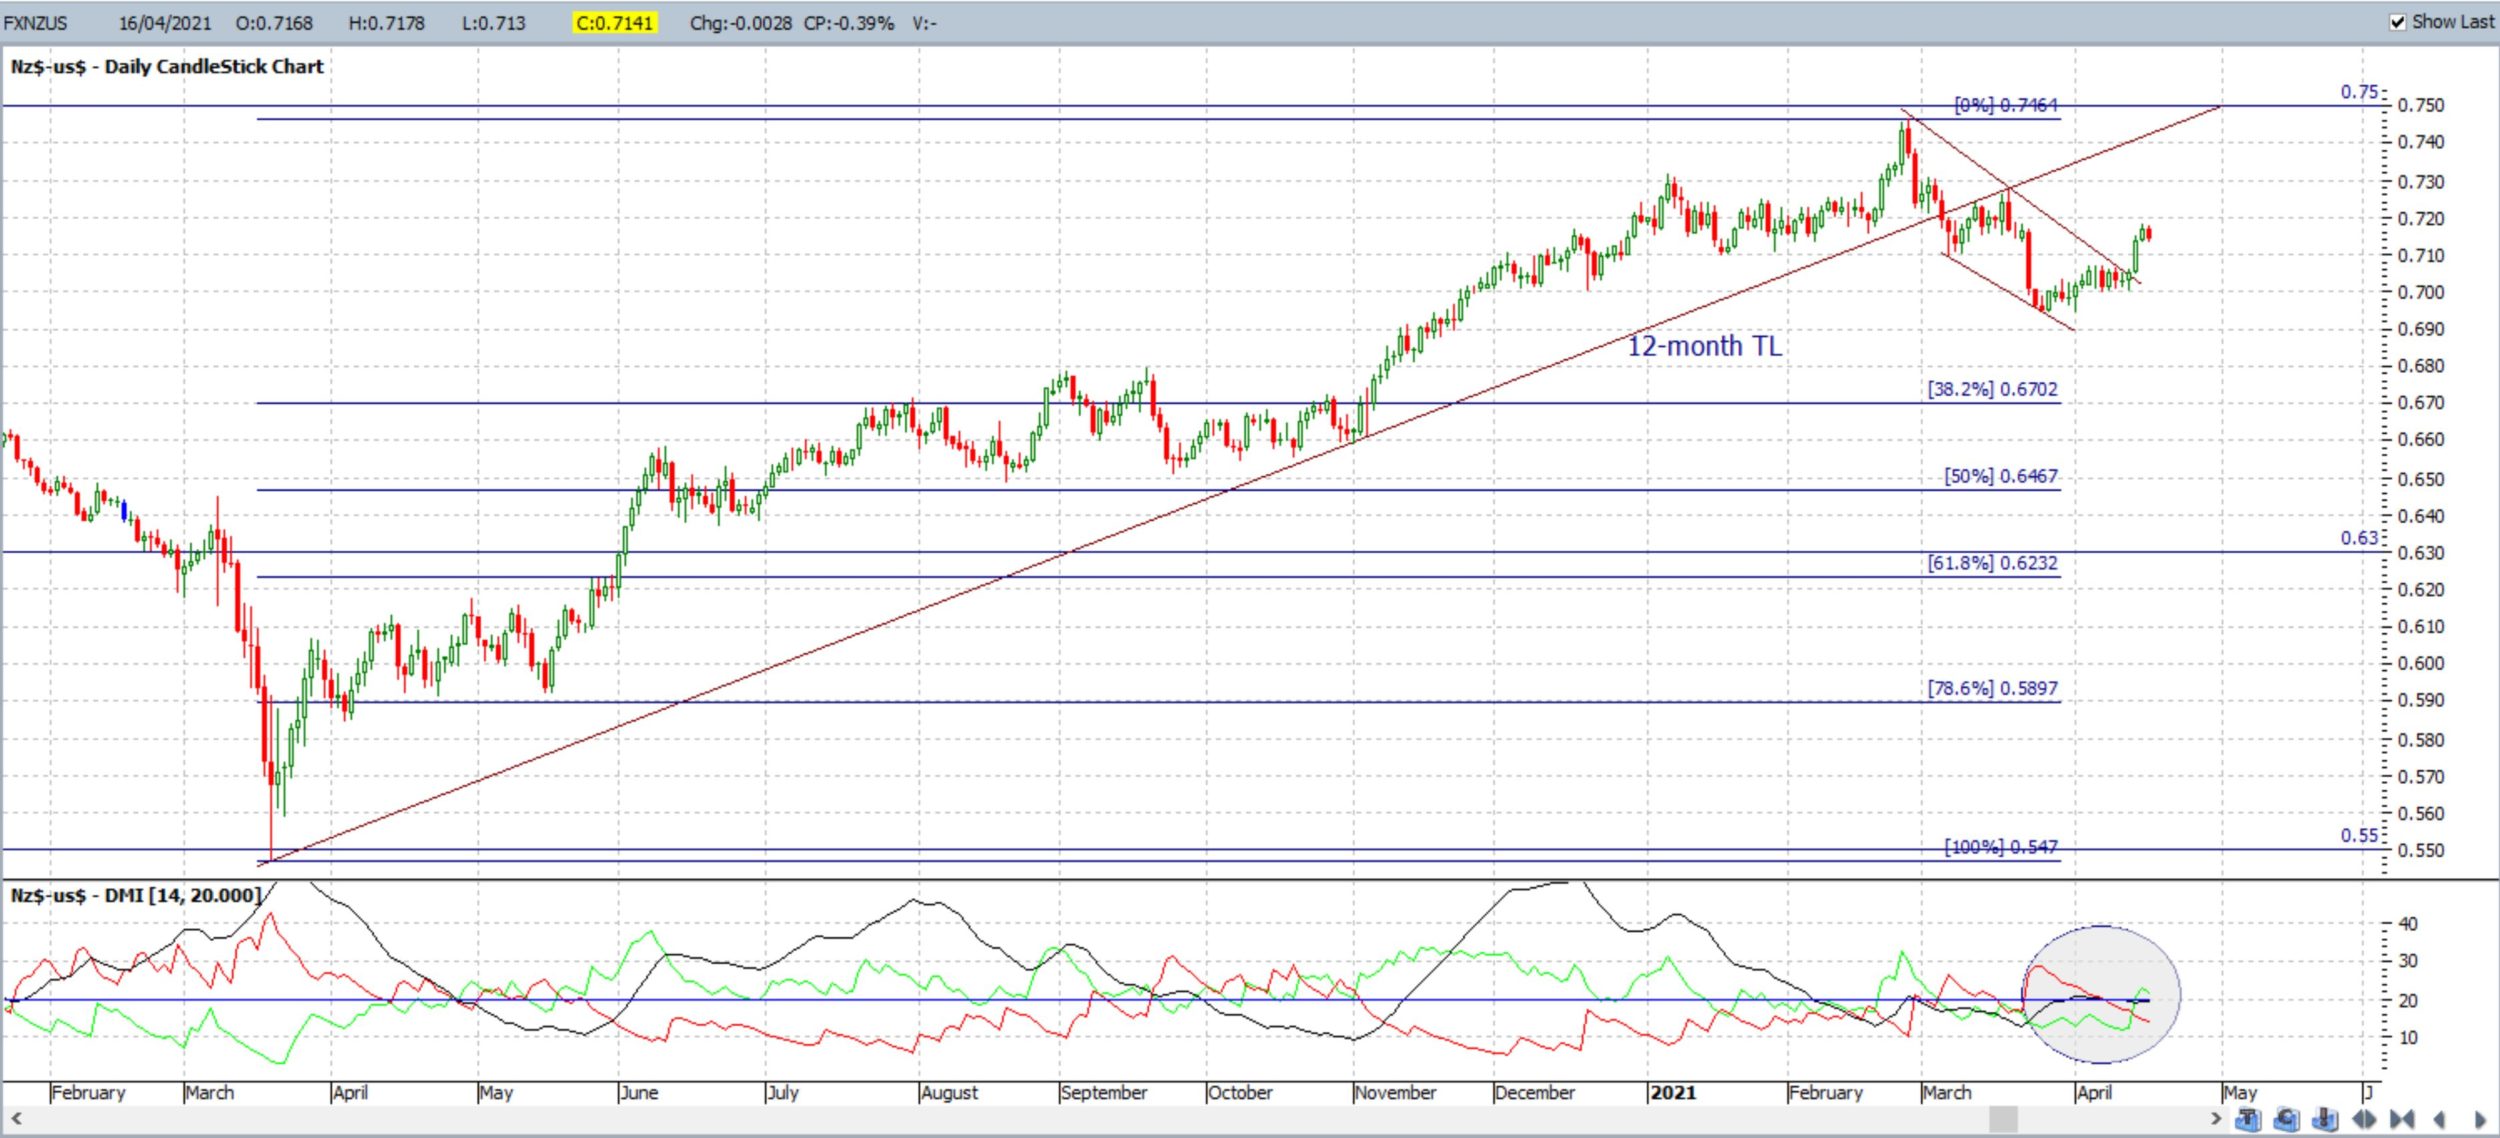
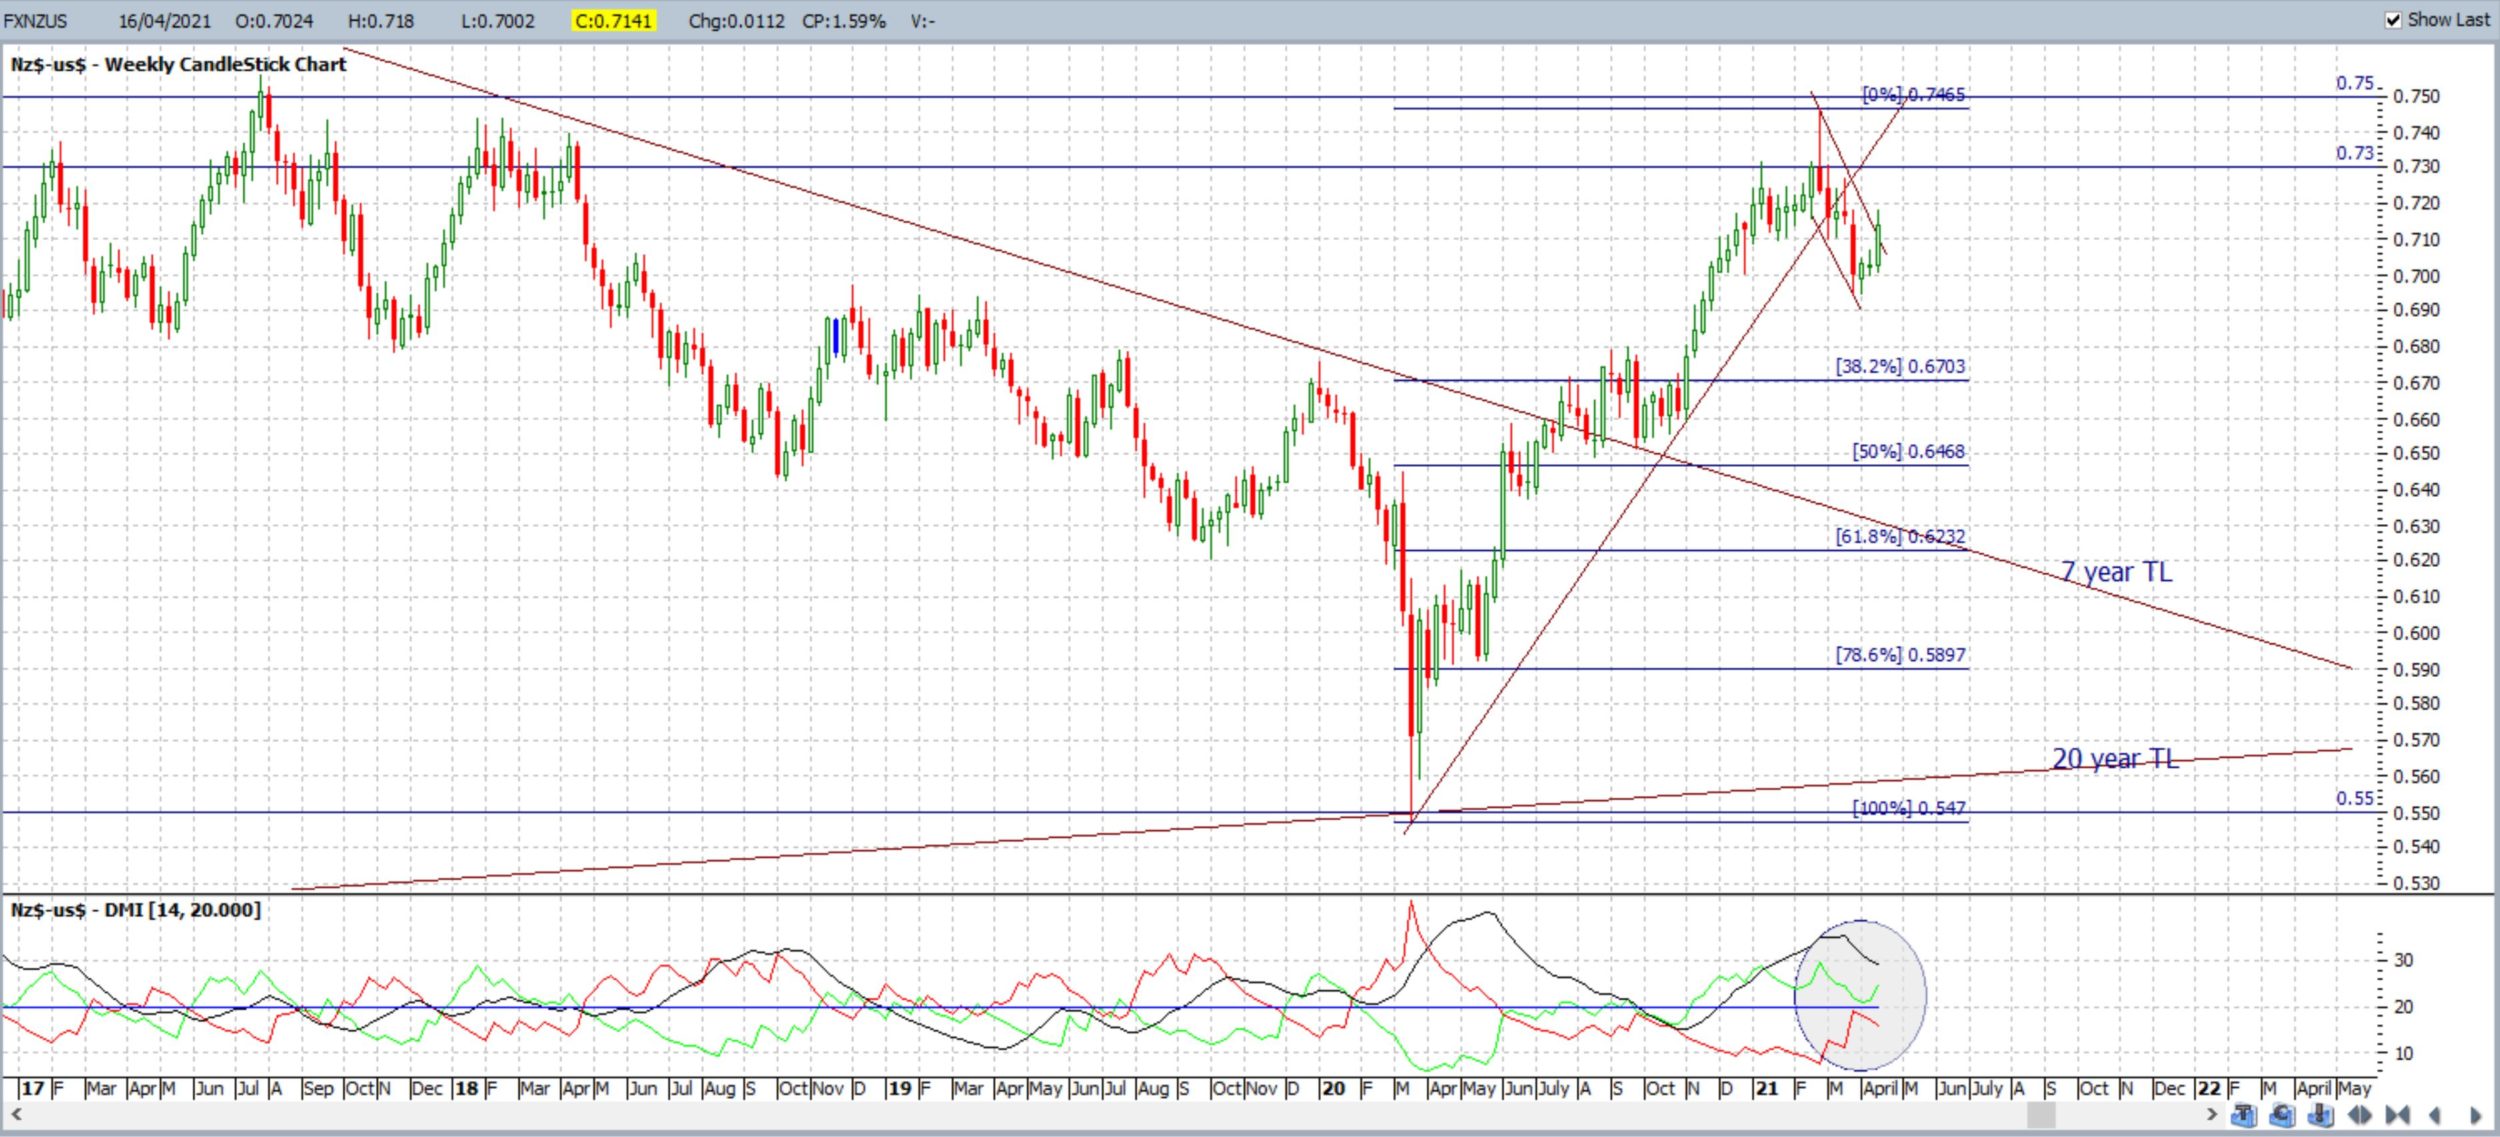
NZD/USD: The Kiwi closed with a large, bullish weekly candle and finally made a bullish breakout from the 4hr chart’s bullish-reversal descending wedge that had been brewing for some weeks. This wedge breakout is still in progress but price action is currently consolidating in a wedge below the 0.72 level so watch these trend lines for any new breakout.
Bullish targets: Any bullish 4hr chart wedge breakout would bring 0.72 into focus. After that, watch whole-numbers on the way up to the recently broken 12-month support trend line.
Bearish targets: Any bearish 4hr chart hold below 0.72 would bring 0.71 and 0.70 into focus followed by the monthly 200 EMA, 0.69 and bottom wedge / channel trend line. After that, watch whole-number levels on the way down to 0.63 as this is near the 61.8% Fibonacci of the March 2020 – Feb 2021 swing High move.
- Watch 0.72 and for any 4hr chart wedge breakout:
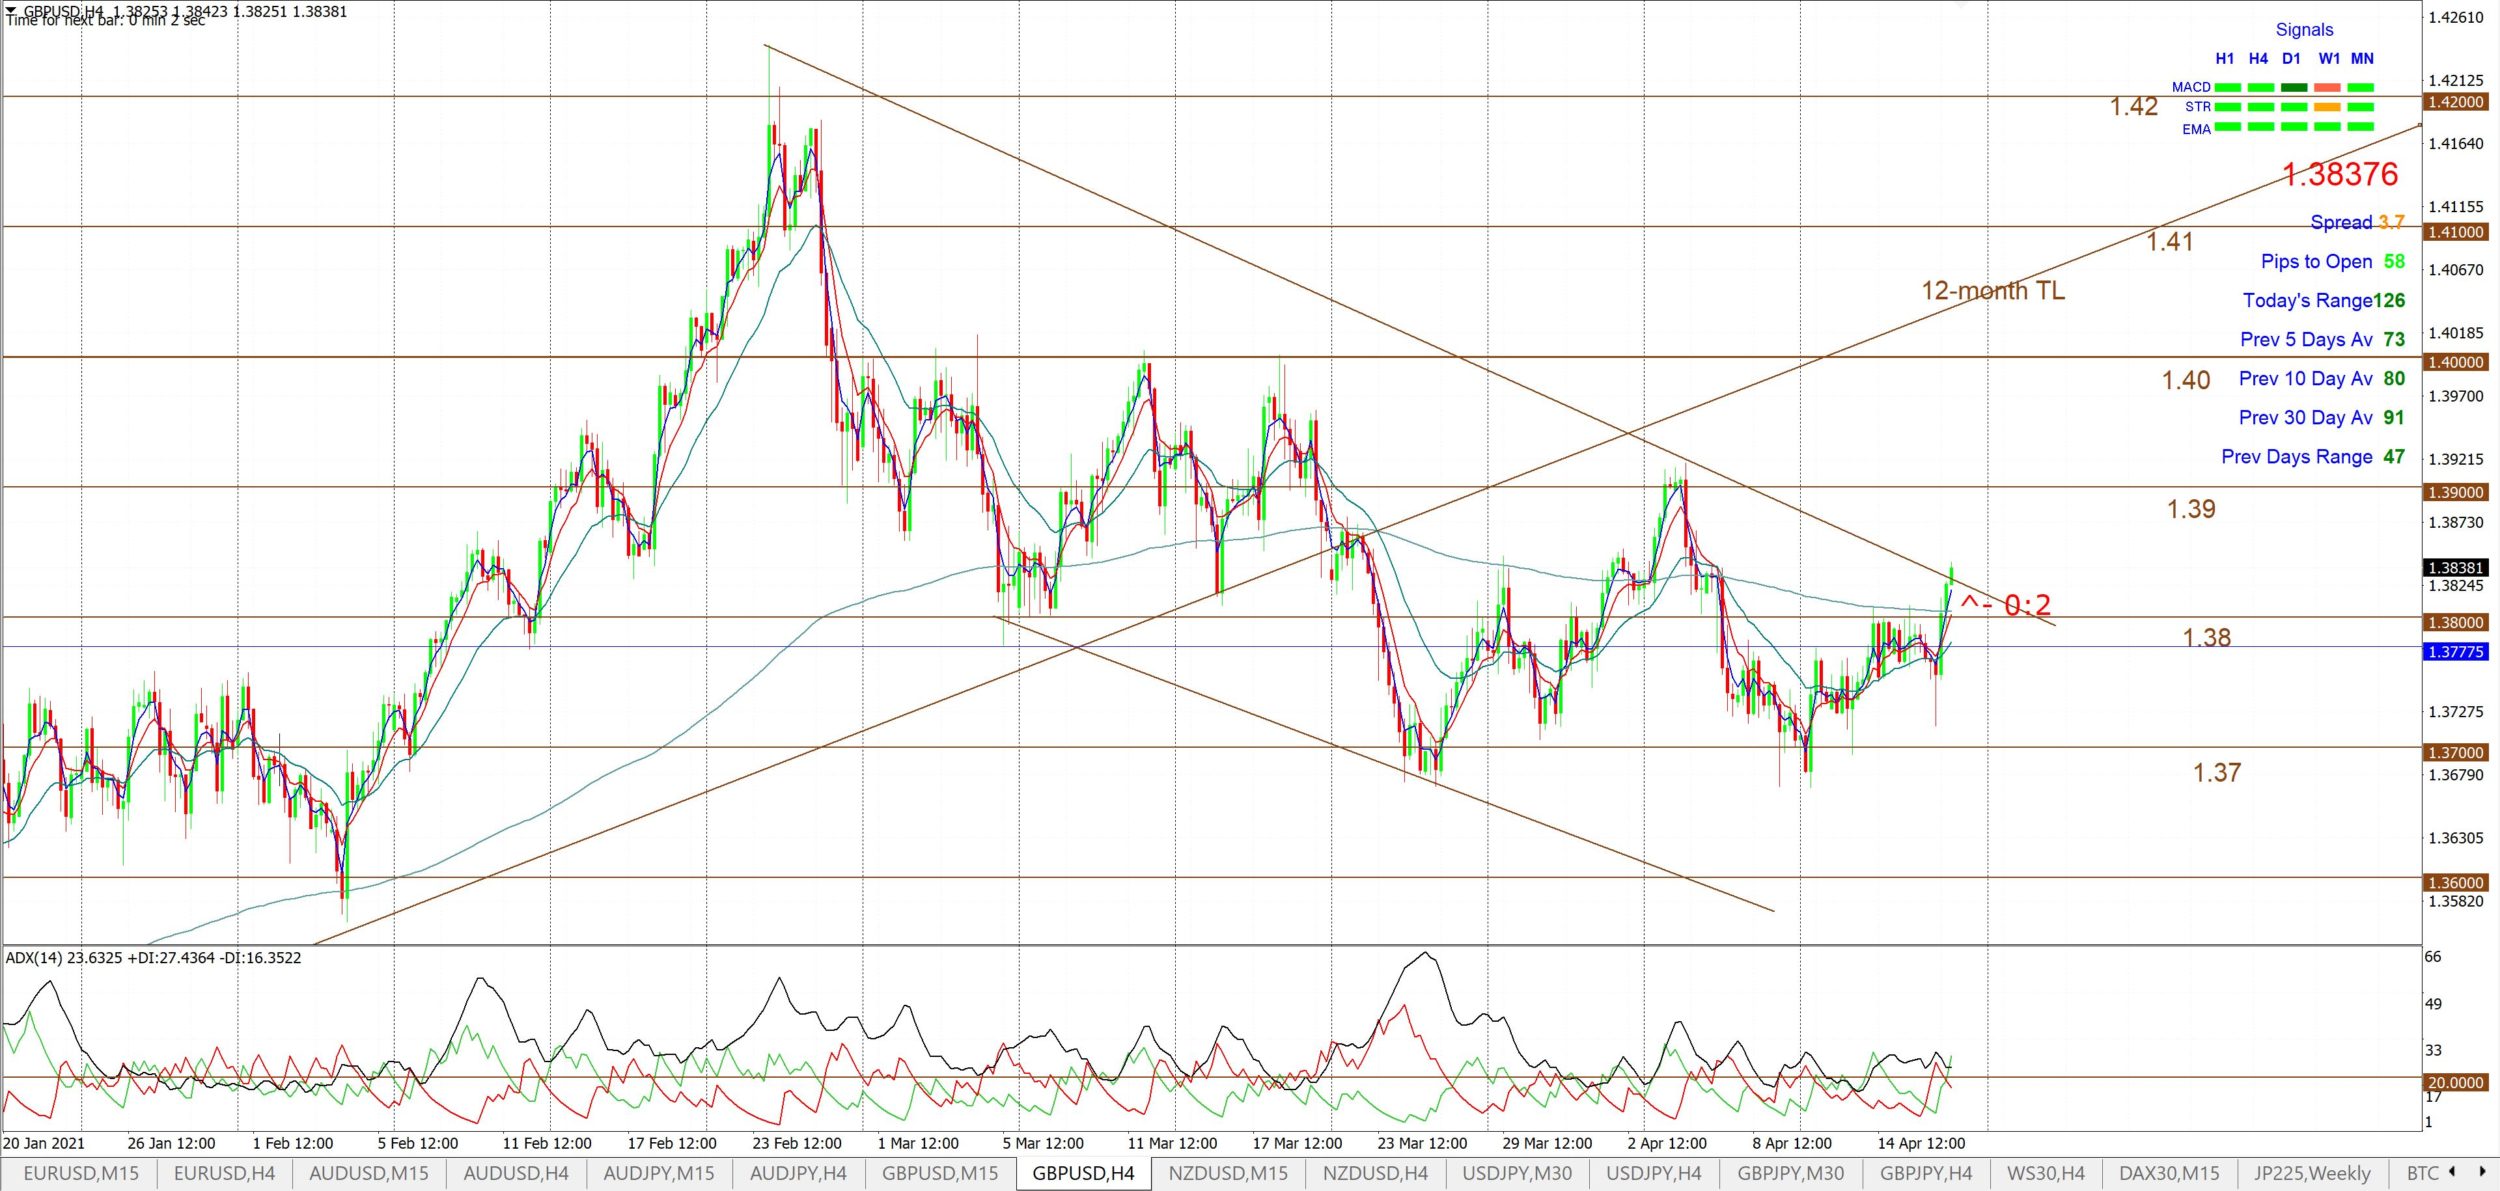
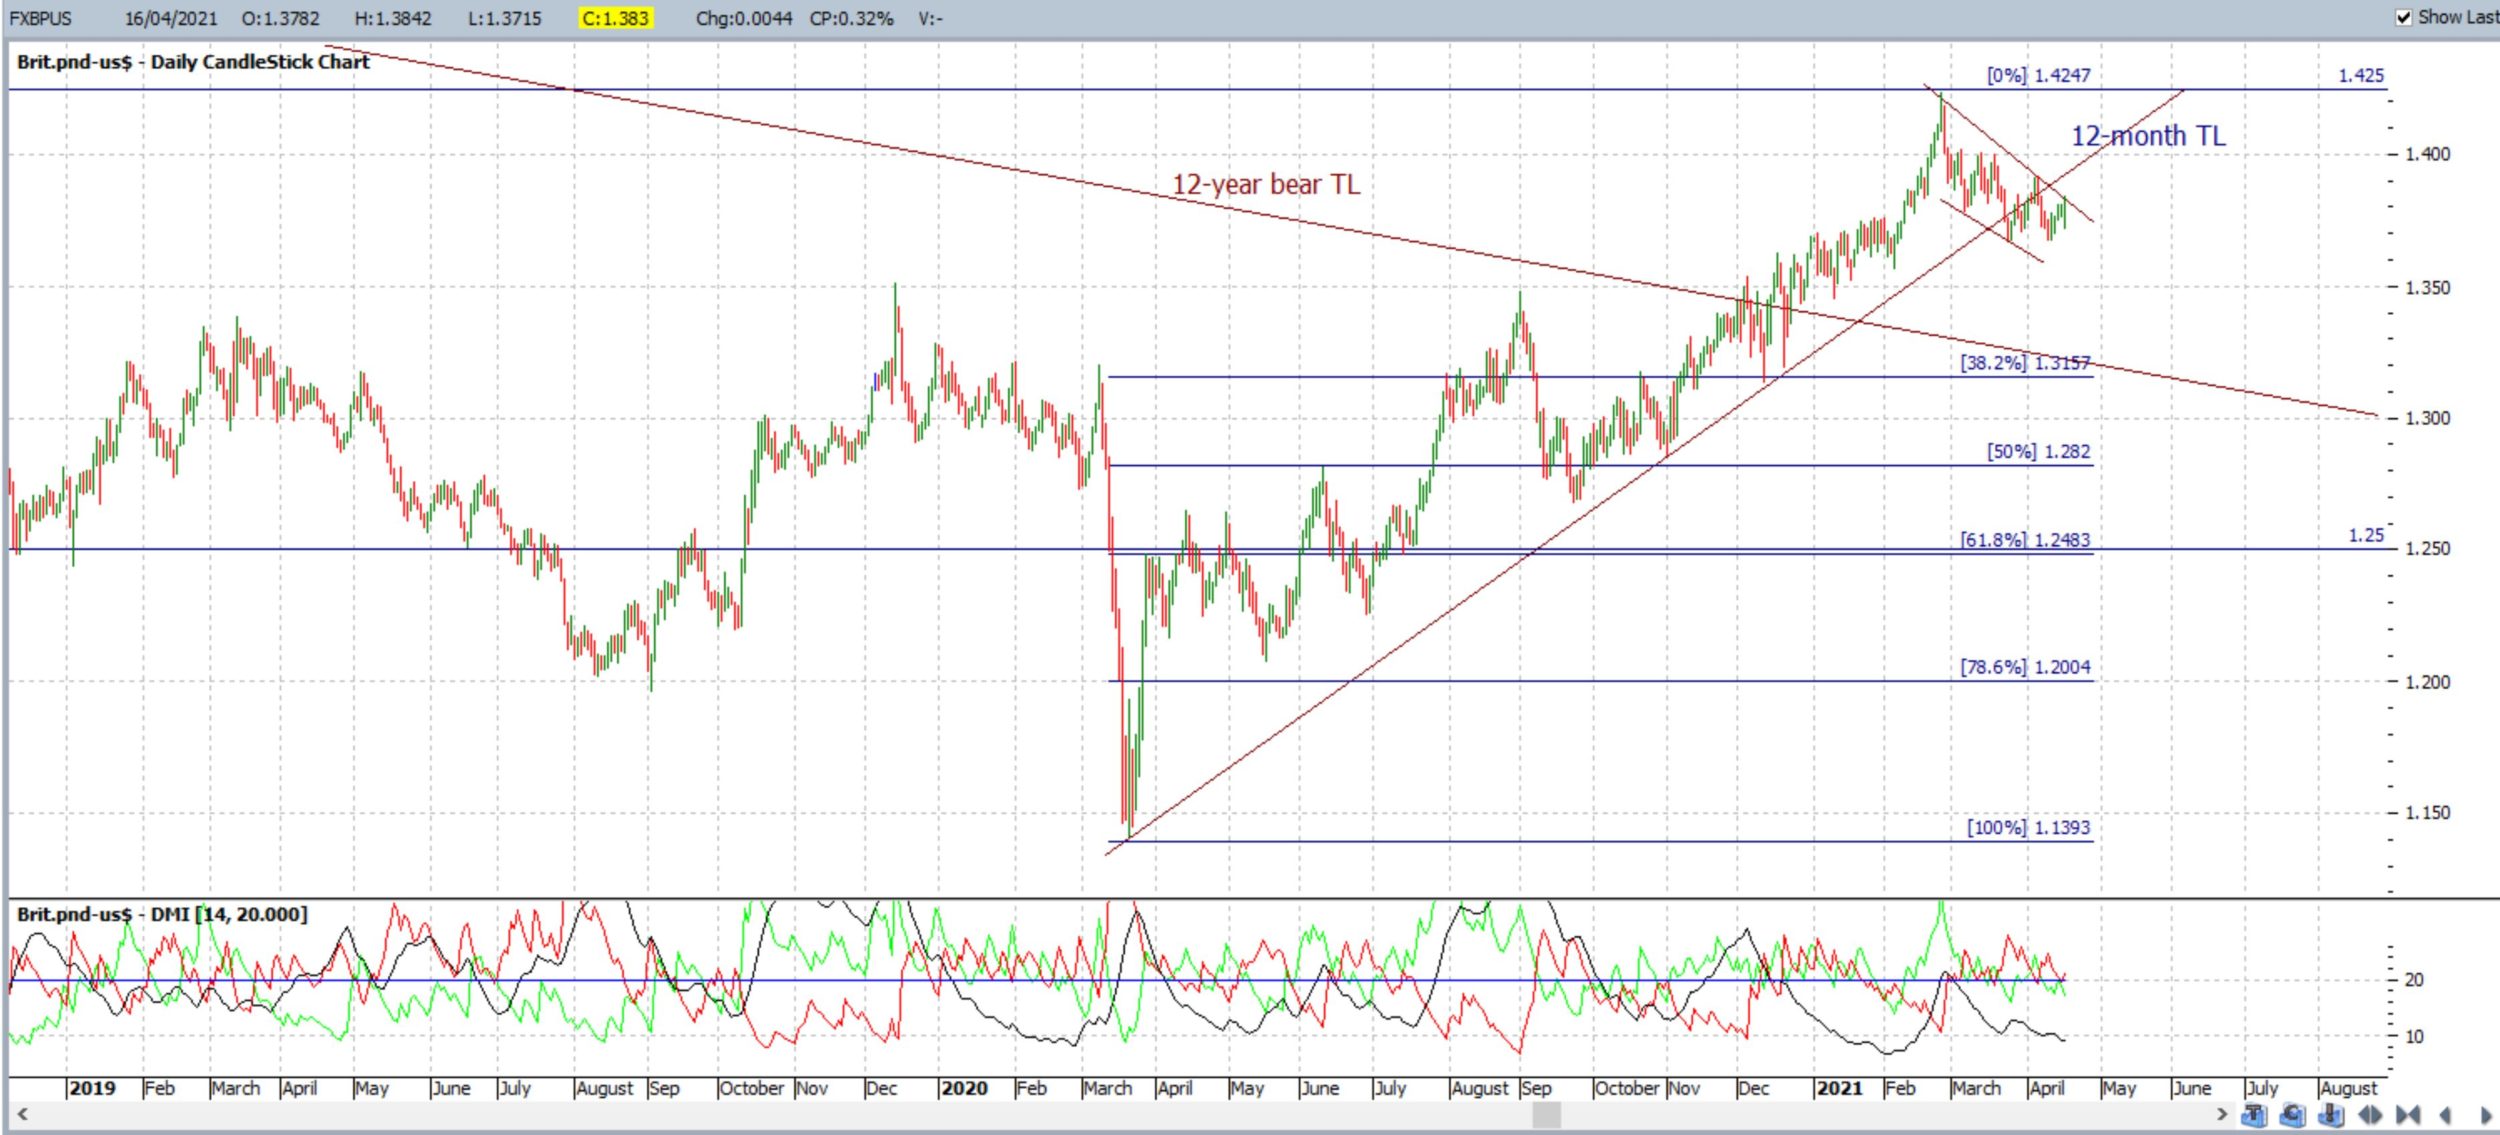
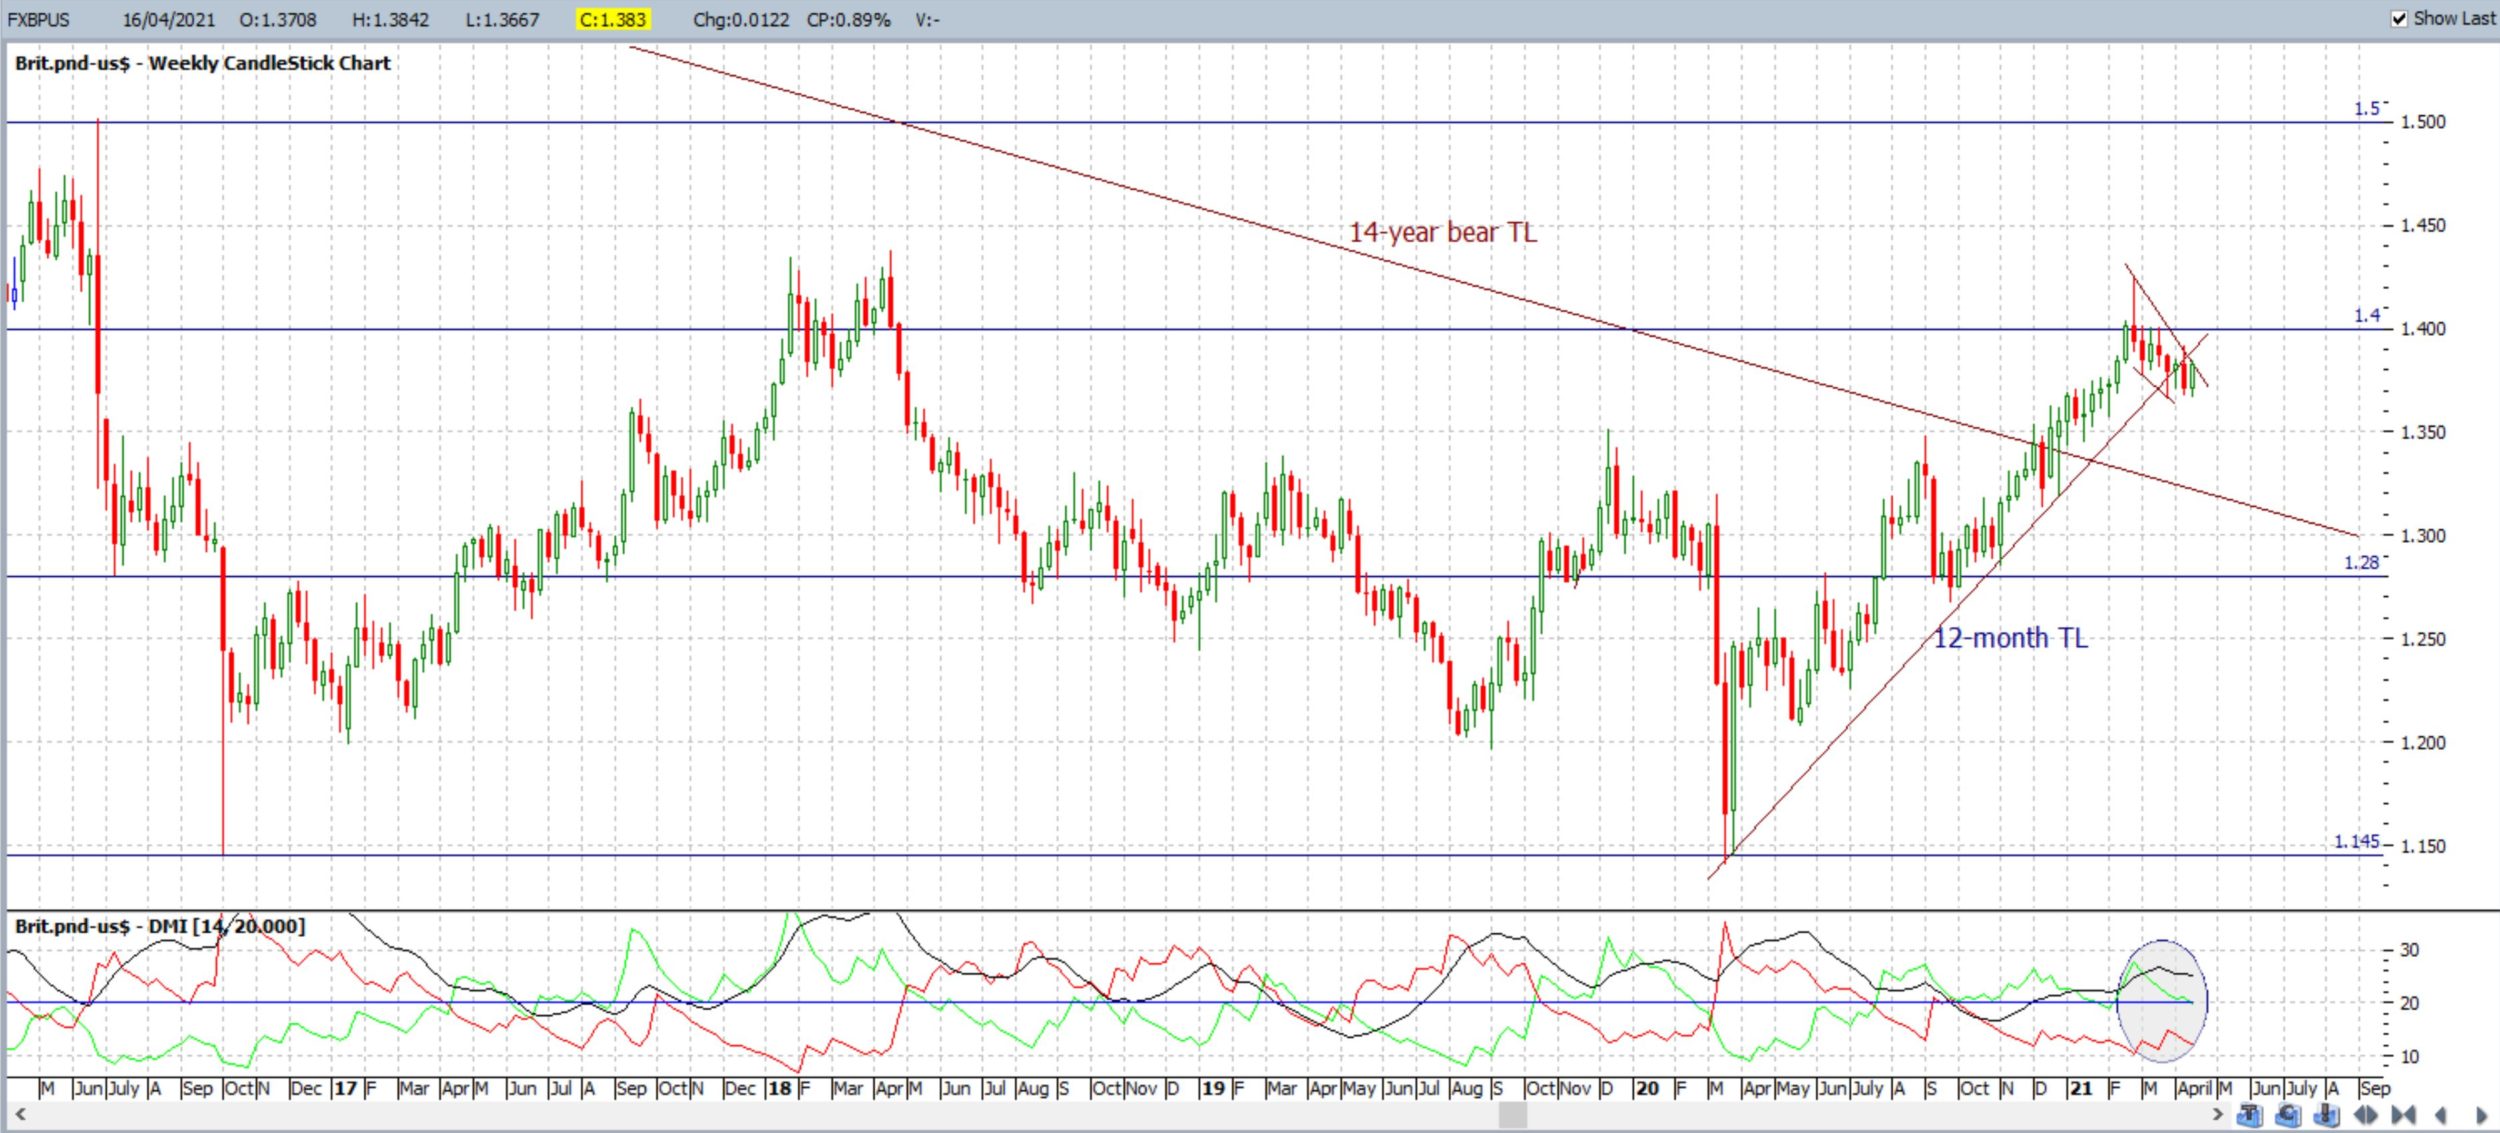
GBP/USD: The Cable closed with a bullish, almost ‘engulfing’, weekly candle and looks to be starting a bullish breakout from the 4hr chart’s bullish-reversal descending wedge; a wedge that had been brewing for some weeks. Price action is also currently just above 1.38 making this the horizontal level to watch for any new make or break.
NB: The longer-term target for any bullish continuation above the previously broken 14-yr trend line, noted here in my article on December 20th, is the monthly chart’s 61.8% Fibonacci, near 1.75. Price action at the initial breakout was around 1.35 and has reached to 1.42, a move of 700 pips, so this trend line breakout was a great clue about things to come and the target for this move has not even been reached yet!
Bullish targets: Any continued bullish wedge breakout and hold above 1.38 would bring 1.39 and 1.40 into focus. After that, watch for any push to the recently broken 12-month support trend line and, then, whole-number levels on the way up to 1.50 as this is a previous S/R region on the weekly chart. Any bullish continuation after that would bring whole-number levels on the way up to 1.75 into focus.
Bearish targets: Any bearish 4hr chart break back below 1.38 would bring 1.37 and 1.36 and, then, the lower wedge trend line into focus. After that, watch whole-number levels on the way down to 1.25 as this is near the 61.8% Fibonacci of the March 2020 – Feb 2021 swing High move.
- Watch 1.38 and for any continued wedge breakout:
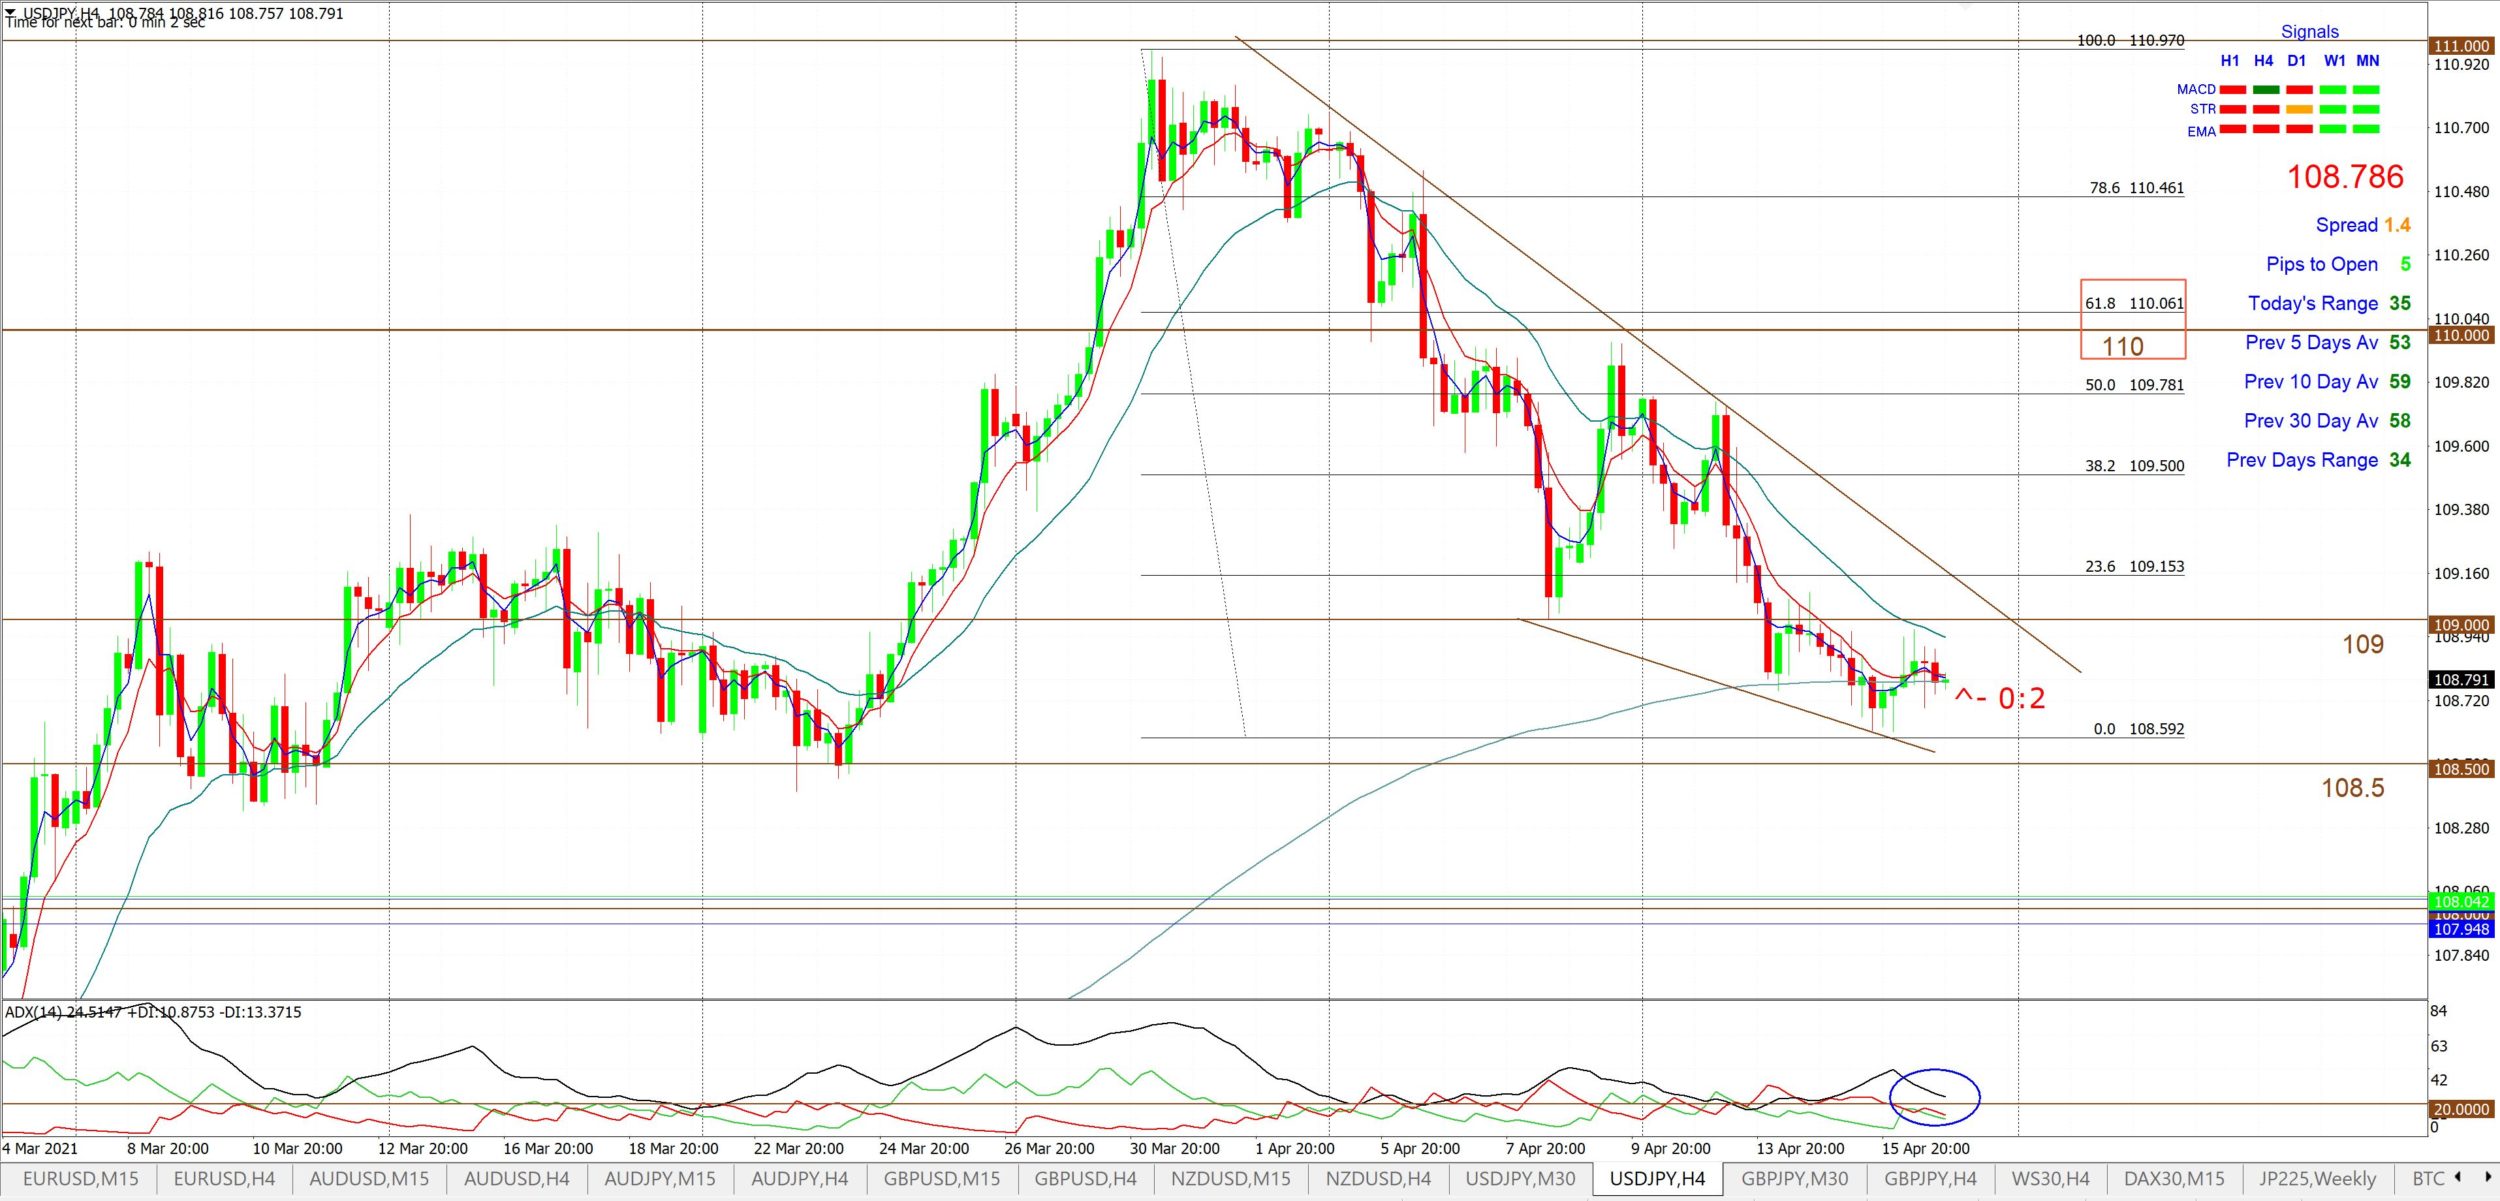
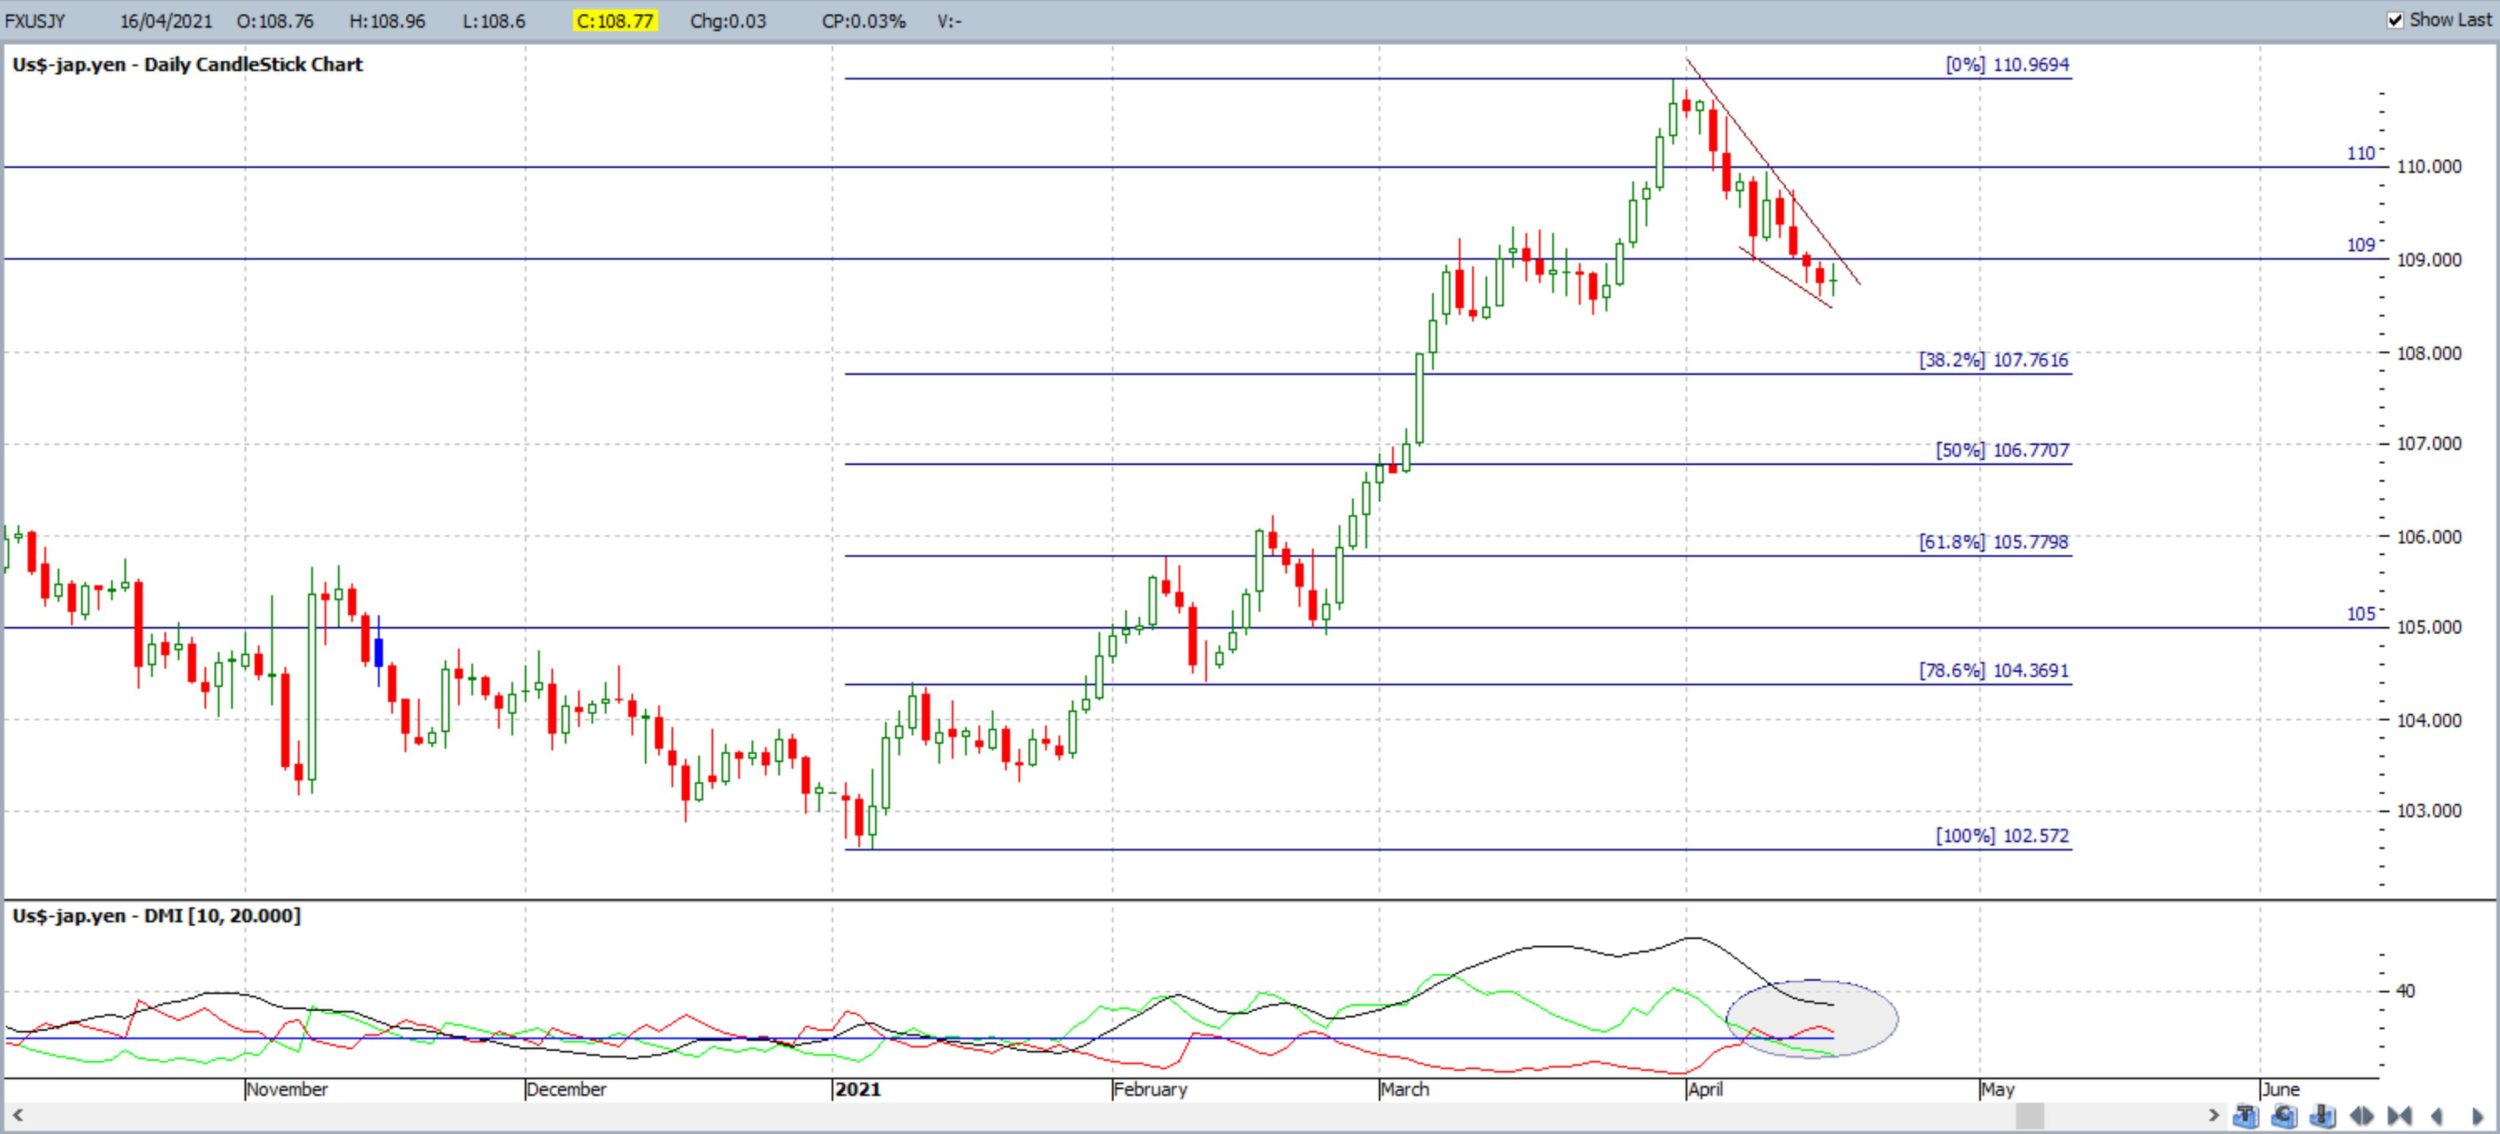
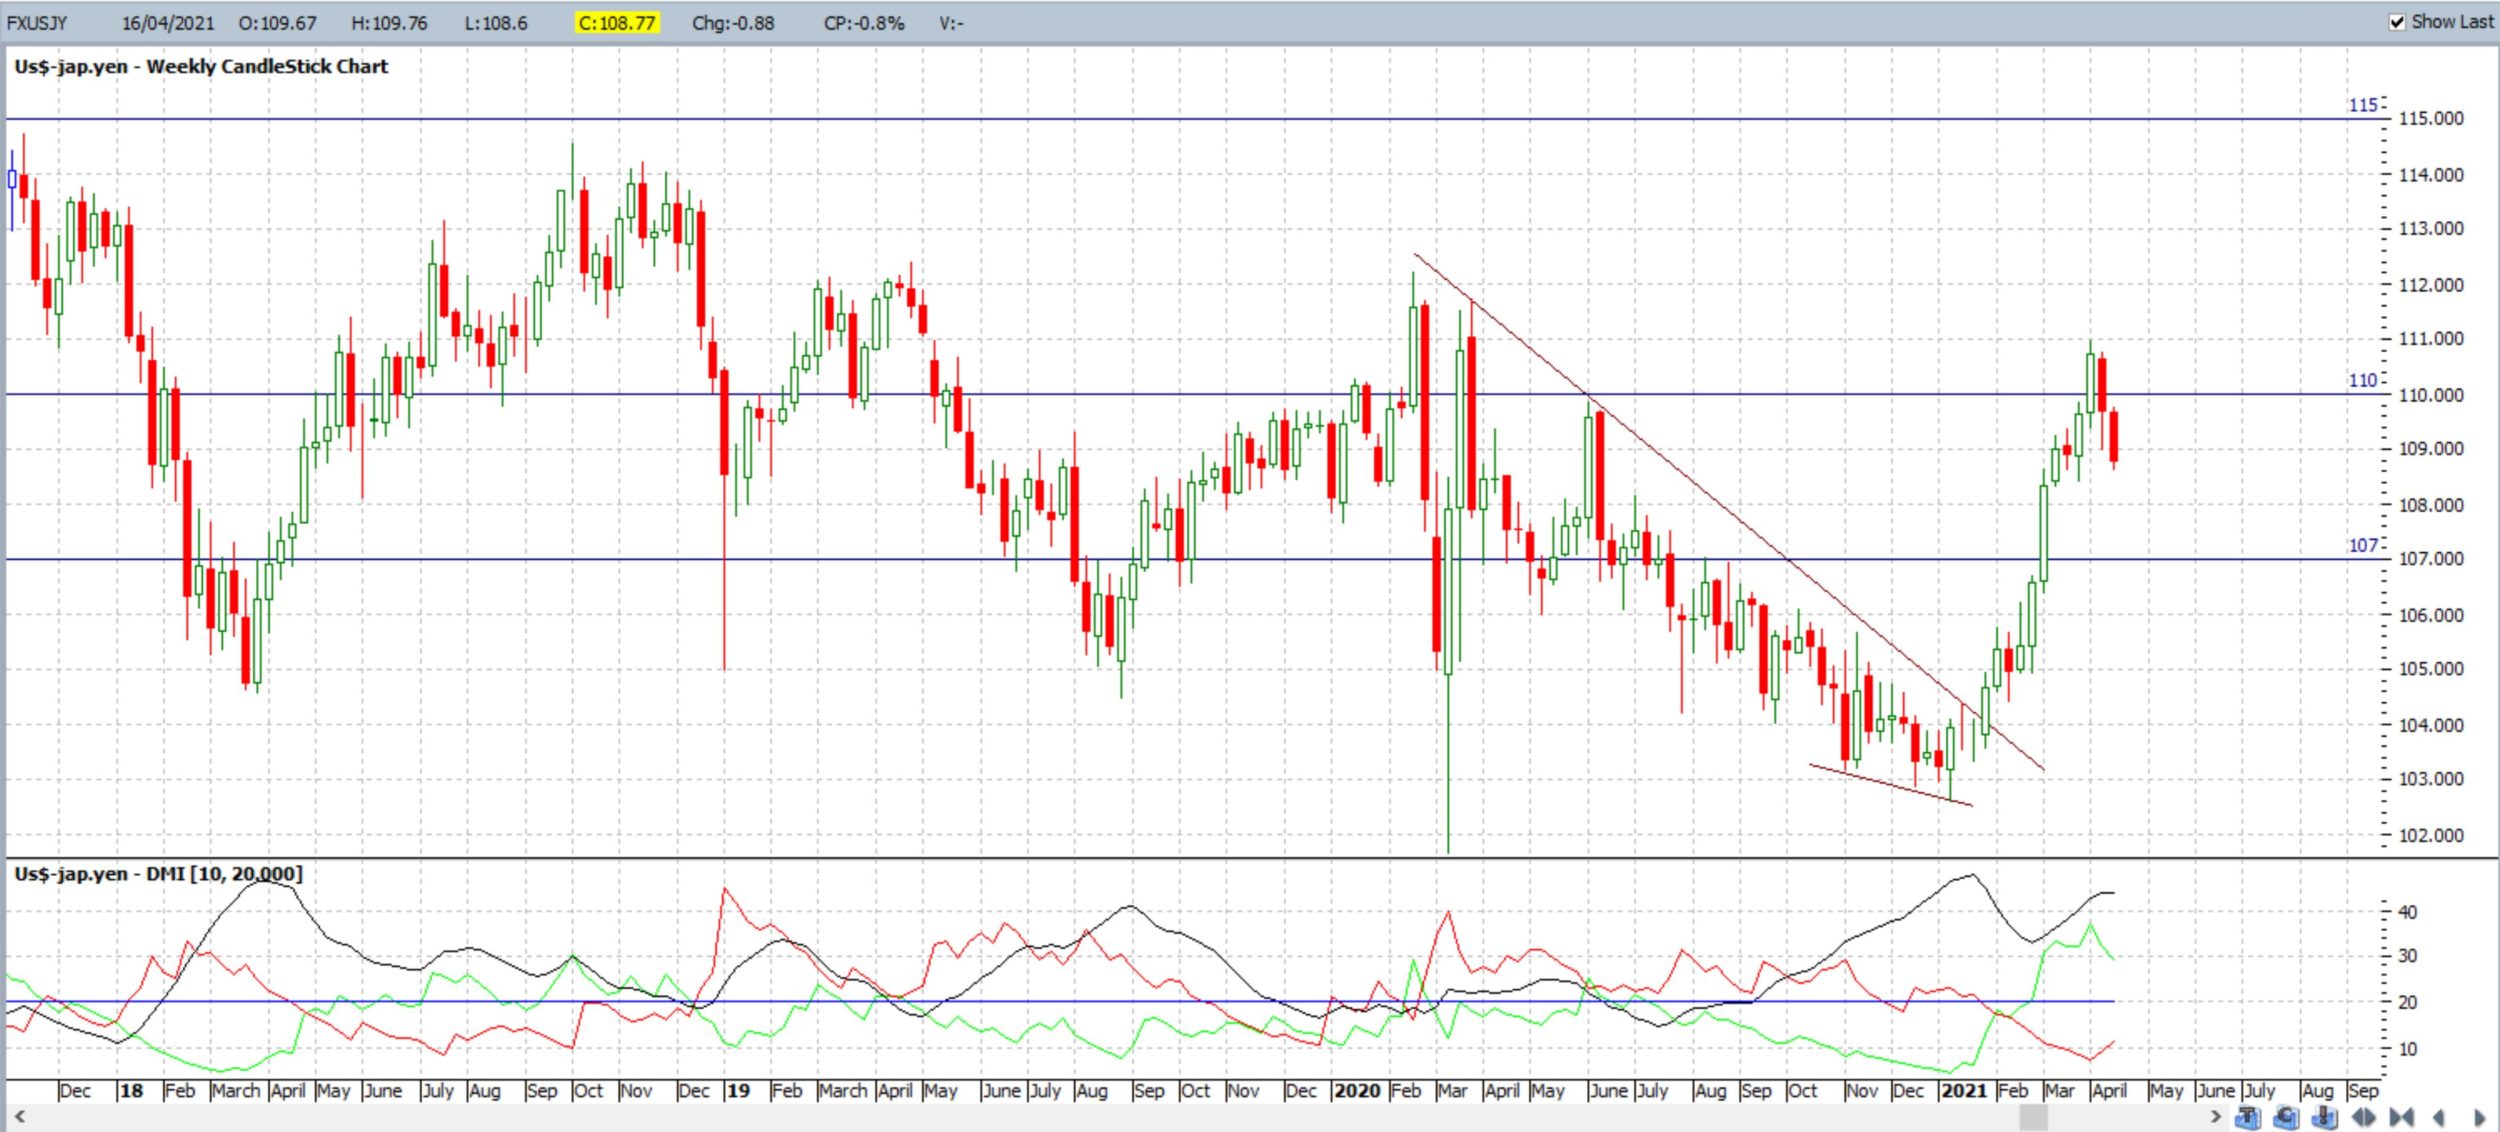
USD/JPY: The USD/JPY closed with a bearish weekly candle following last weeks two bearish signals of a bearish engulfing weekly candle and bearish-reversal Railway Track pattern.
Price closed the week just above 108.50 making this the one to watch for any new make or break BUT there are revised 4hr chart wedge trend lines to monitor for any new breakout.
NB: The bullish weekly-chart descending wedge breakout was first noted in my article of January 31st. Price action at the initial breakout was around 104.5 and has reached to near 111, a move of around 650 pips, so this trend line breakout was a great clue about things to come!
Bullish targets: Any bullish 4hr chart wedge breakout would bring 109 into focus followed by 110 as the latter is near the 4hr chart’s 61.8% Fibonacci. After that, watch whole-numbers on the way up to 115.
Bearish targets: Any bearish 4hr wedge breakout below 108.50 would bring whole-number levels on the way down to 105 into focus as this is near the 61.8% Fibonacci of the Jan-March 2021 swing High move.
- Watch 108.50 and for any new 4hr chart wedge trend line breakout.
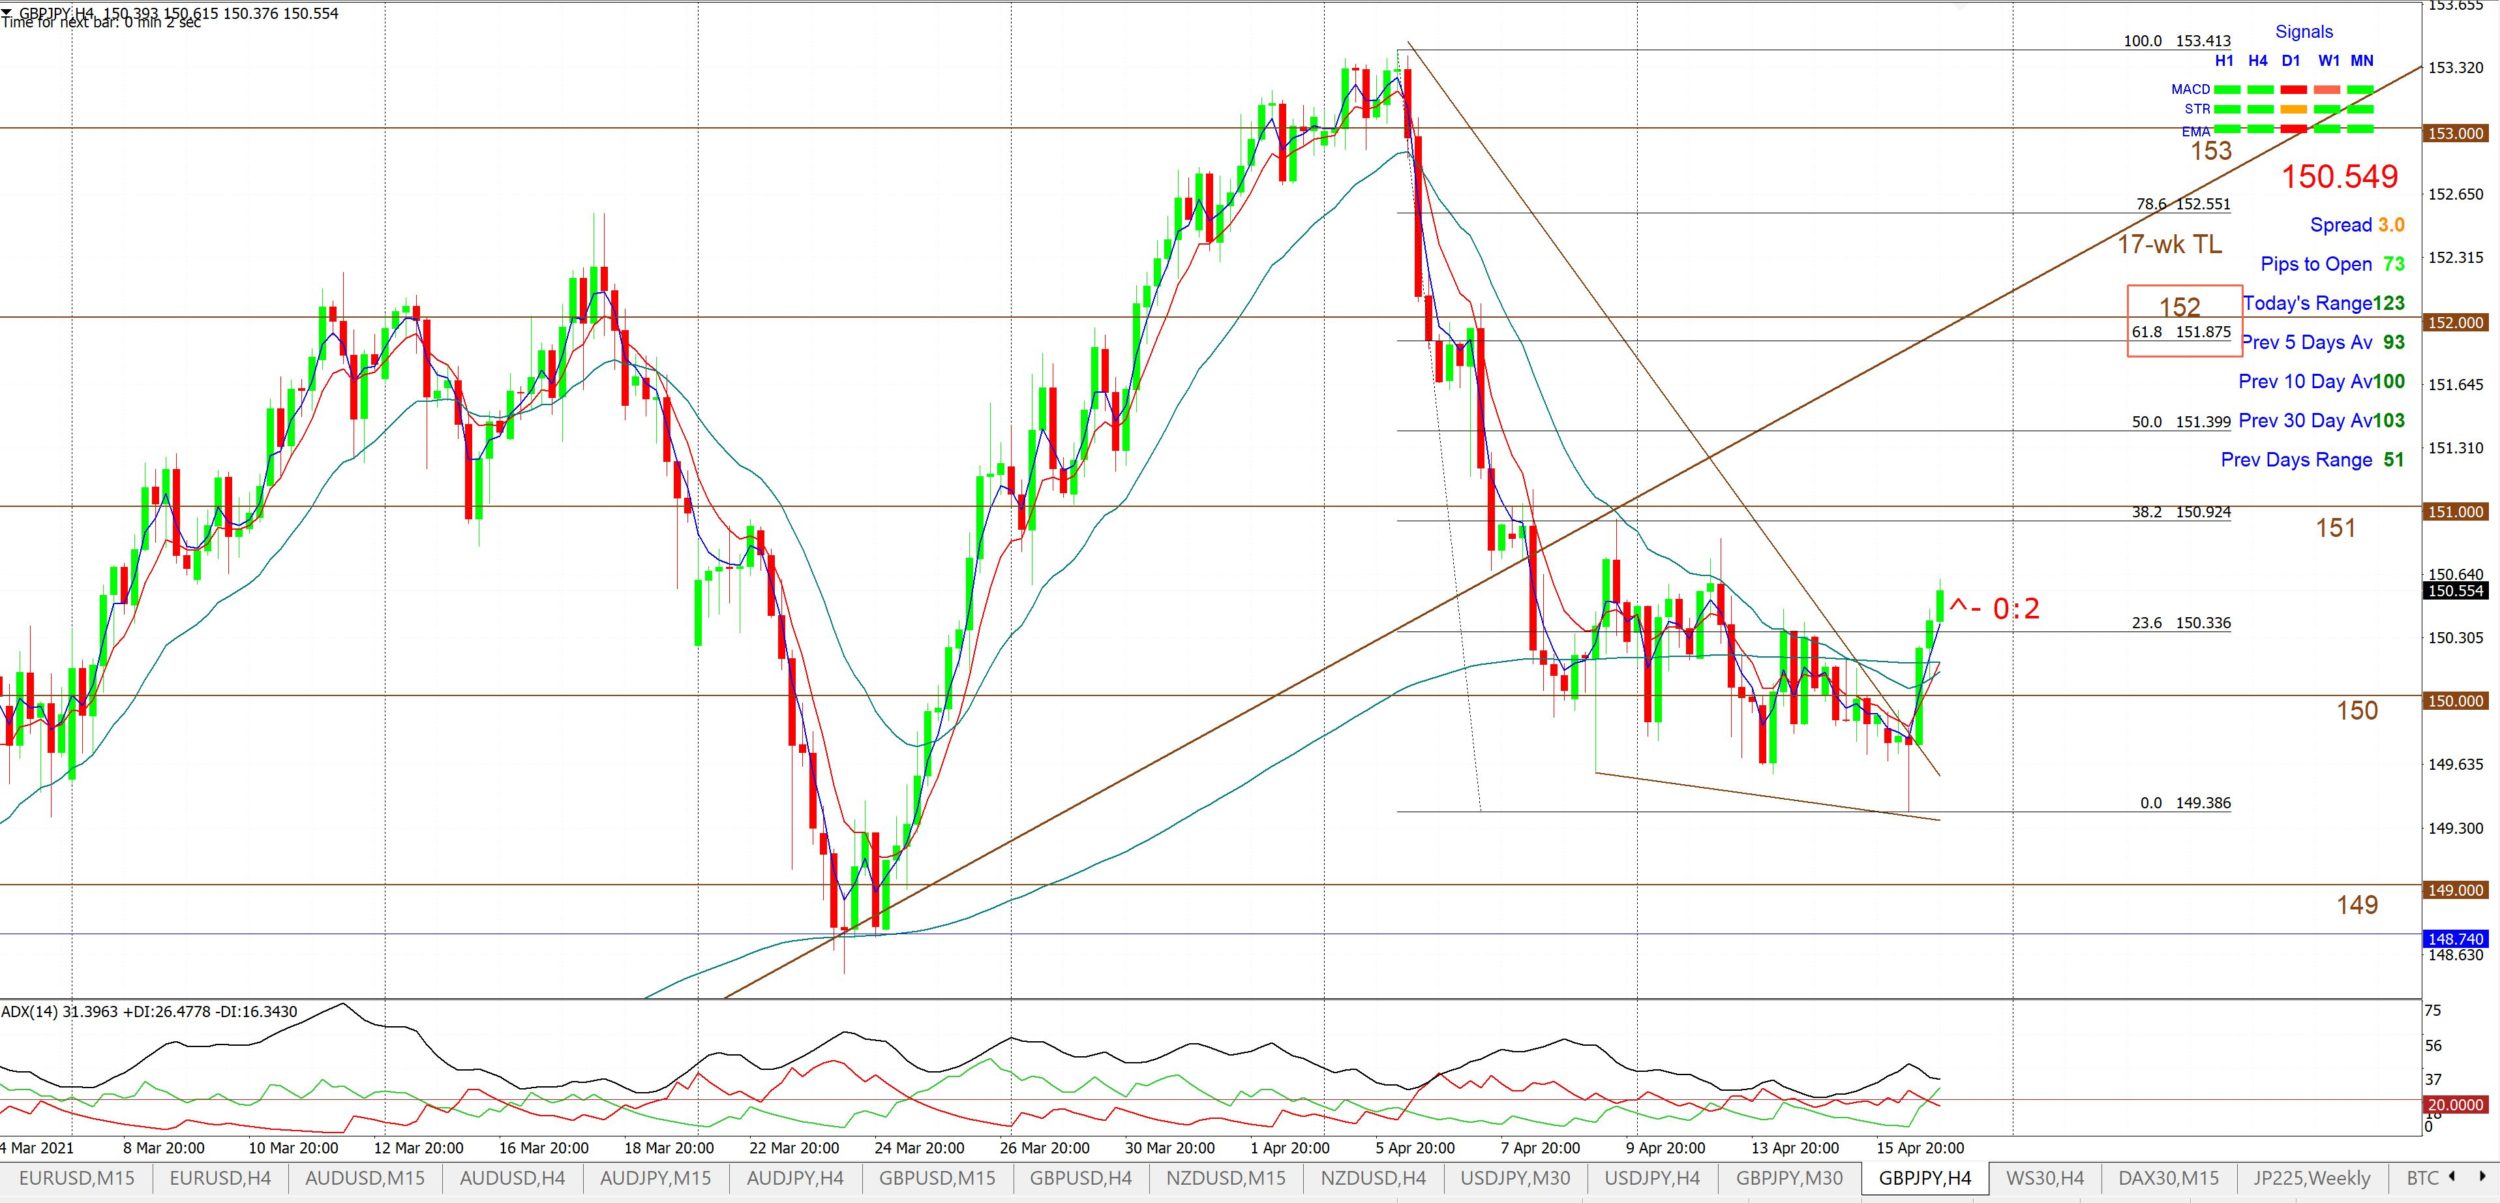
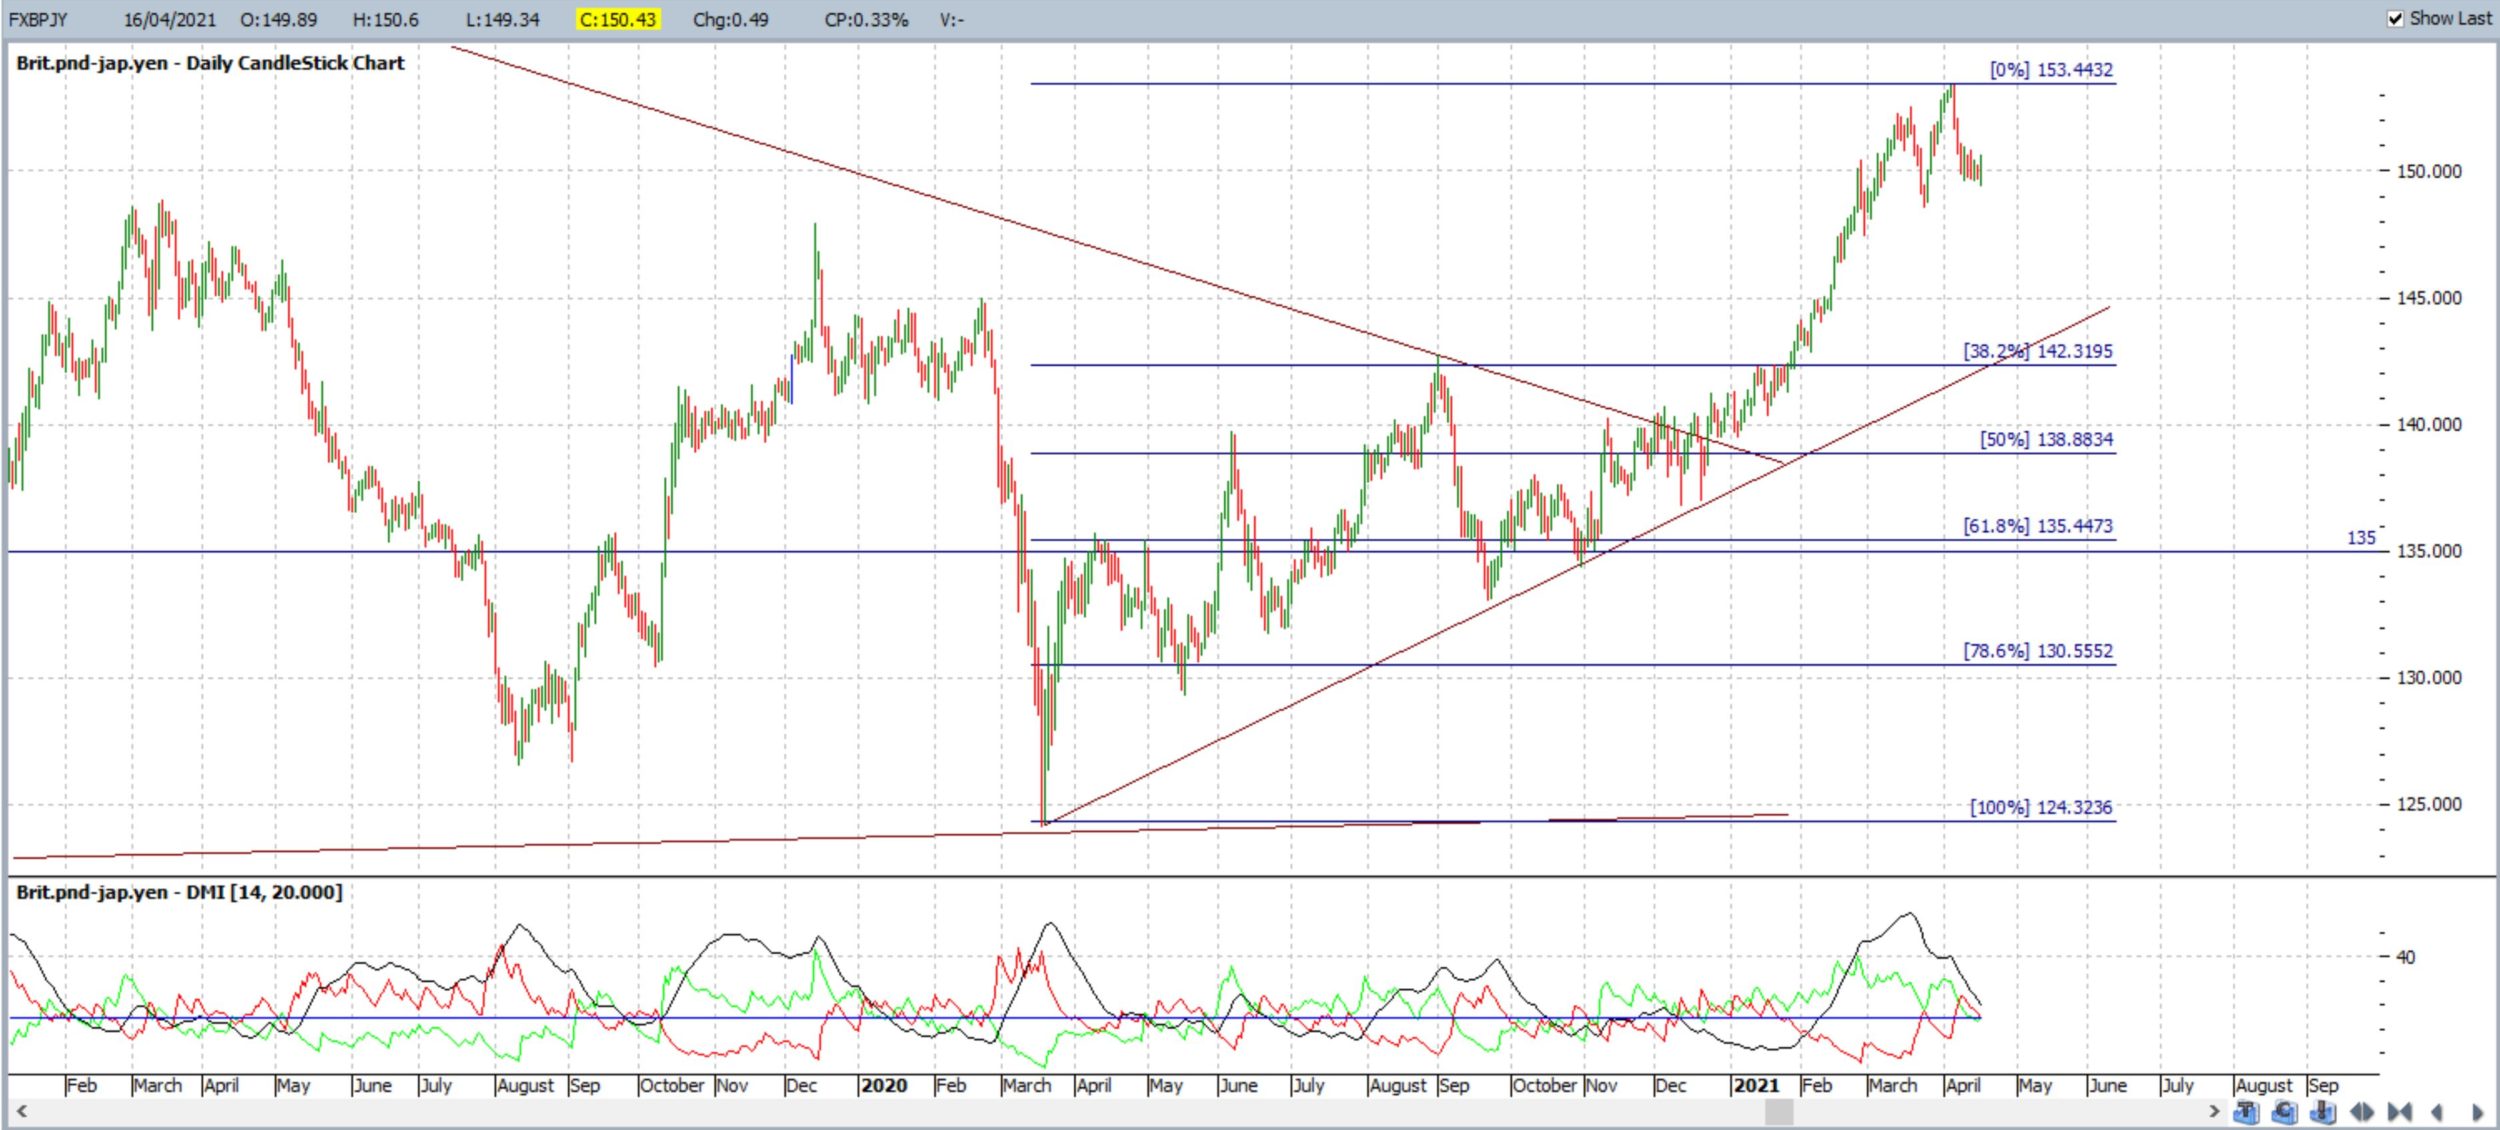
GBP/JPY: The GBP/JPY closed with a bullish-coloured Doji, and almost Inside, weekly candle with both reflecting indecision as price struggles to recover back above a recently broken 17-week support trend line. There looks to be a new 4hr chart wedge breakout in play so 151 will be the resistance to monitor for any progress here.
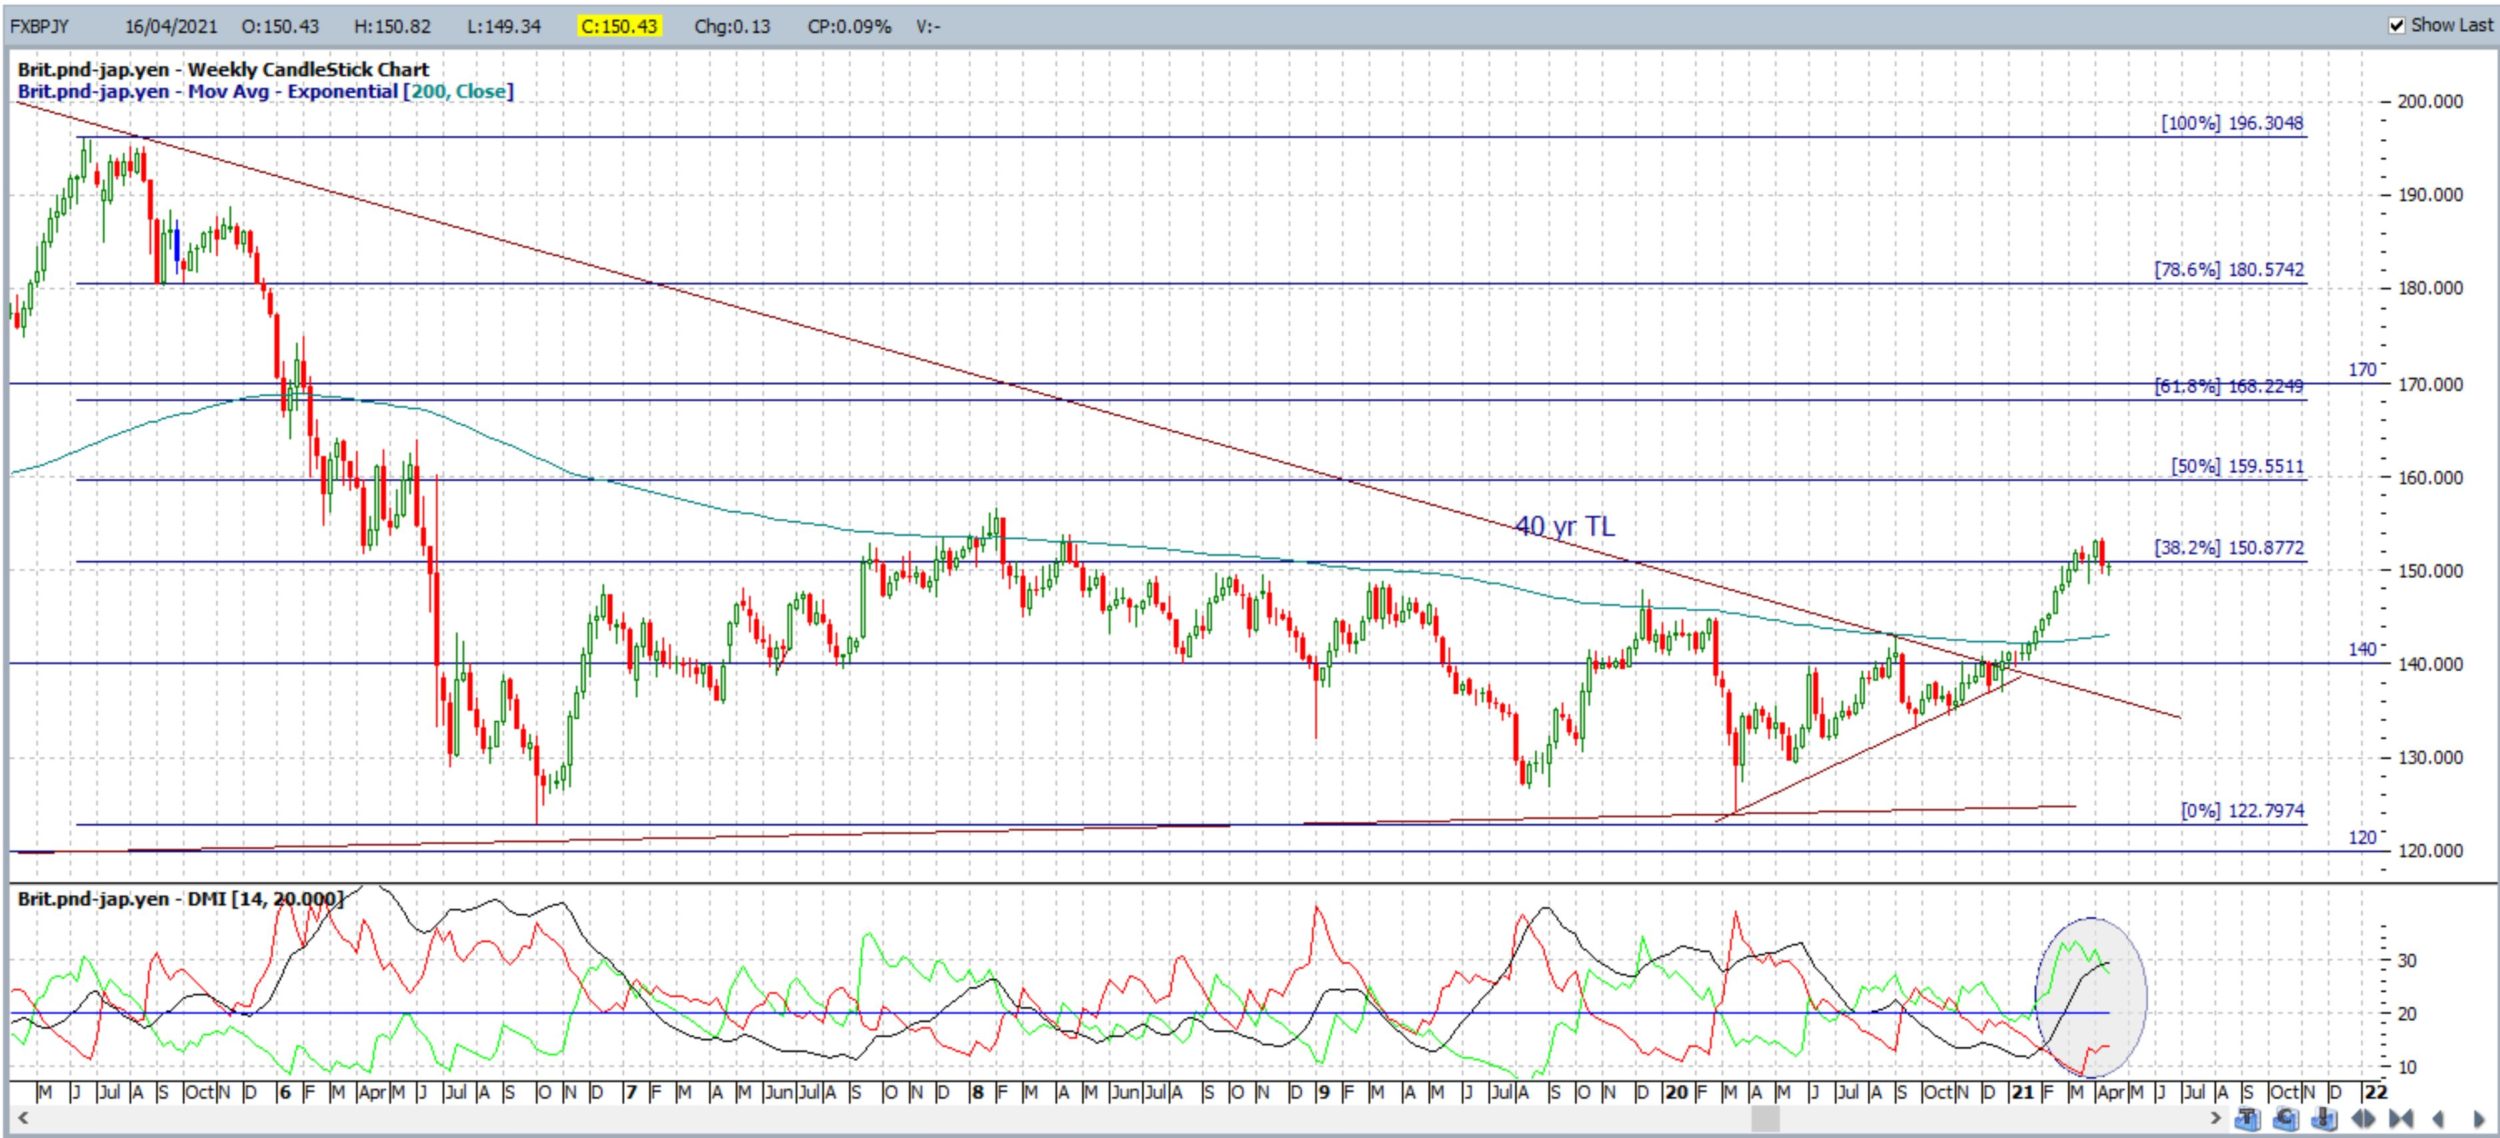
NB: The longer-term target for any bullish continuation above the previously broken 40-yr trend line, noted in my post of January 3rd, is the weekly chart’s 61.8% Fibonacci, near 170. Price action at the time of this breakout was near 141 and has reached up to 153, a move of around 1,200 pips, and so is another trend line breakout that has proven to be worthwhile monitoring.
Bullish targets: Any bullish 4hr chart continued wedge breakout would bring 151 into focus followed by 152 and the 17-week support trend line. After that, watch whole-number levels on the way up to the weekly chart’s 61.8% Fibonacci, near 170.
Bearish targets: Any bearish 4hr chart hold below 151 would bring 150 back into focus. After that, watch whole-number levels on the way down to 135 as this is near the 61.8% Fibonacci of the March 2020 – March 2021 swing High move.
- Watch for any continued 4hr chart wedge breakout: