Wed 14th May (11 am)
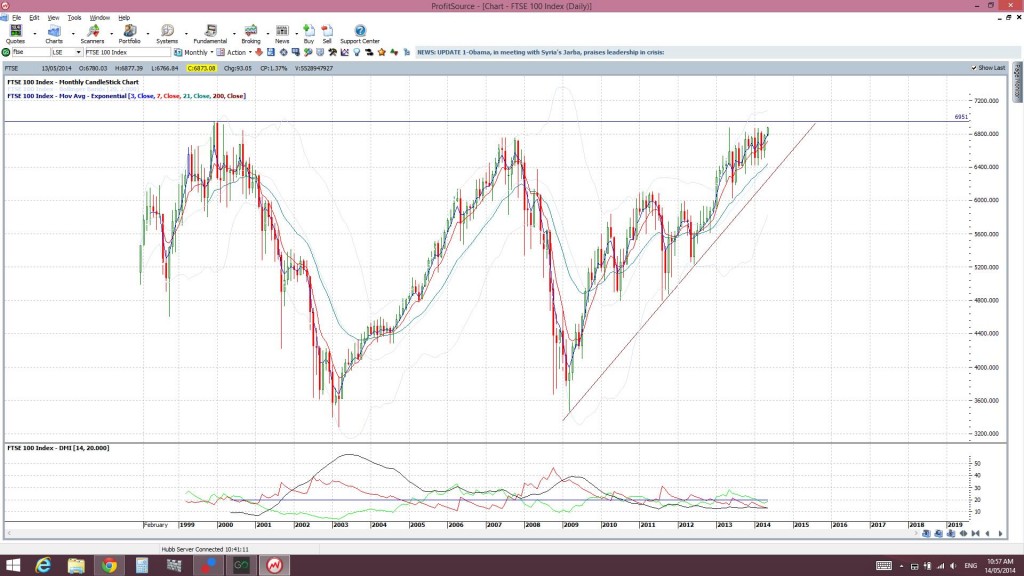
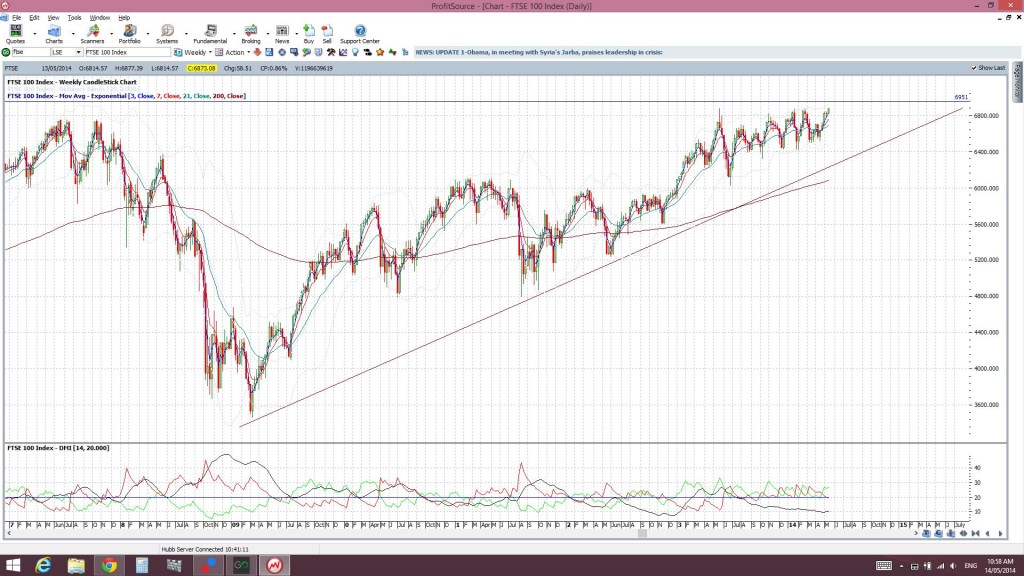
US stock indices keep pushing higher and London’s FTSE 100 is also pushing up to test a major all time high. The FTSE closed at its highest level in 14 years:
FTSE monthly
FTSE weekly
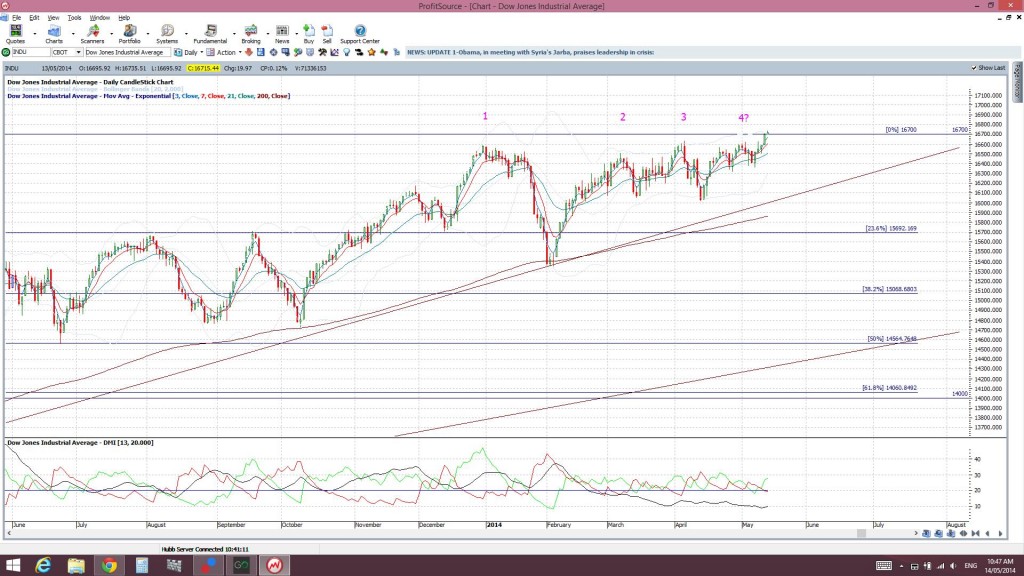
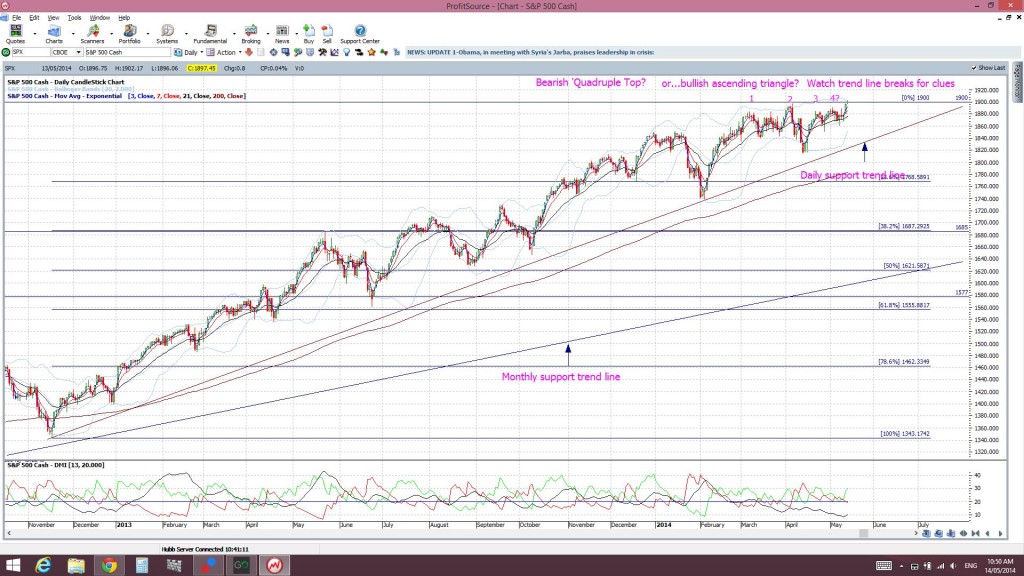
Daily and weekly support trend lines continue to hold on the major indices and three US indices have punched up through bear trend lines and one of these, the DJIA, recorded a new closing high. The S&P500 recorded a new closing high too but is still trading below the psychological 1900 barrier:
DJIA: has made a bullish daily candle close up and out from the ascending triangle but will this hold? A weekly close above this major 16700 resistance level would be more convincing:
S&P500: This is lagging the DJIA a bit as it is still trading within the ascending triangle:
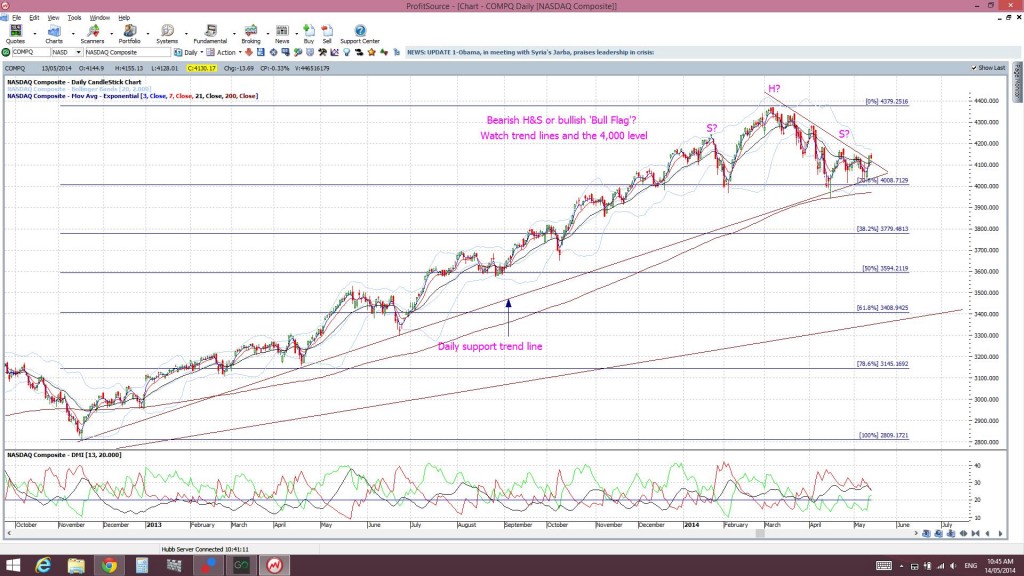
NASDAQ: made a bullish break out yesterday but price pulled back a bit today. This may just be a case of the index testing the broken trend line before further bullish continuation. A weekly candle close up and out from this trend line would be more convincing:
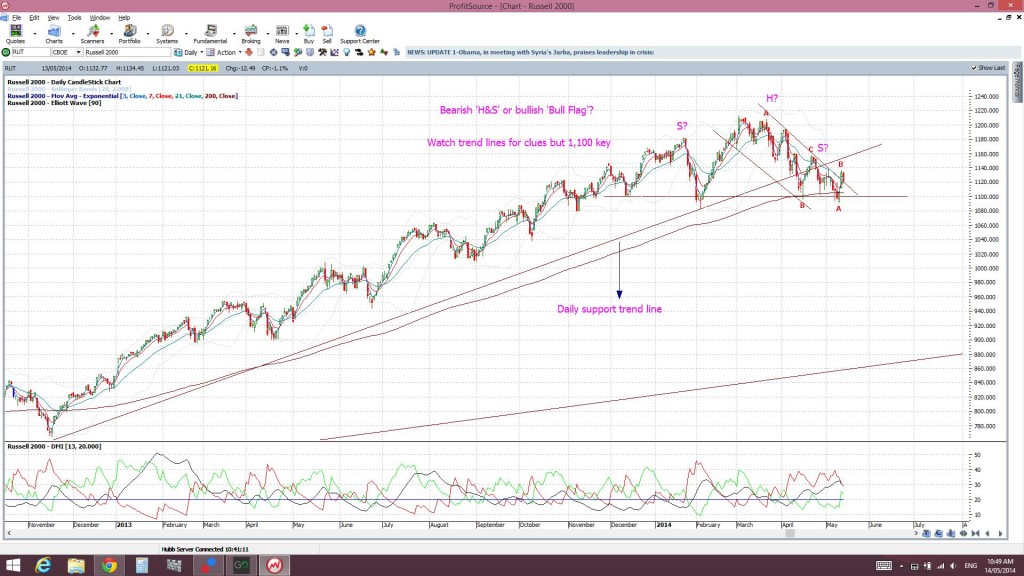
Russell 2000: much the same logic applies here as for the NASDAQ:
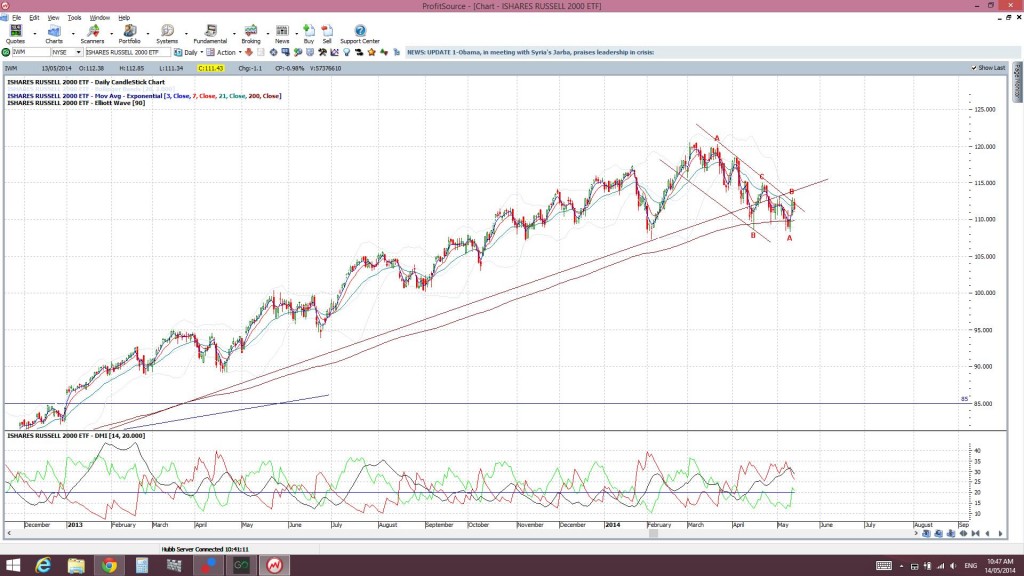
IWM: no breakout here yet:
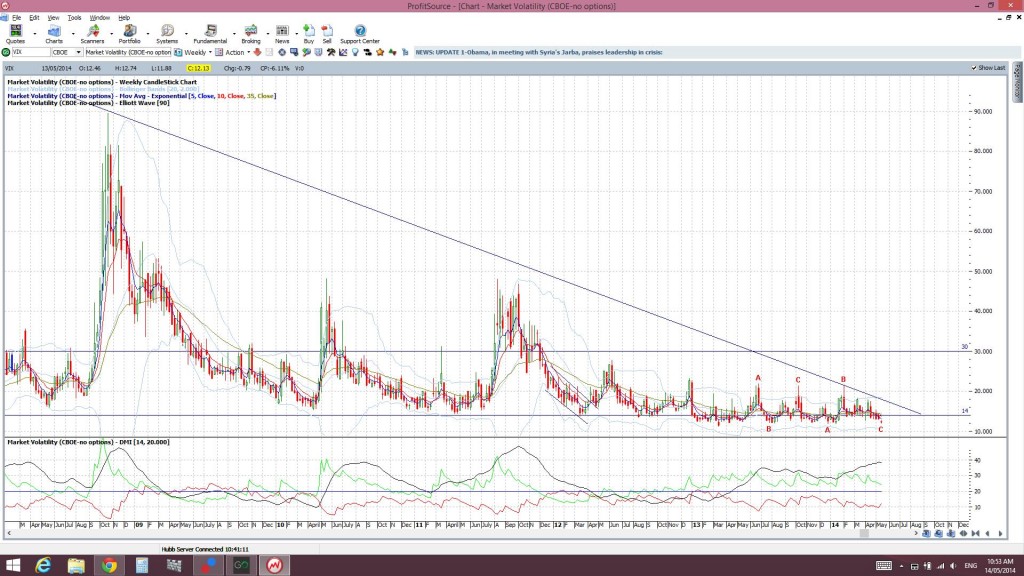
VIX weekly: nor here:
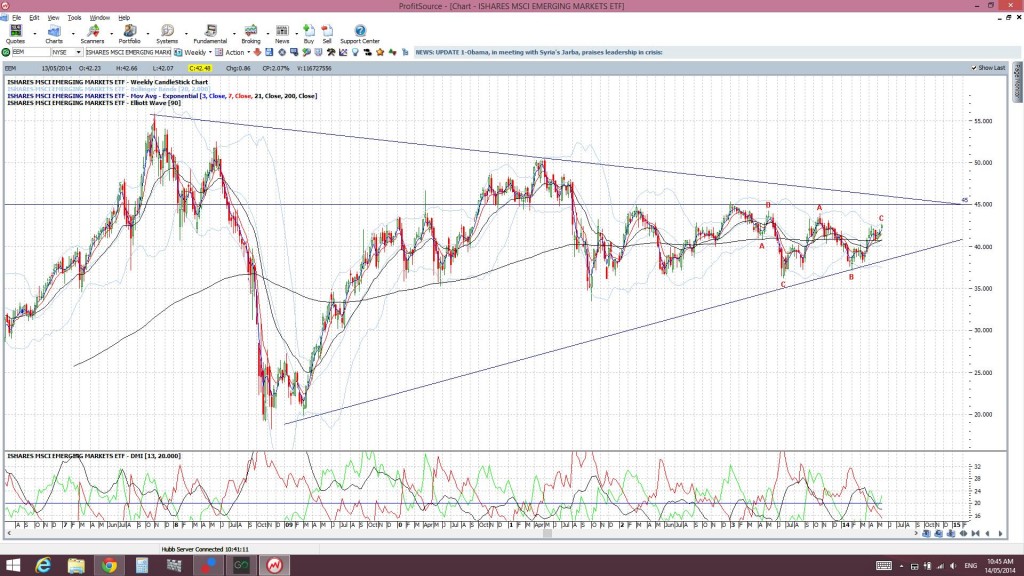
EEM: no bearish warning here yet on emerging markets:
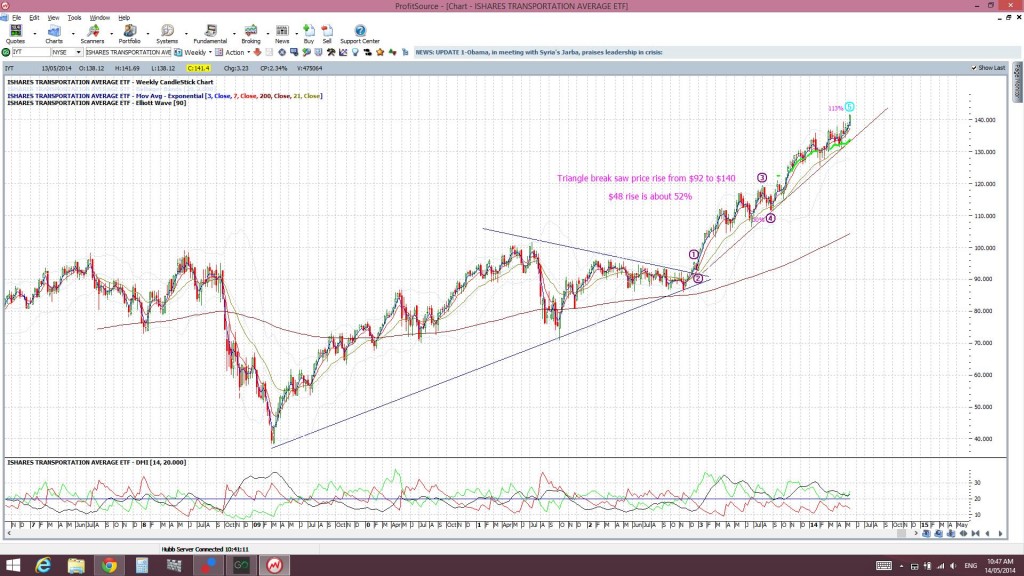
IYT: nor here on the ‘transport’ front:
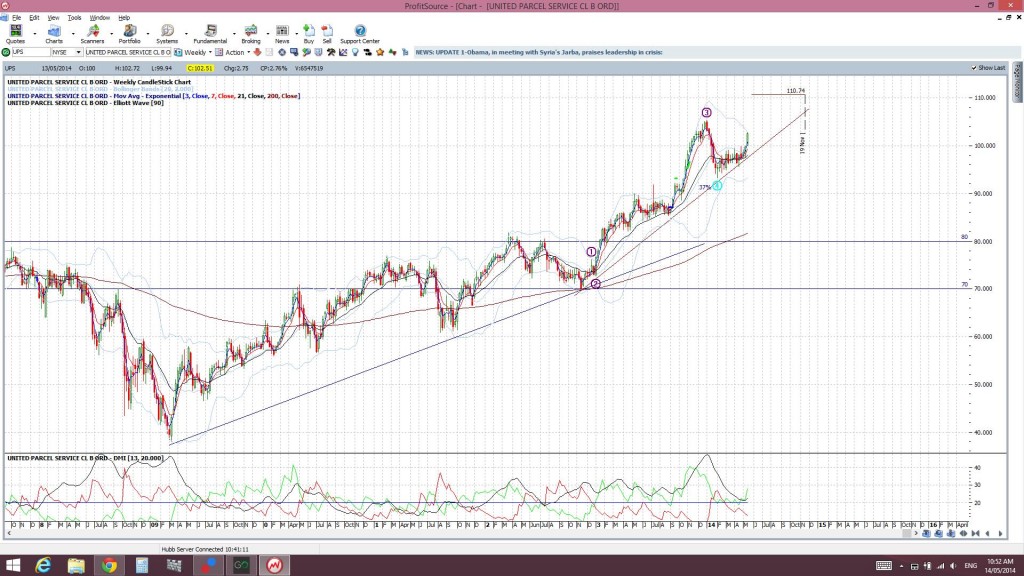
UPS: nor here on the ‘parcel delivery’ front:
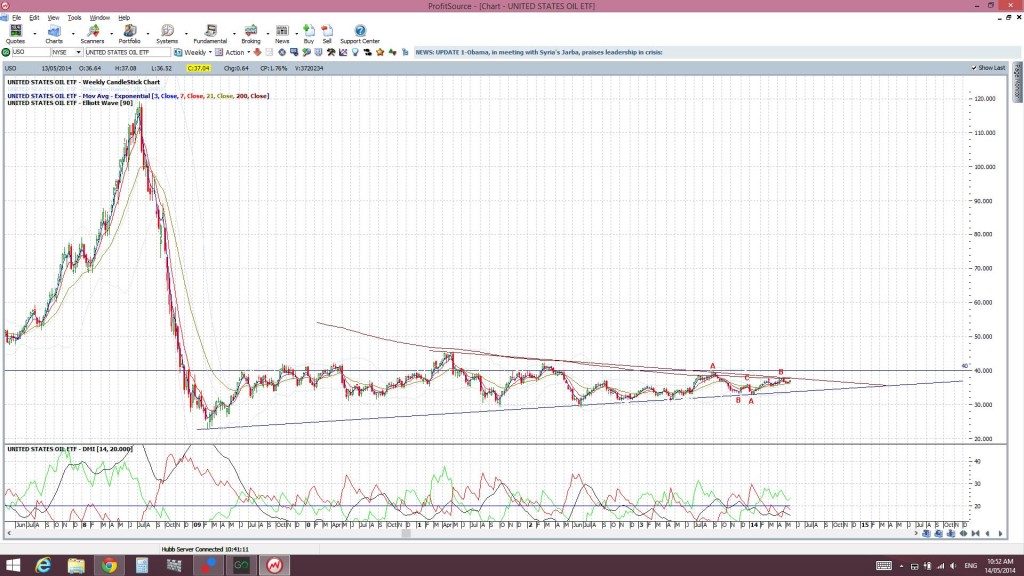
USO: this is one interesting looking chart though!
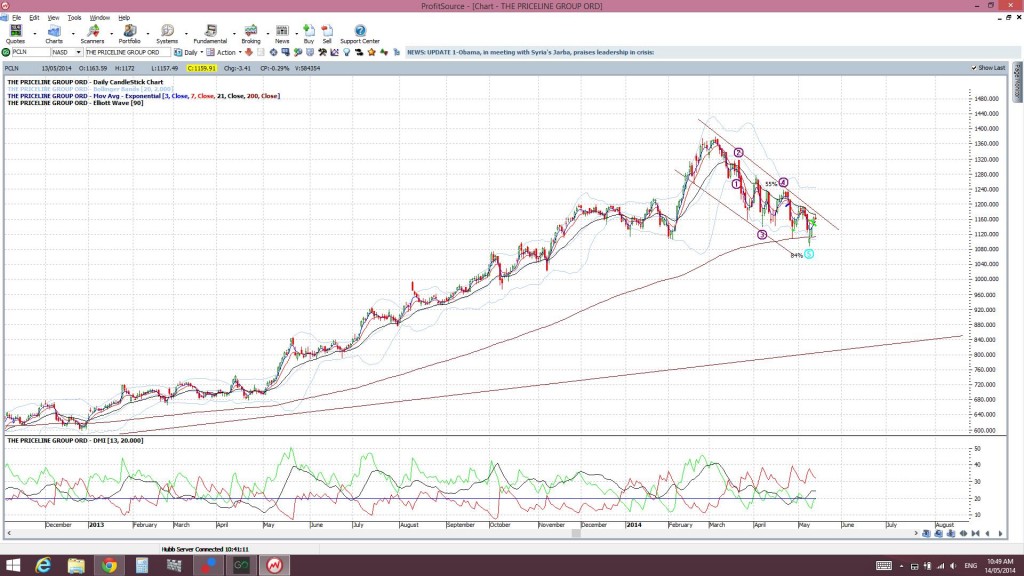
PCLN: still looking ‘Bull Flag’ like to me:
Summary: One may naively predict a bear market looms simply because of ‘what goes up must come down’ BUT I’m not seeing any technical signs as evidence of this just yet. In fact, quite the opposite. The few technical breaks of trend lines that have evolved have been to the bullish side! I would want to see these bullish breaks hold for the weekly candle close though and will be keeping watch to see how they do finish up. At the moment though, the trend is still up and remains so until proven otherwise.


