


The three US index majors, S&P500, DJIA and NASDAQ, plus the the Australian Index ASX-200, are trading off their all-time highs amid the latest uncertainty created by the Russian invasion of Ukraine. In this article I post charts of these indices with my interpretation of their current technical patterns.
S&P500:
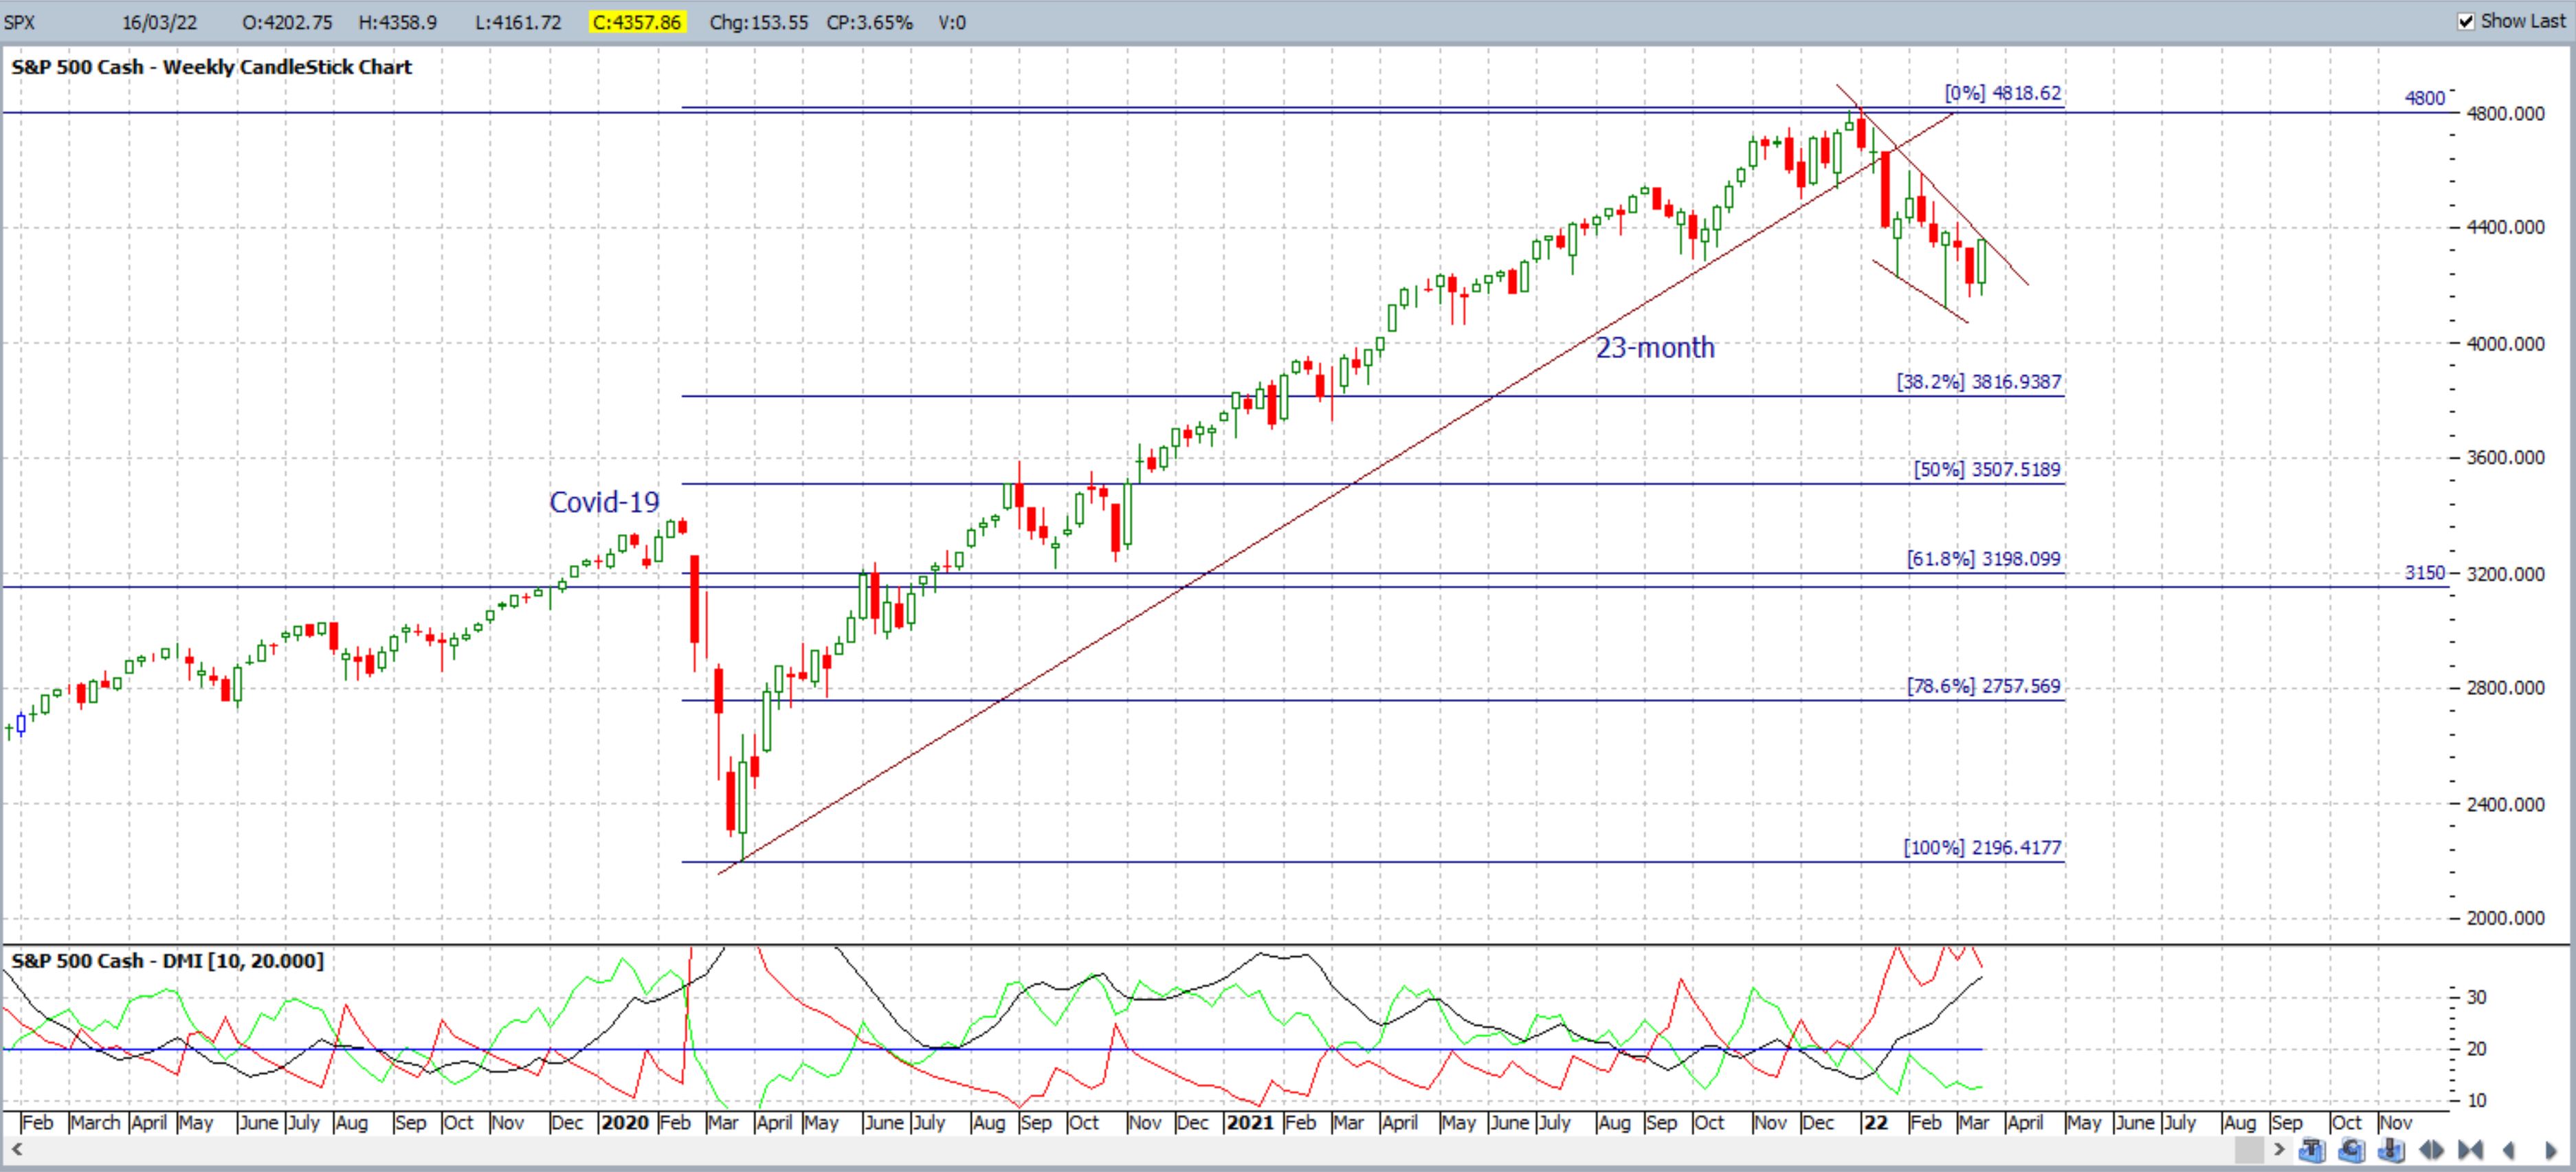
S&P500 weekly: the pullback on the S&P500 index is creating the look of a bullish-continuation Bull Flag pattern. Examples of these breakout patterns can be viewed through the following link.
Traders should watch for any Flag trend line breakout that is supported by ADX momentum:
- Bullish Flag Breakout: ADX and +DMI >20.
- Bearish Flag Breakout: ADX and -DMI >20.
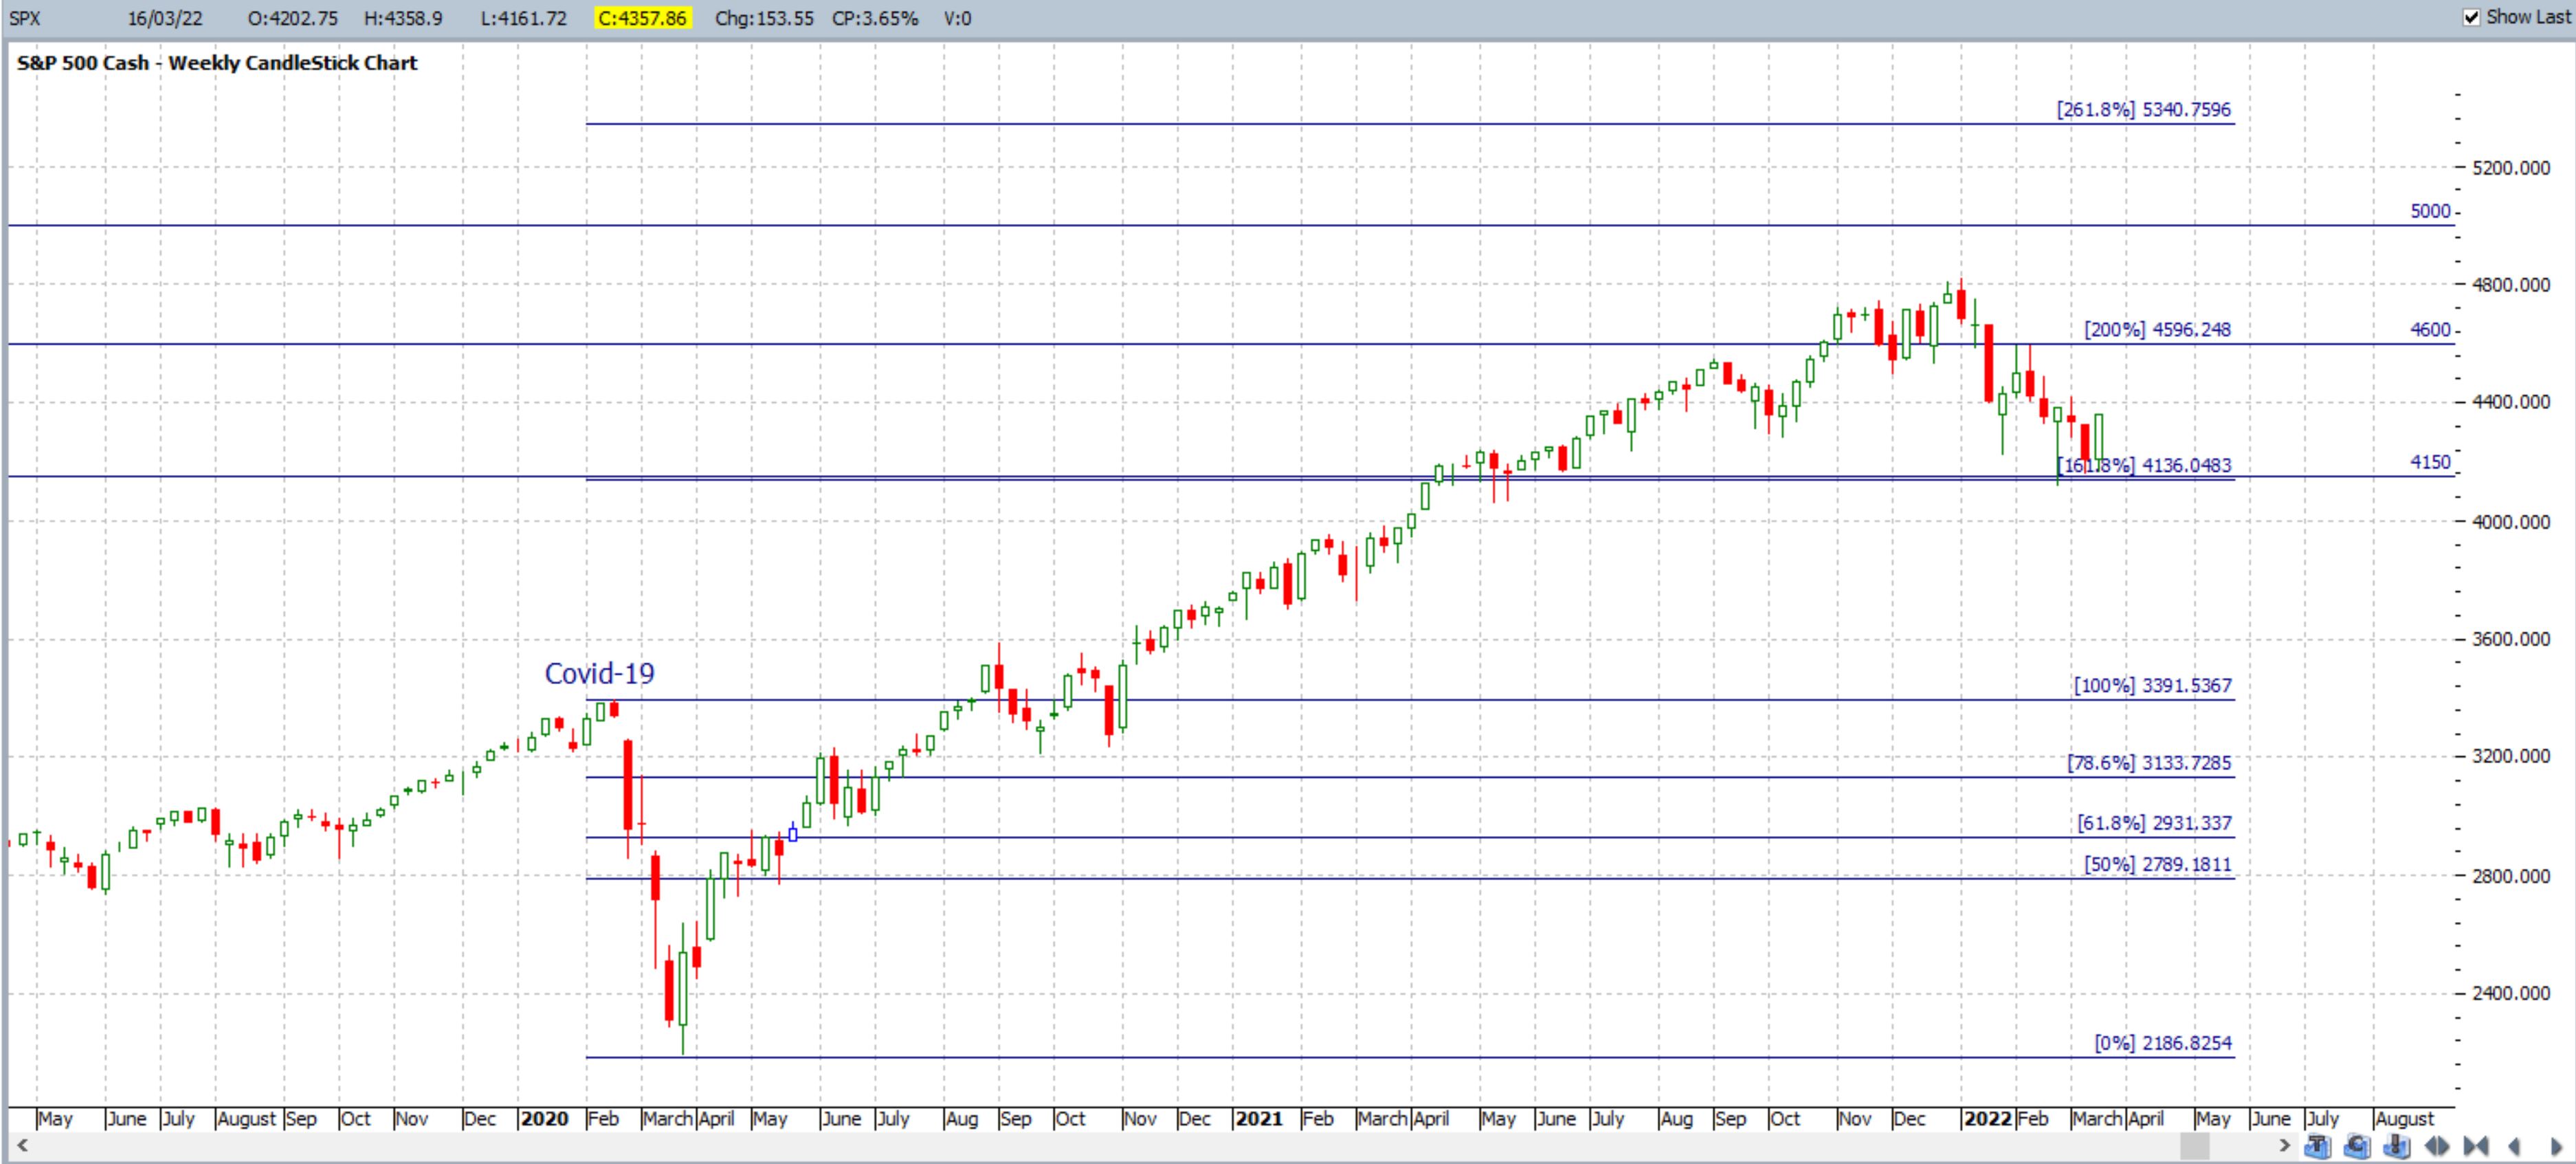
S&P500 weekly + Fibonacci extension: note how price action pulled back but is currently holding above the key 4,150 region which is the 200% Fibonacci extension of the Covid-19 swing Low move. Traders should watch for any potential of continued Support from this region:
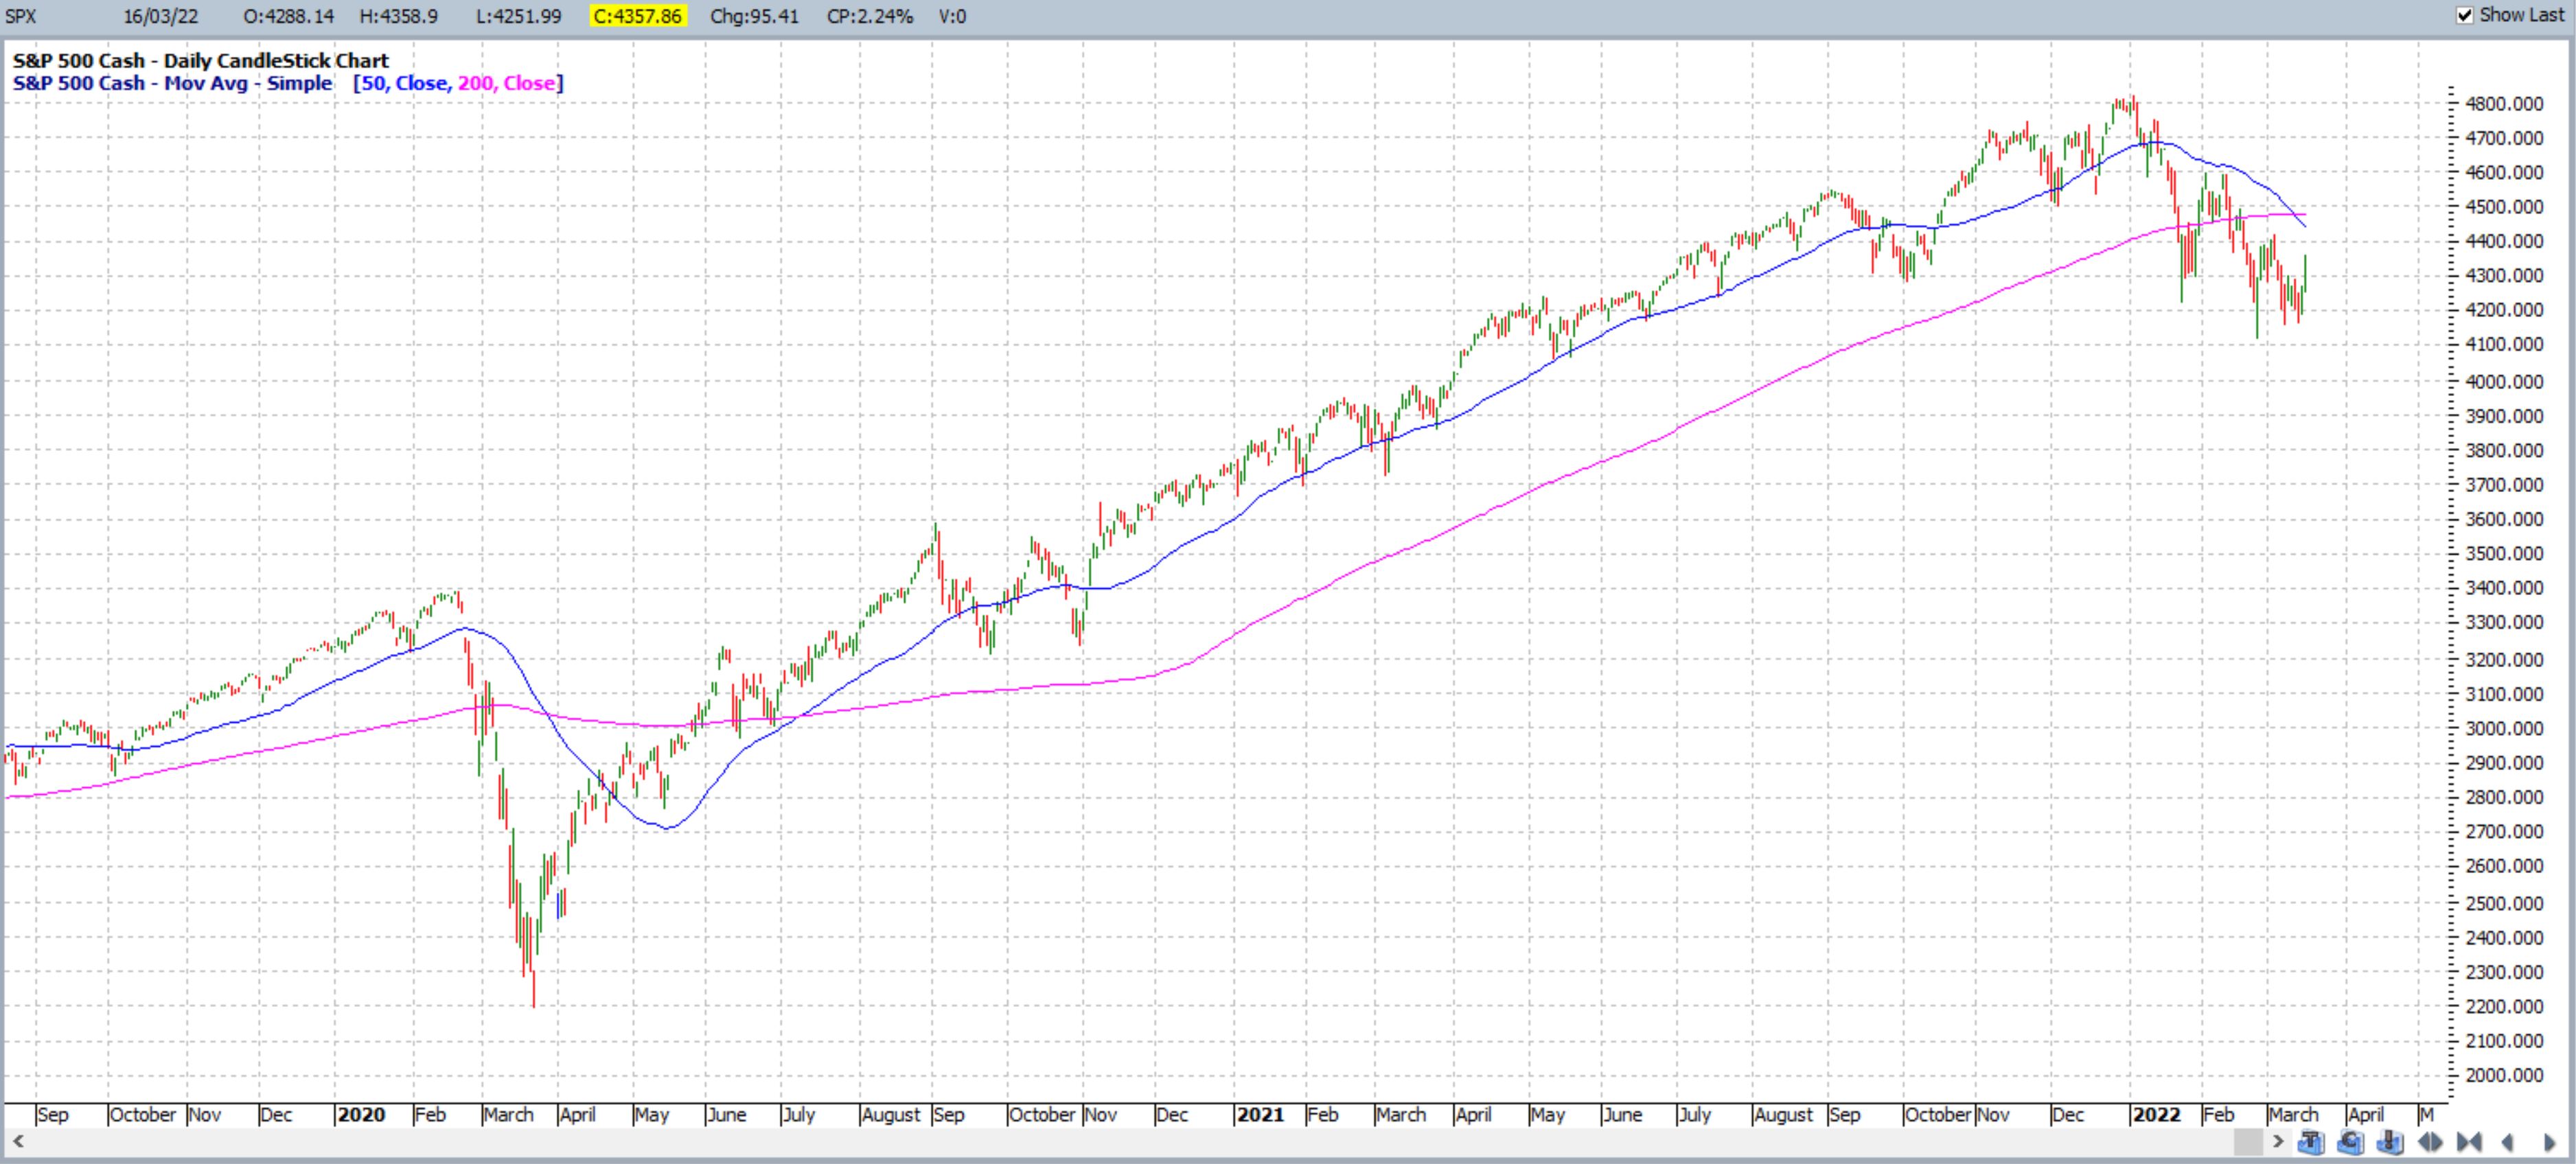
S&P500 daily + Death Cross: this bearish pullback has triggered a recent Death Cross. Traders should watch for any new bullish Golden Cross.
DJIA
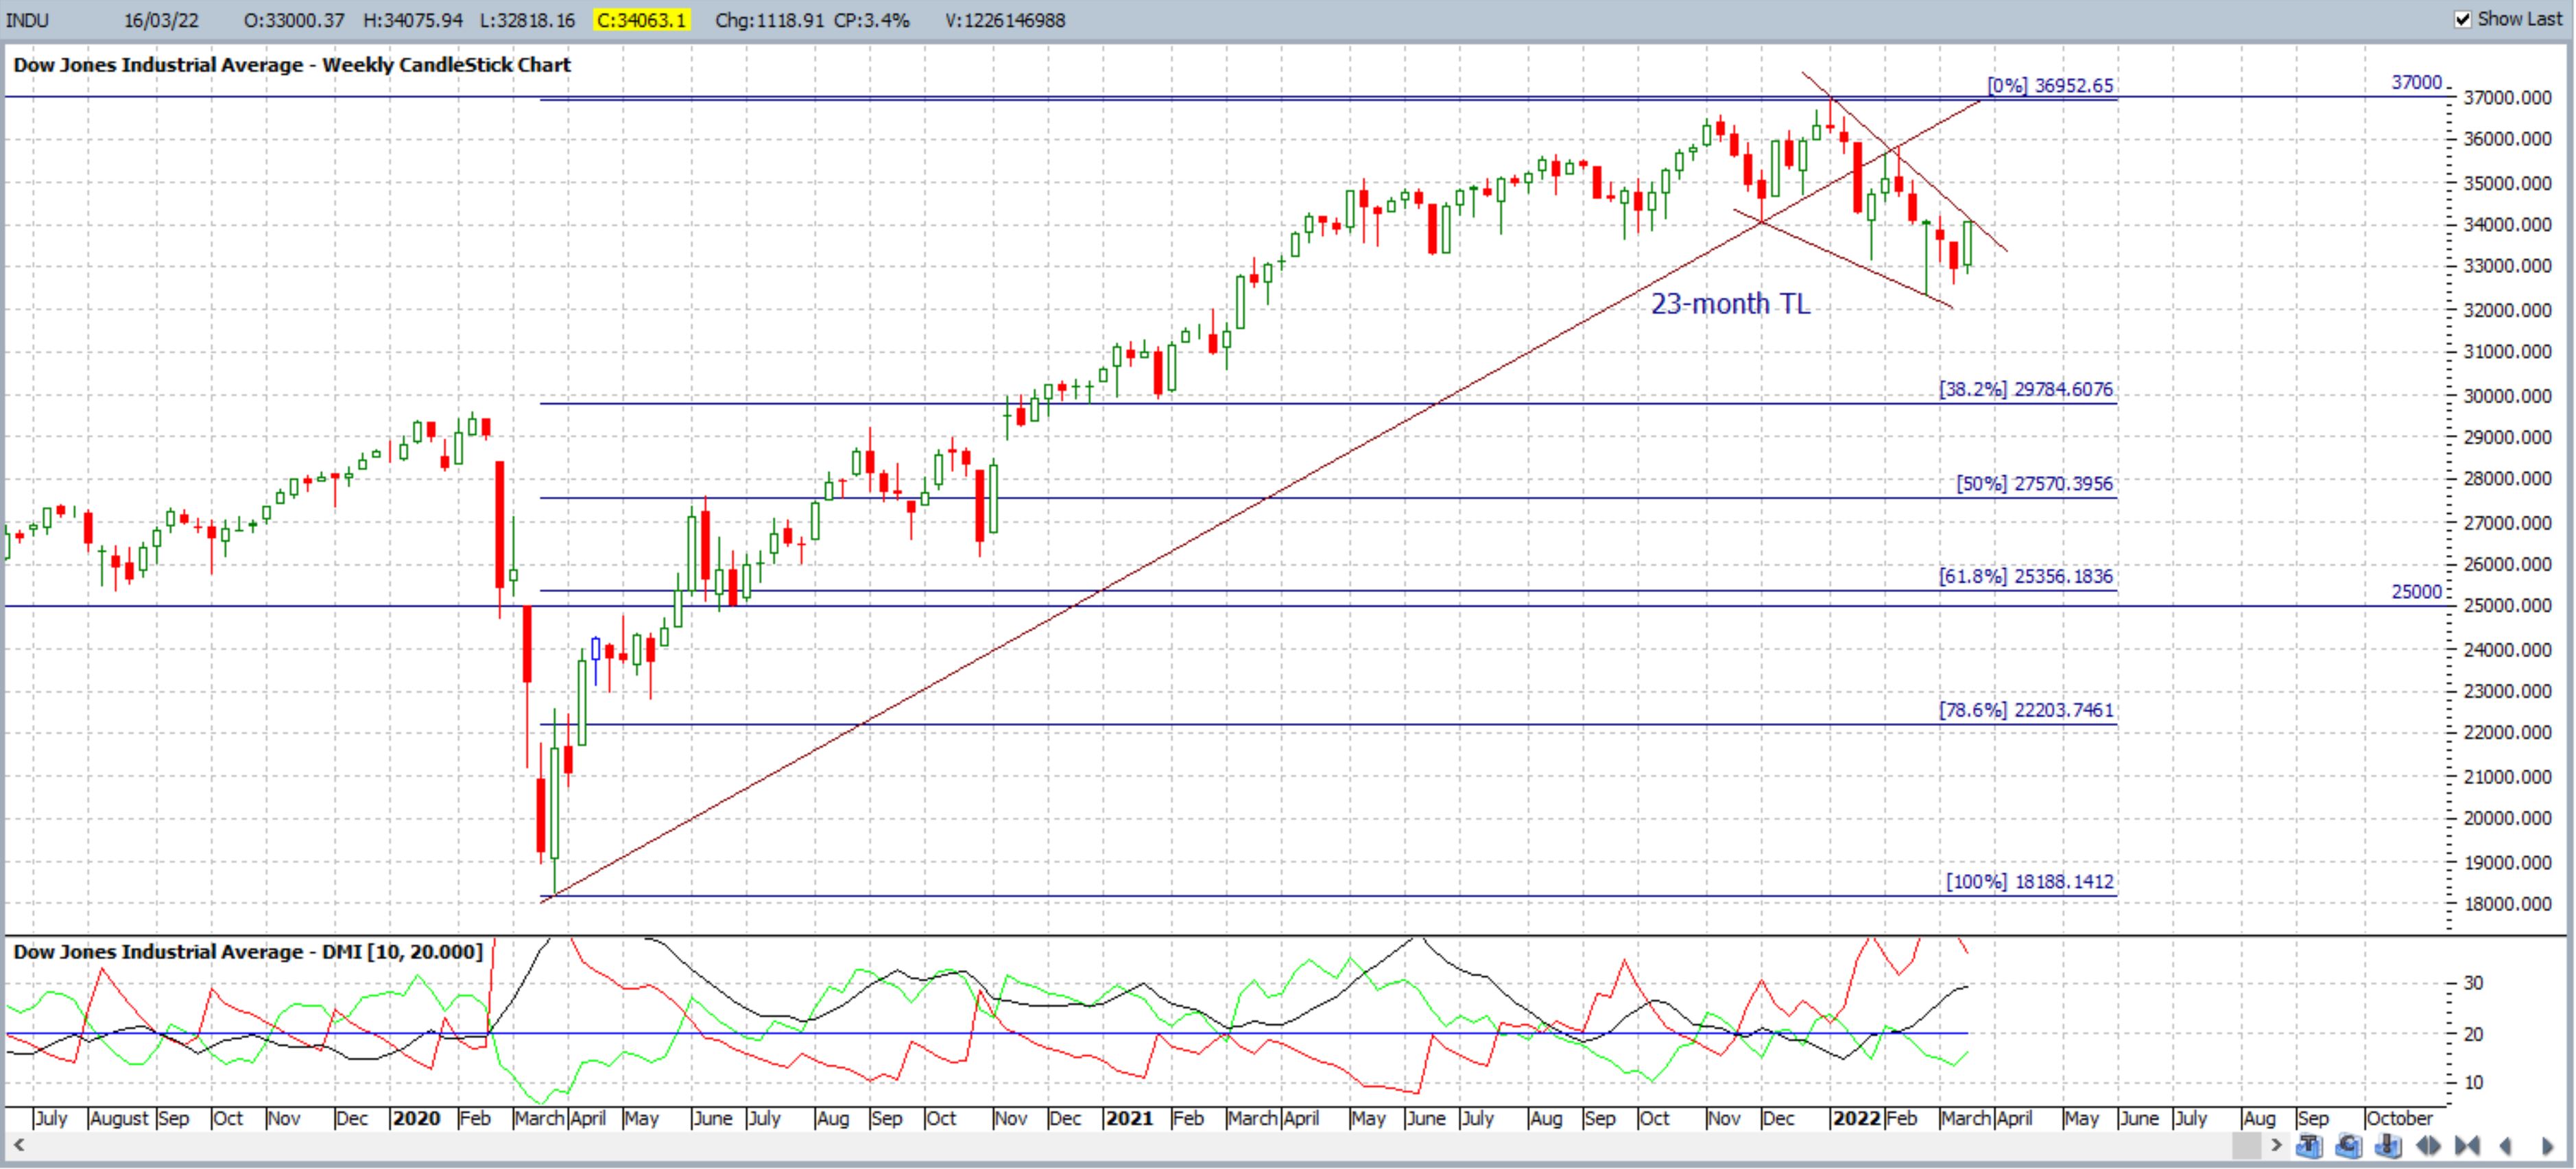
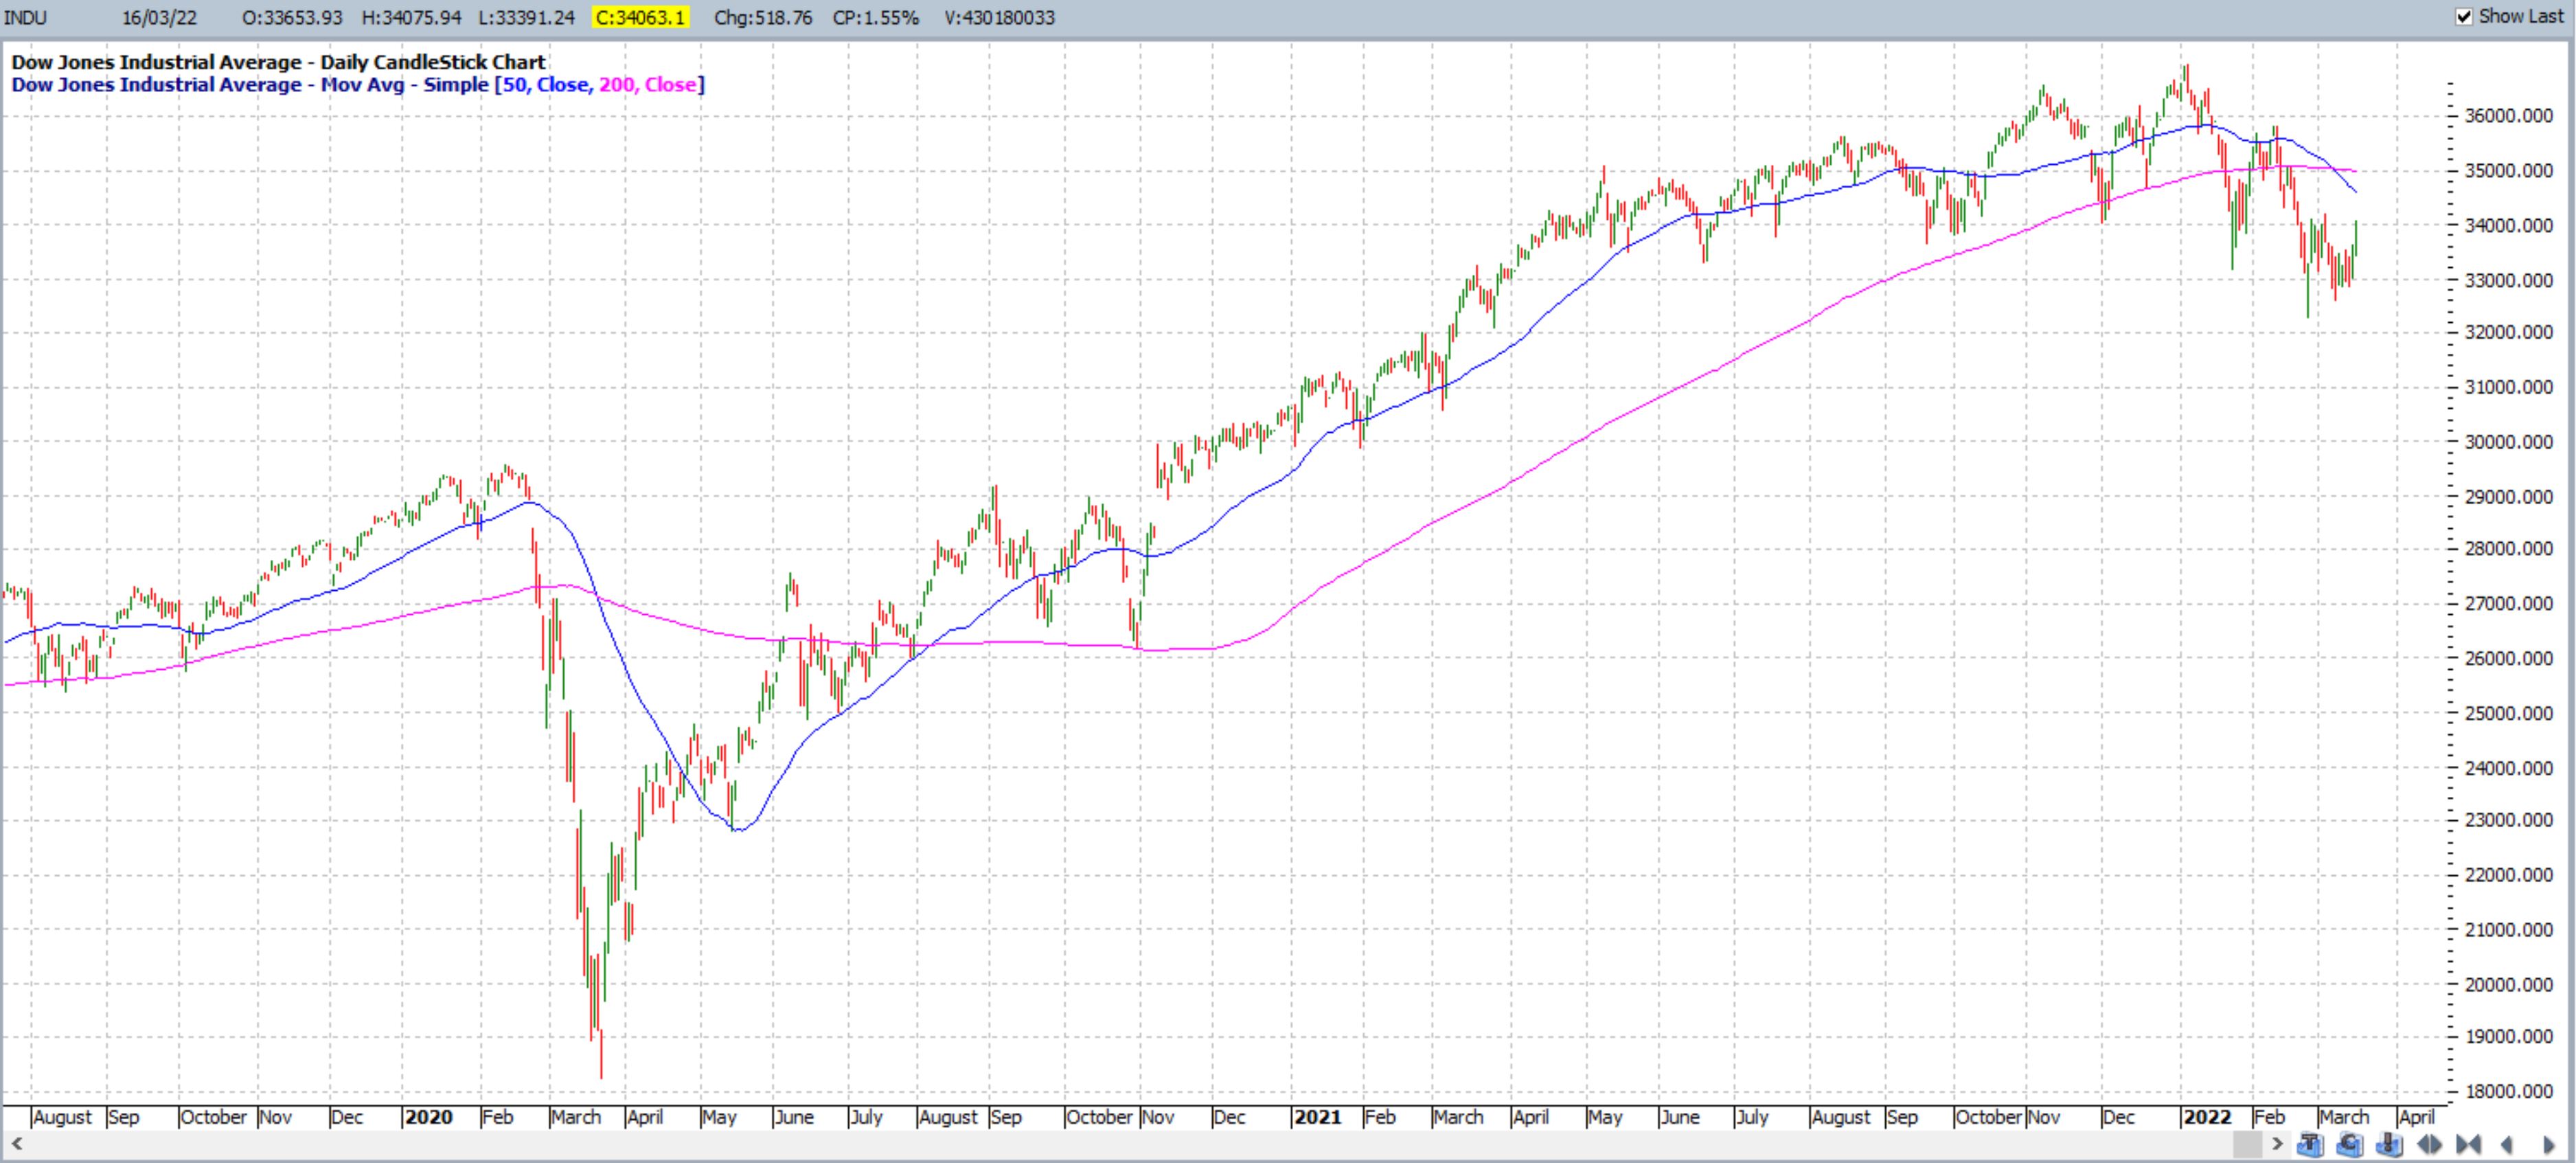
DJIA weekly: as with the S&P500, the pullback on the DJIA index is creating the look of a bullish-continuation Bull Flag pattern. Traders should watch for any Flag trend line breakout that is supported by ADX momentum:
- Bullish Flag Breakout: ADX and +DMI >20.
- Bearish Flag Breakout: ADX and -DMI >20.
DJIA daily + Death Cross: this bearish pullback has triggered a recent Death Cross. Traders should watch for any new bullish Golden Cross.
NASDAQ
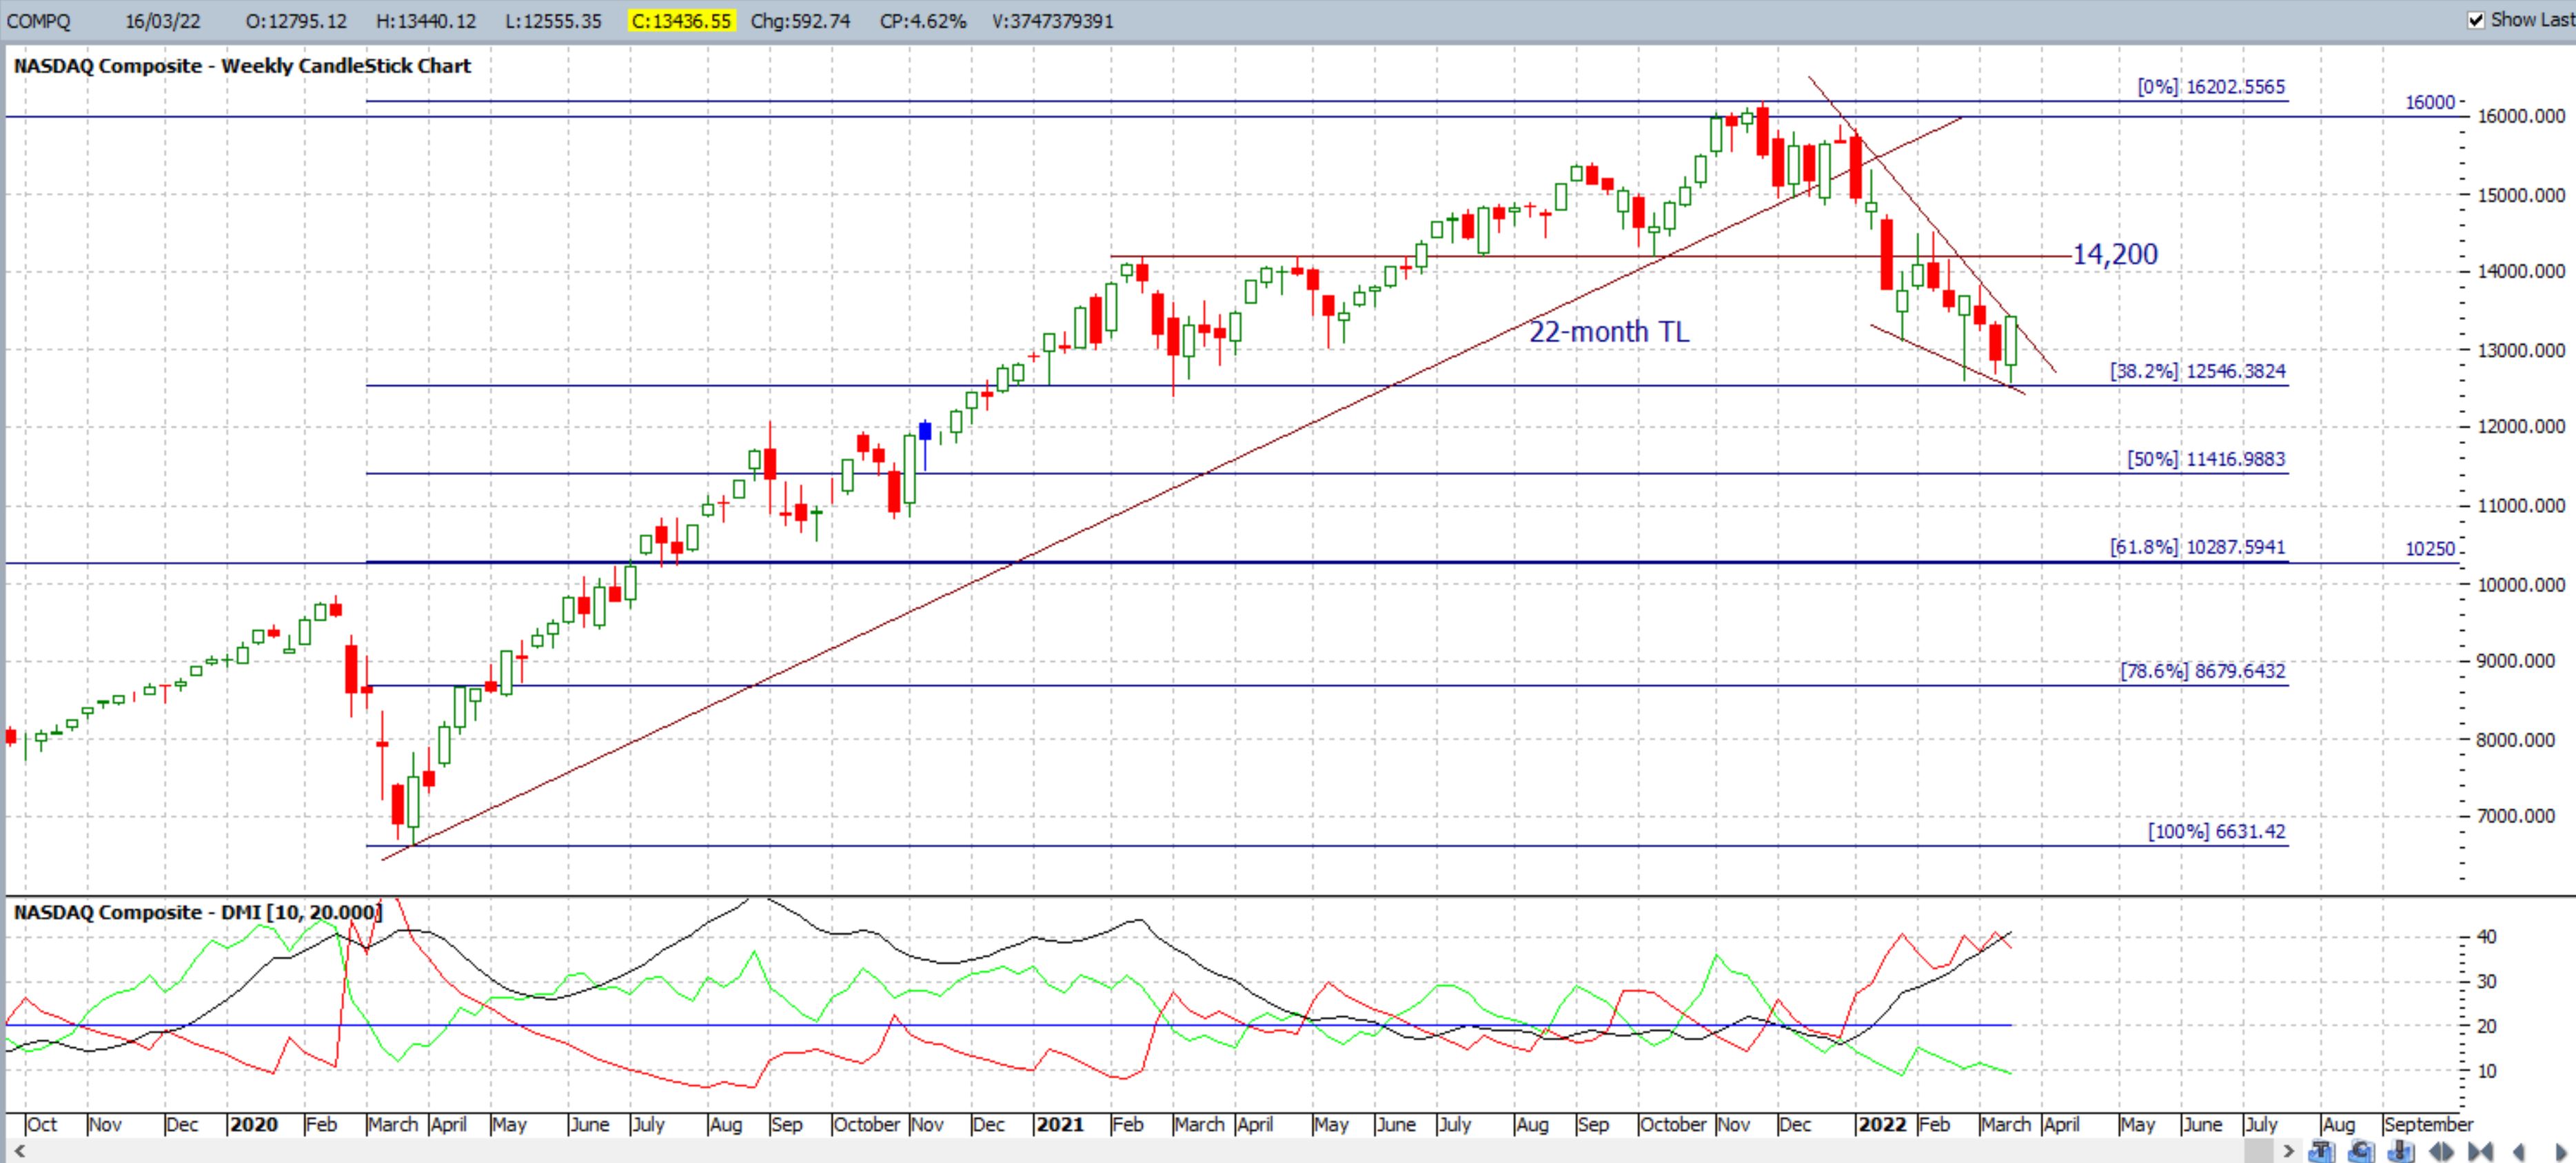
NASDAQ weekly: as with the S&P500 and DJIA, the pullback on the NASDAQ index is creating the look of a bullish-continuation Bull Flag pattern. Traders should watch for any Flag trend line breakout that is supported by ADX momentum:
- Bullish Flag Breakout: ADX and +DMI >20.
- Bearish Flag Breakout: ADX and -DMI >20.
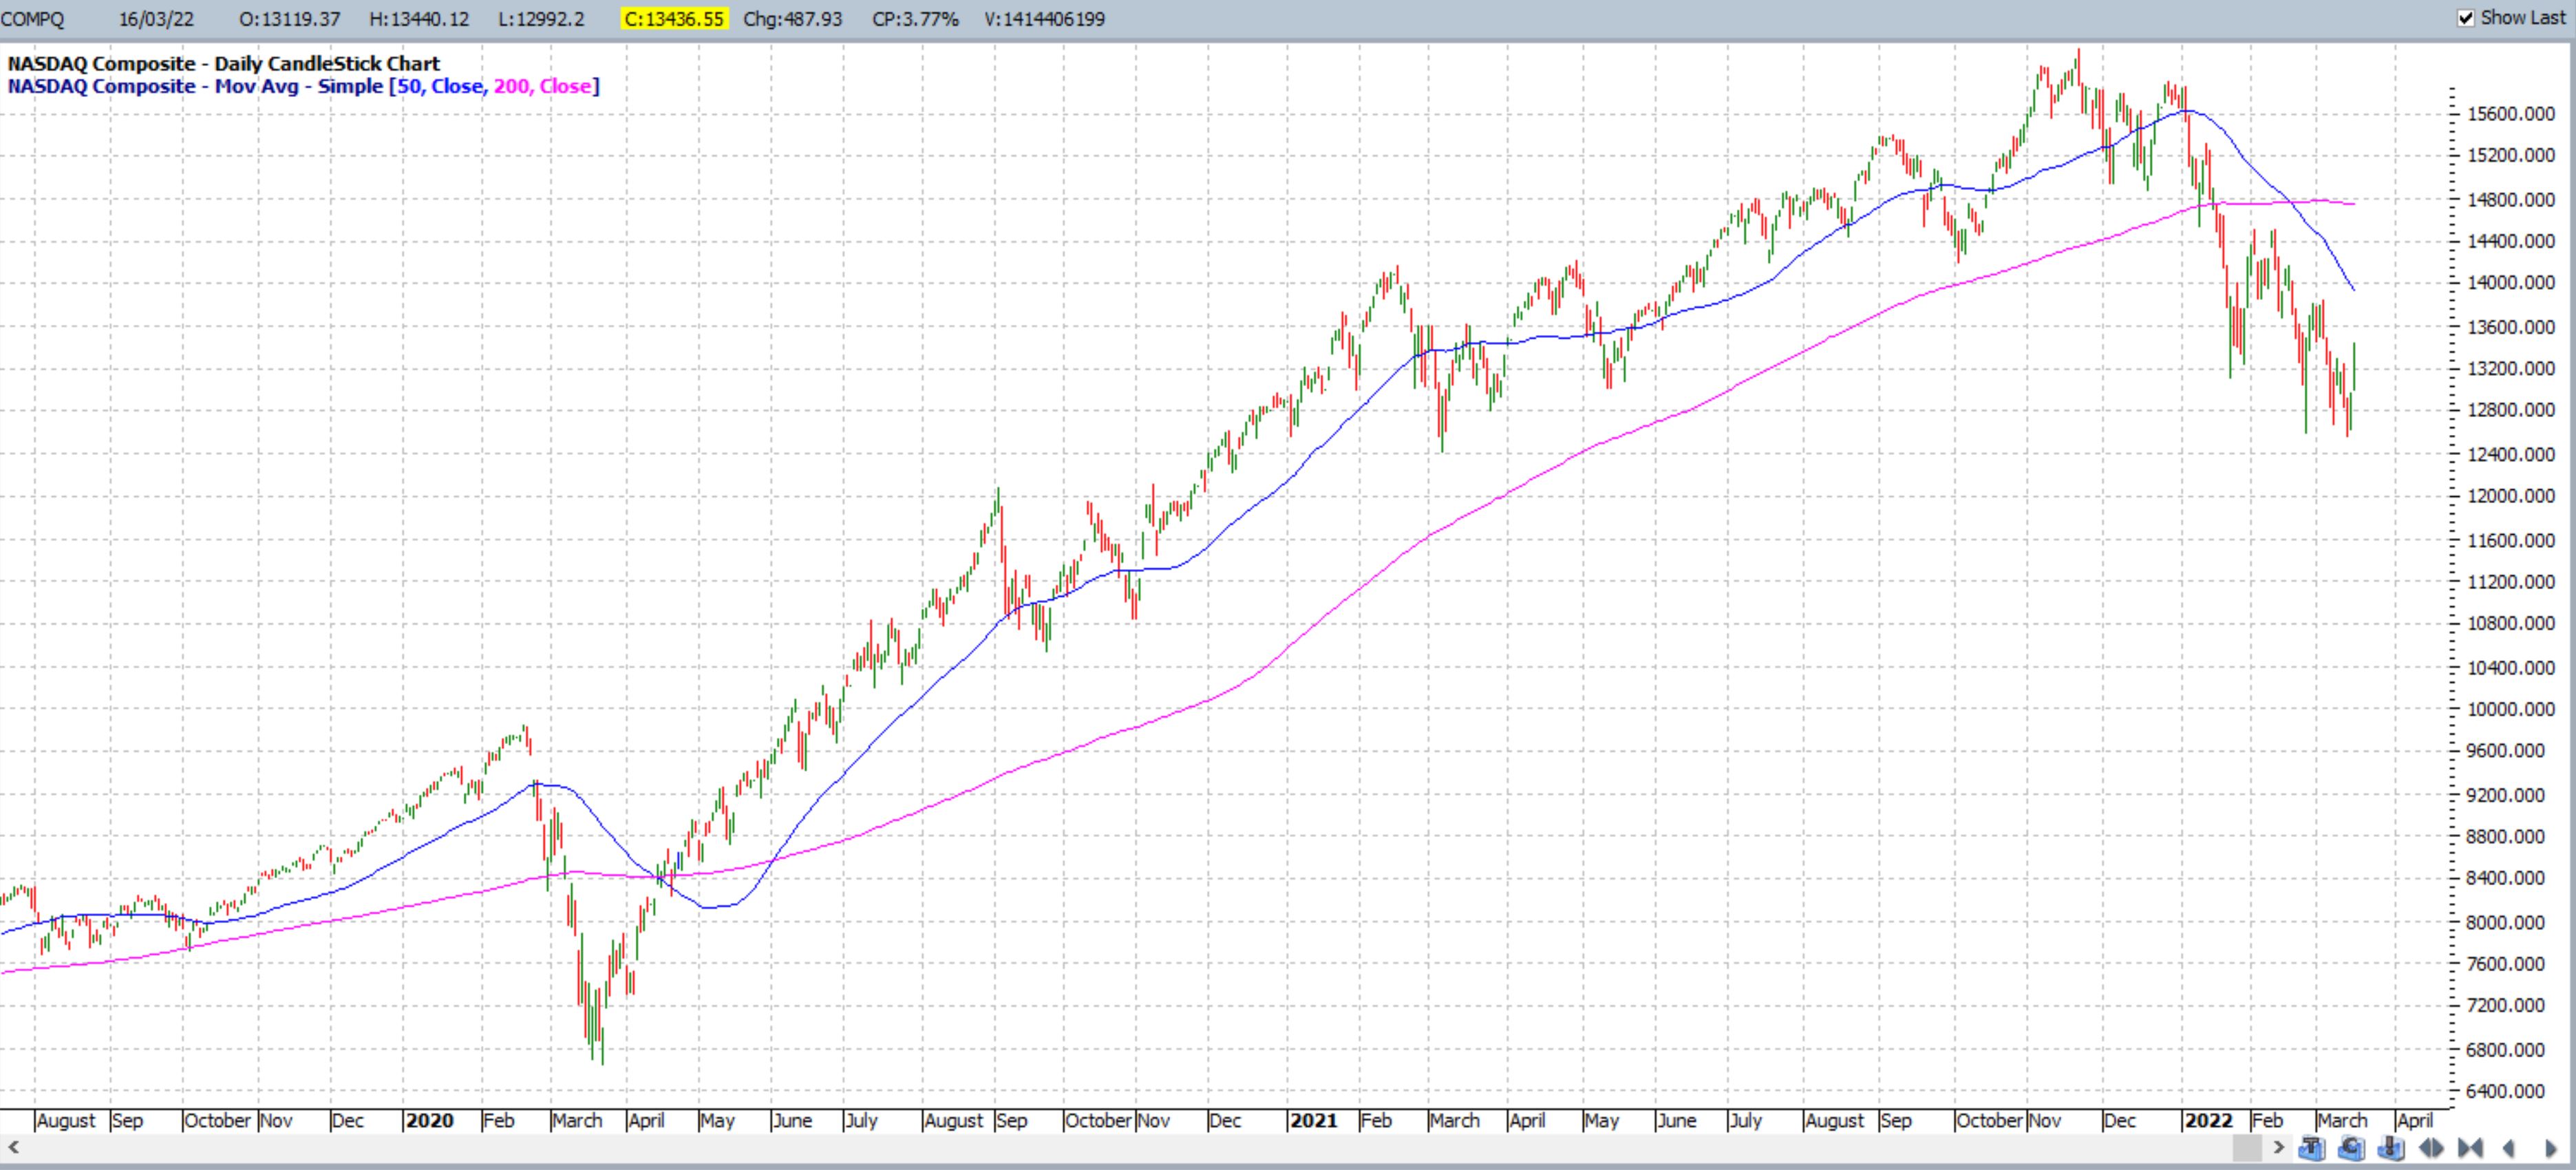
NASDAQ daily + Death Cross: this bearish pullback has triggered a recent Death Cross. Traders should watch for any new bullish Golden Cross.
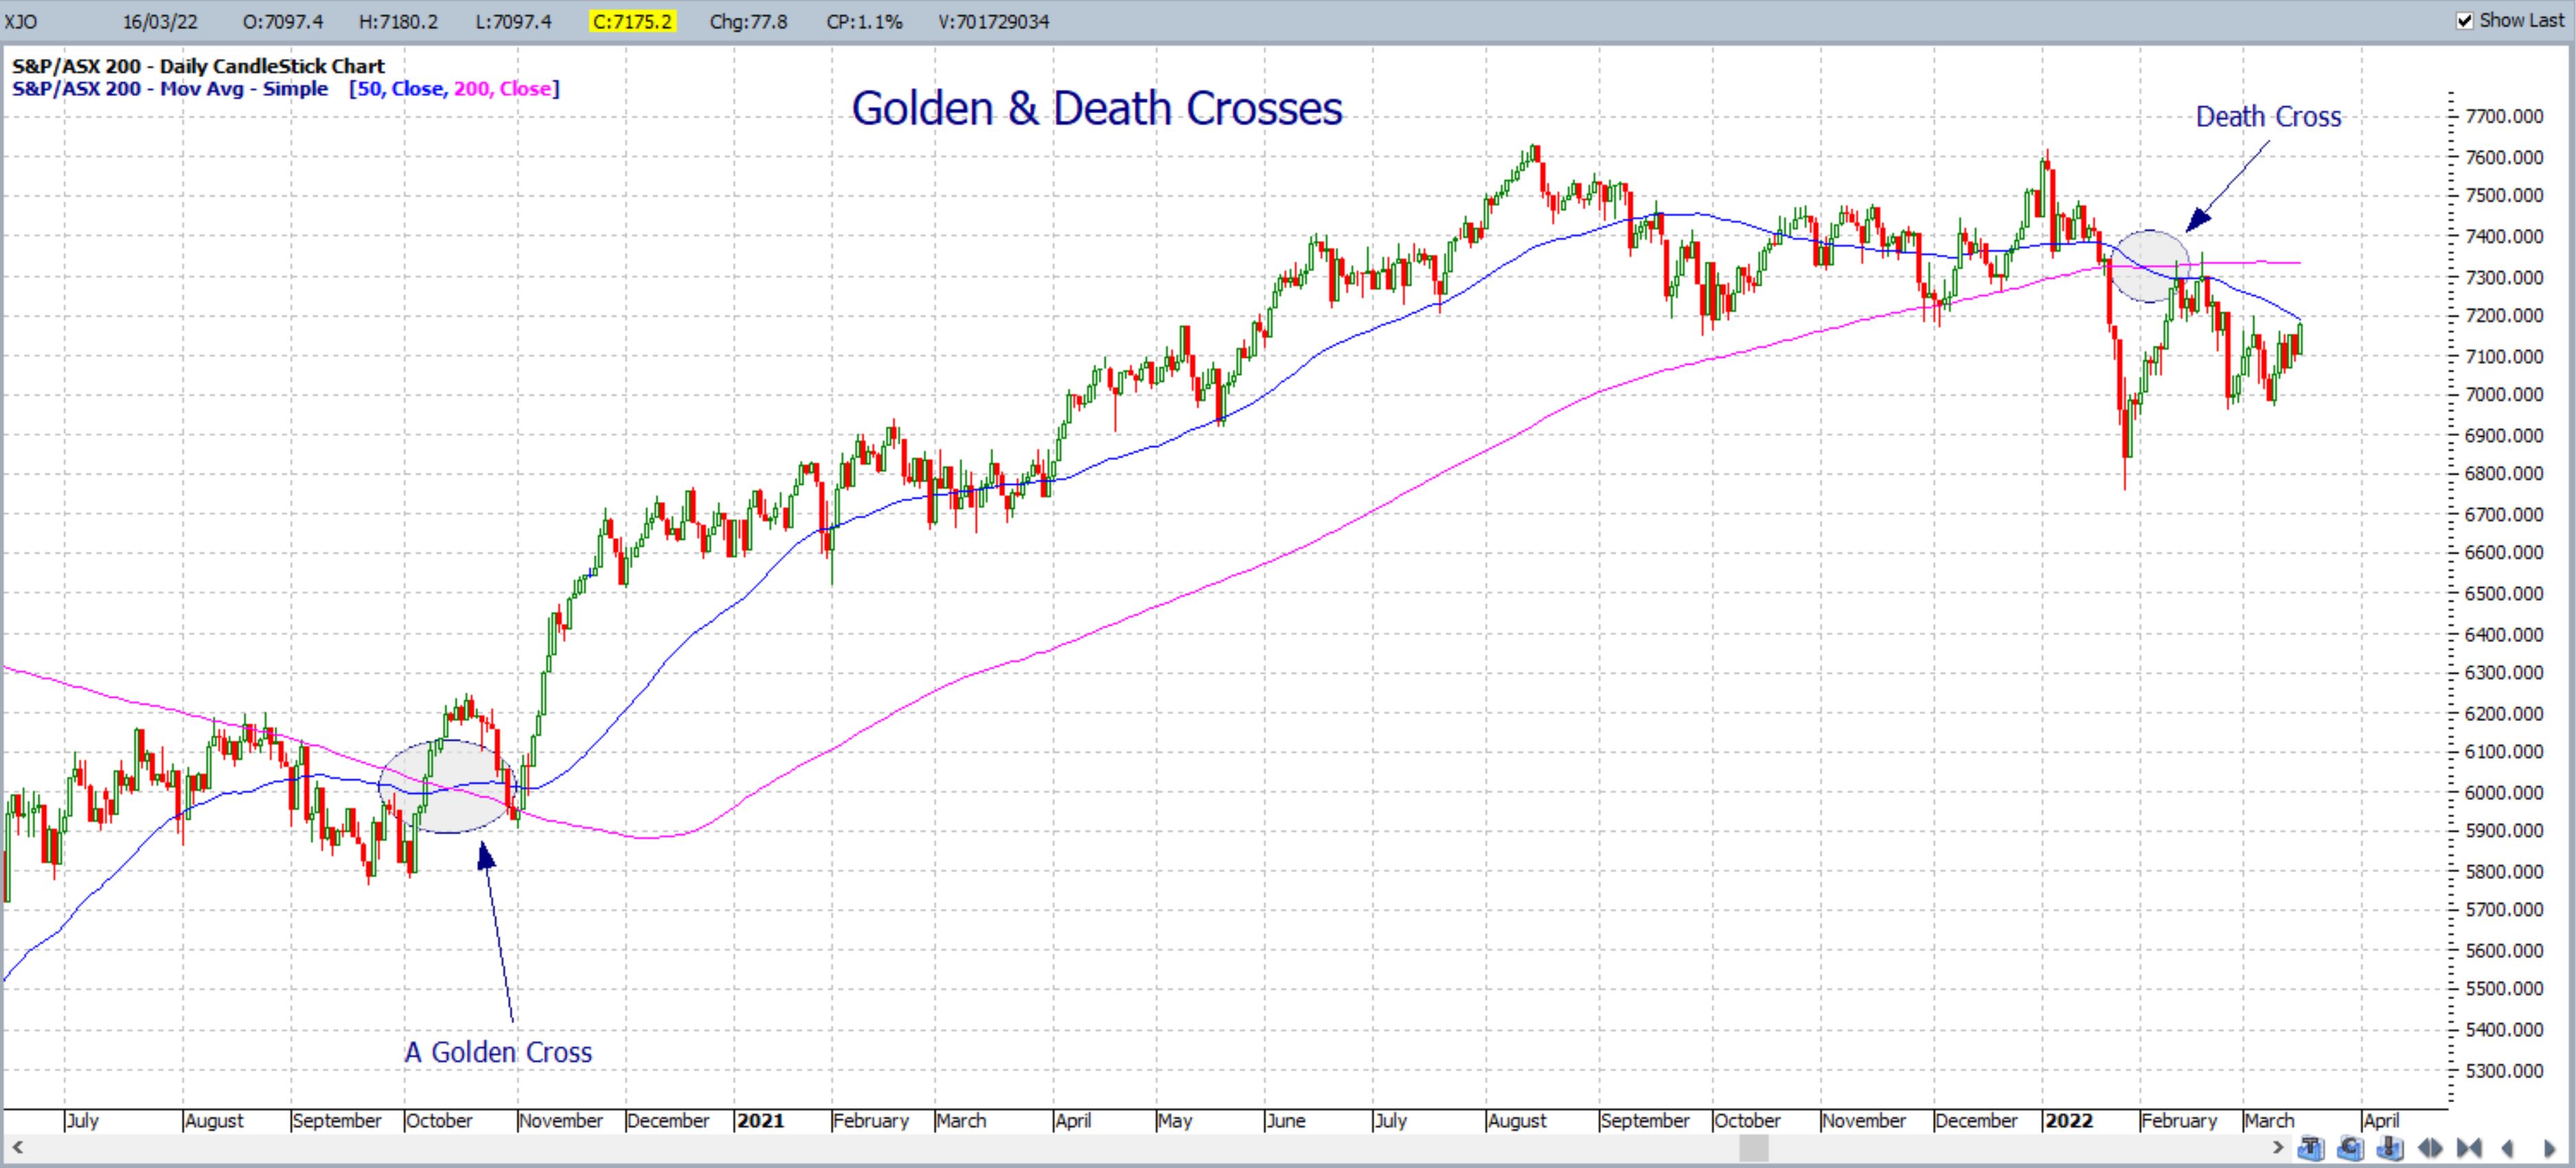
XJO
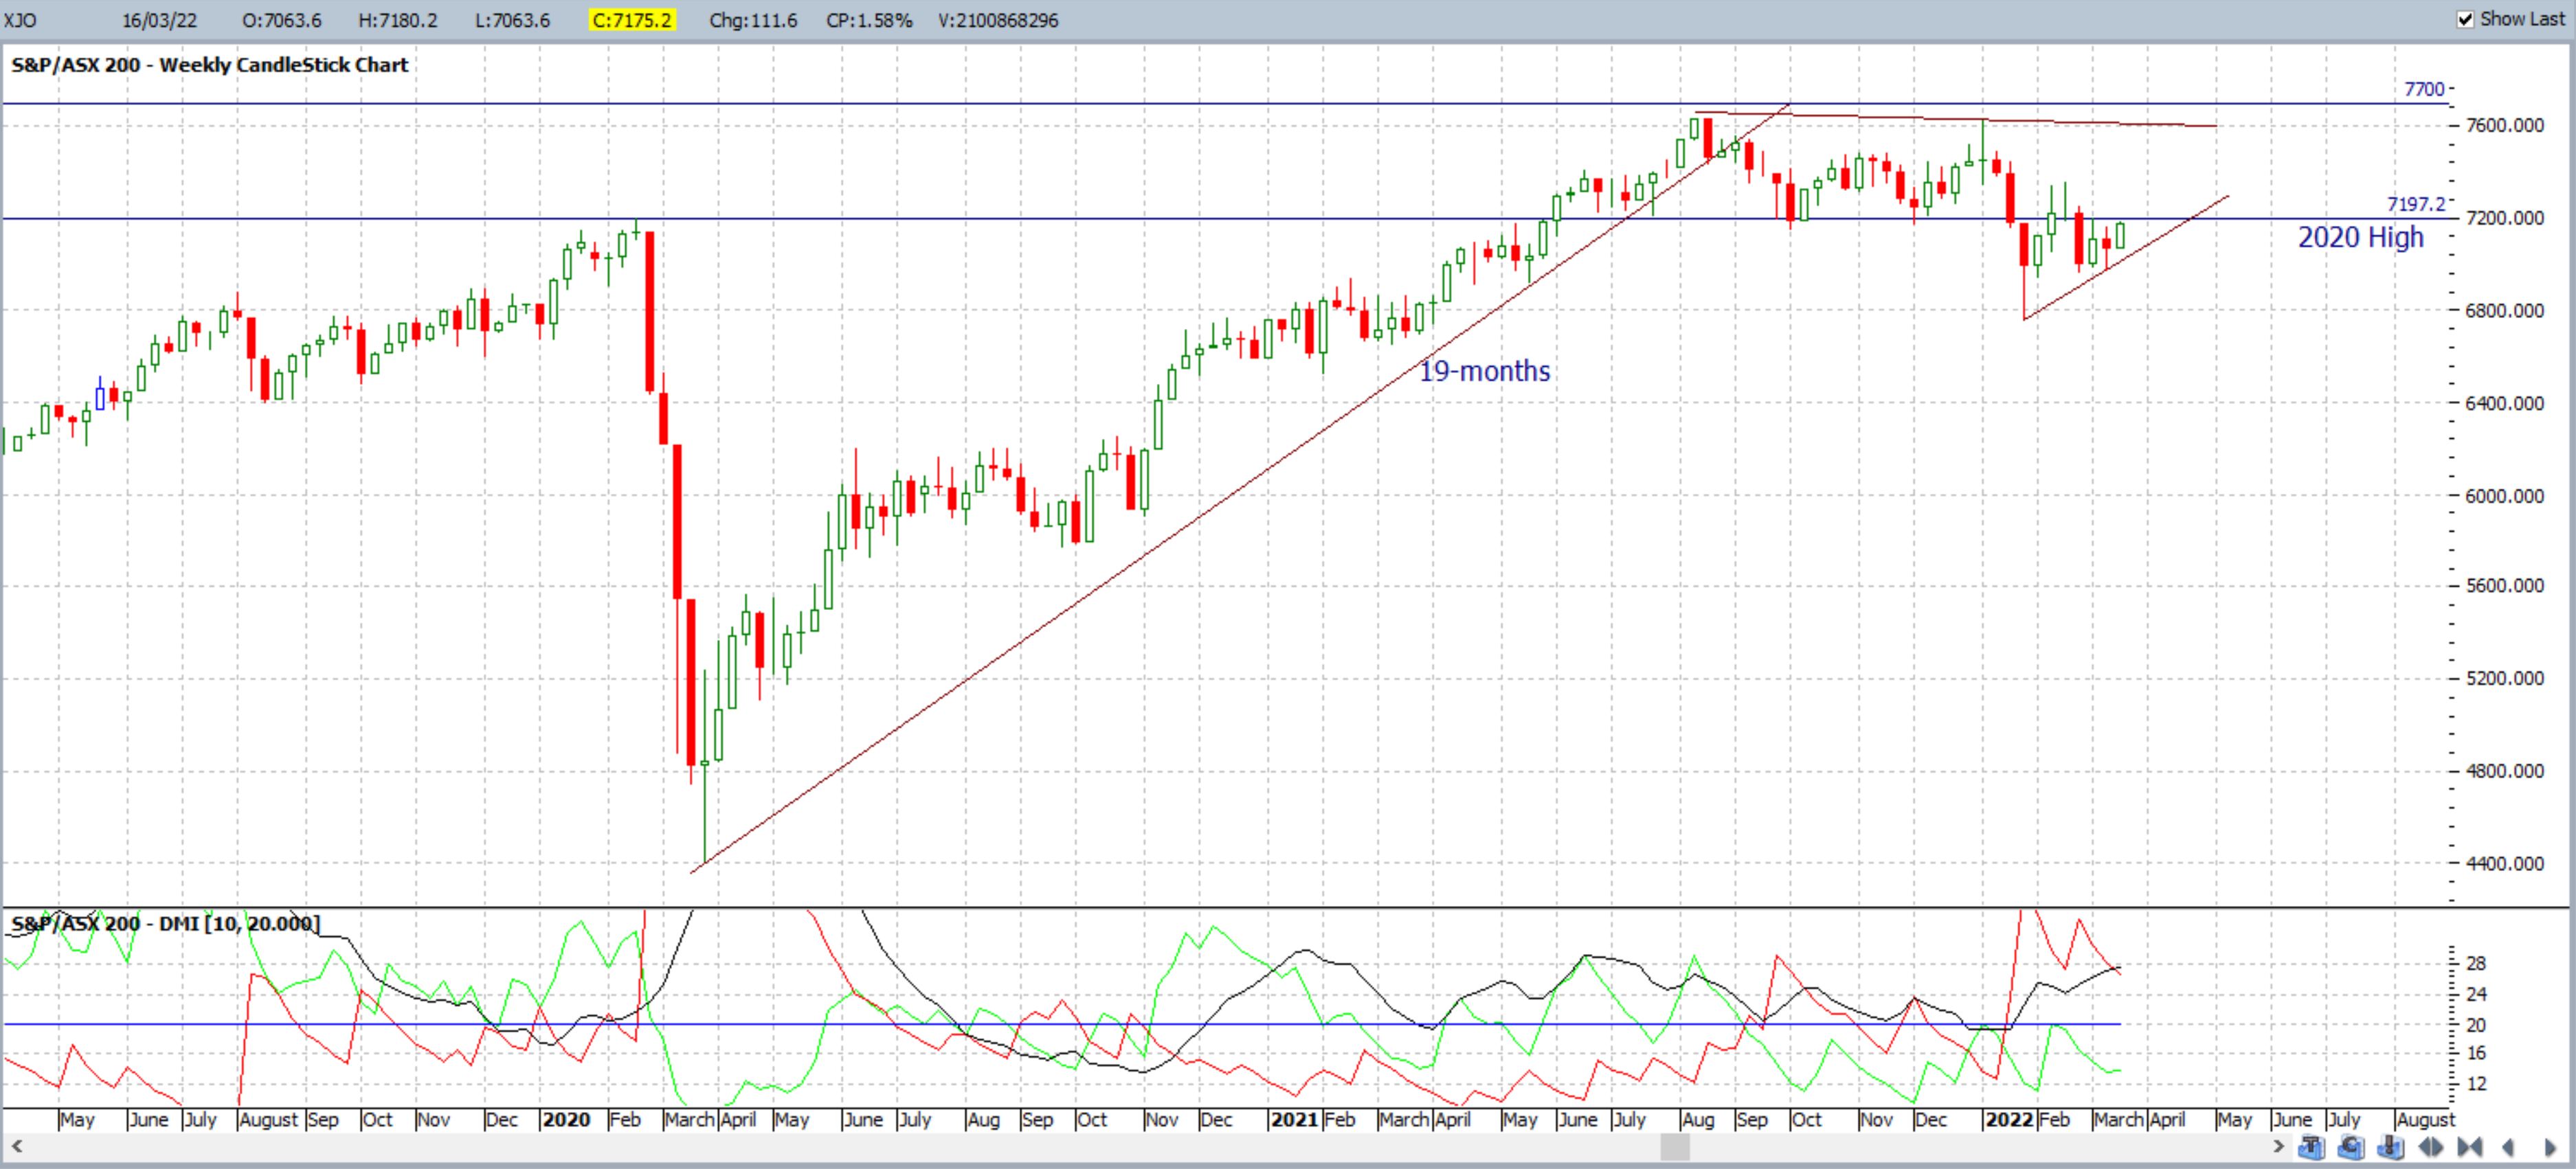
XJO weekly: the pullback on the ASX-200 index is not shaping up in a clear-cut Bull Flag, as evident on the S&P500, DJIA and NASDAQ. However, consolidation is evident around the 7,200 level which is a level I have been stressing for many months as being a key one to watch. This is because 7,200 is the whole-number level nearest to the Pre-Covid-19 all time High region and, as previous Resistance, it continues to be tested to see if it might evolve into new Support.
XJO daily + Death Cross: this bearish pullback has triggered a recent Death Cross. Traders should watch for any new bullish Golden Cross.
Final thoughts:
There is little to be optimistic about at the moment with the war in Ukraine and the recent stock market sell-off is reflecting this sentiment. The pullback on the charts of all four stock market indices show bearish Death Crosses in play. However, the pullback on the S&P500, DJIA and NASDAQ could be viewed as simple consolidation shaping up within potential Bull Flags. I would advise that all traders keep an open mind and watch for momentum-based trend line breakouts; either up or down. Remember to trade what you see and not what you think.