


Irrespective of fundamental events, the S&P500 was due a pull back. The index had rallied, essentially unabated, for almost 2 years! Actually, for 22 months to be precise; from Nov 2012 to Sept 2014.
S&P500 daily: showing how the daily support trend line had been intact for 22 months from Nov 2012 to Sept 2014:
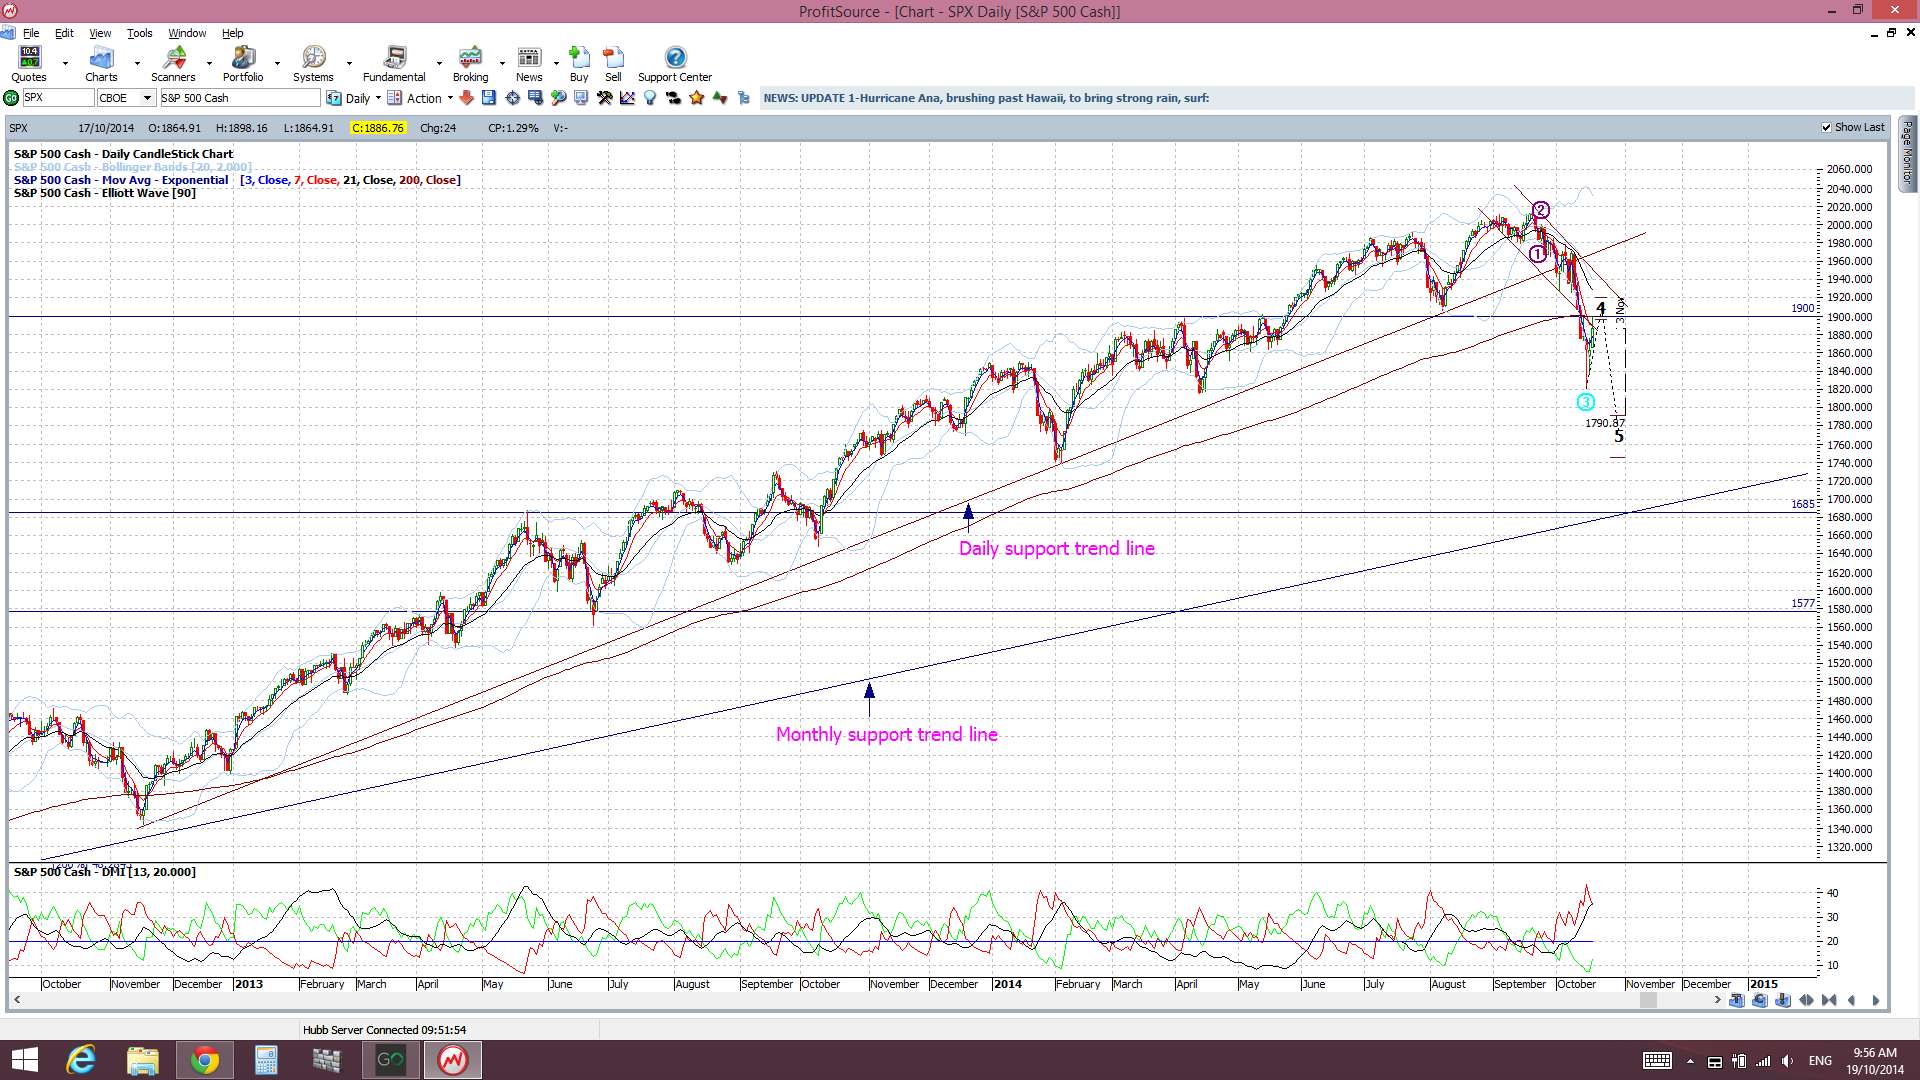
Last week I had mentioned that I was looking for any breakout from the ‘Flag’ pattern and for a hold of the 1,900 level. It was quite a volatile week for stocks and, despite the recovery towards the end of the week, the index still ended up below the ‘Flag’ and below 1,900 support. The close below 1,900 is bearish and I will be on the lookout for any bearish continuation. The monthly candle doesn’t close for another 2 weeks but any monthly close below 1,900 would add further bearish sentiment to the index. It’s not all bad news though as I do see any further pull back as just another integral part of an overall bullish move for the S&P500. I will explain my thinking below.
For months now I have been posting articles about the S&P500 and DJIA where I have been using technical patterns to extrapolate potential bullish targets for these indices. The first of these articles is available through this link. A subsequent article is available through this link. Essentially, I’m seeing the 2,500 level as an ultimate bullish target for the S&P500:
S&P500 monthly: The Elliott Wave indicator and my technical calculation are fairly consistent with a target for 2,500:
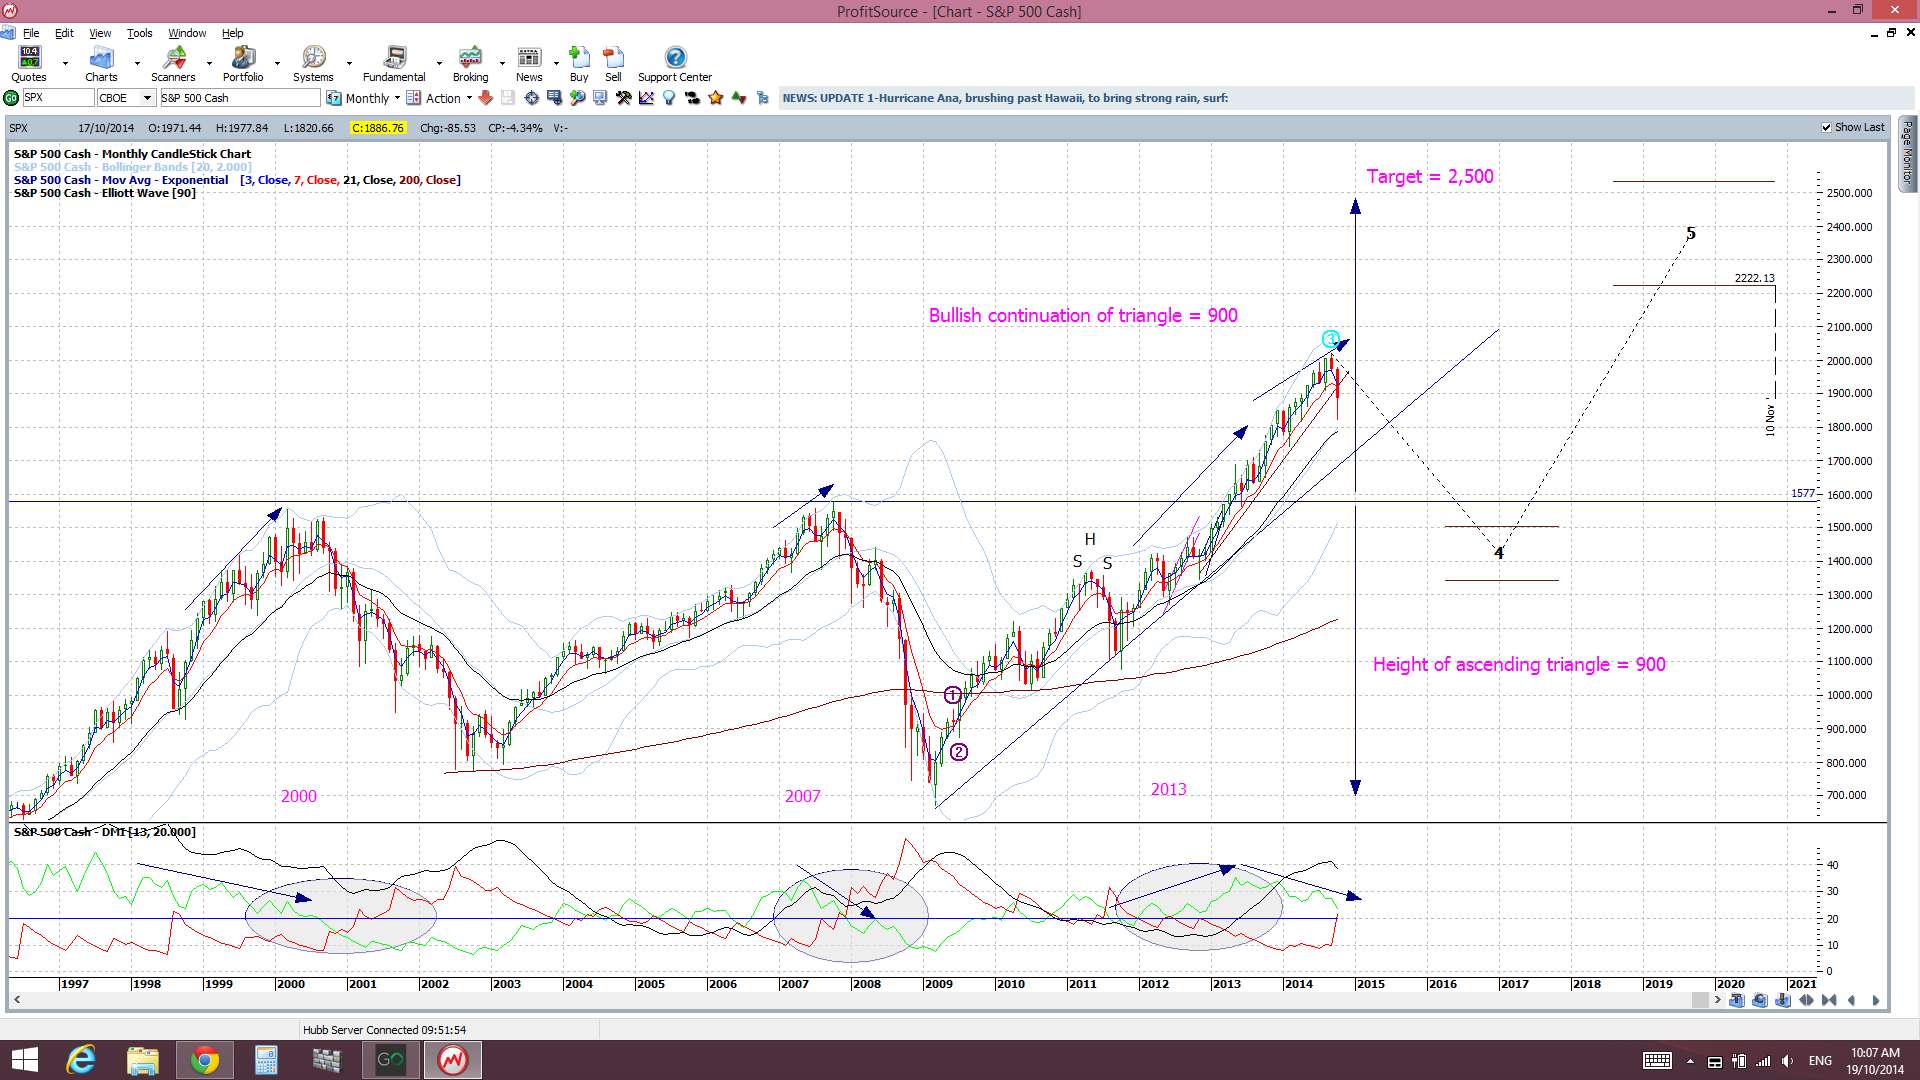
The S&P500 made a bullish break above the previous high of 1,577 back in April 2013. Since then, I have been looking and hoping for a pull back to test this key breakout level. Until recently, with the regular drip feed of upbeat US data, I had not been able to imagine any significantly serious global event(s) that could result in such a deep pull back. Now, however, with growing global concern over issues such as global economic growth, Ebola, events in the Ukraine, the situation with IS in the Middle East and political unrest in Hong Kong to name just a few, I am starting to see these events as potentially creating the perfect storm to bring about the necessary pull back on the S&P500. I say ‘necessary‘ as I can’t really see the bullish target of 2,500 being accessed without the index first having a decent pull back. It is my belief that the S&P500 needs a deeper pull back, hopefully back down to test the 1,577, so as to adequately underpin a decent bullish attempt at the 2,500 level.
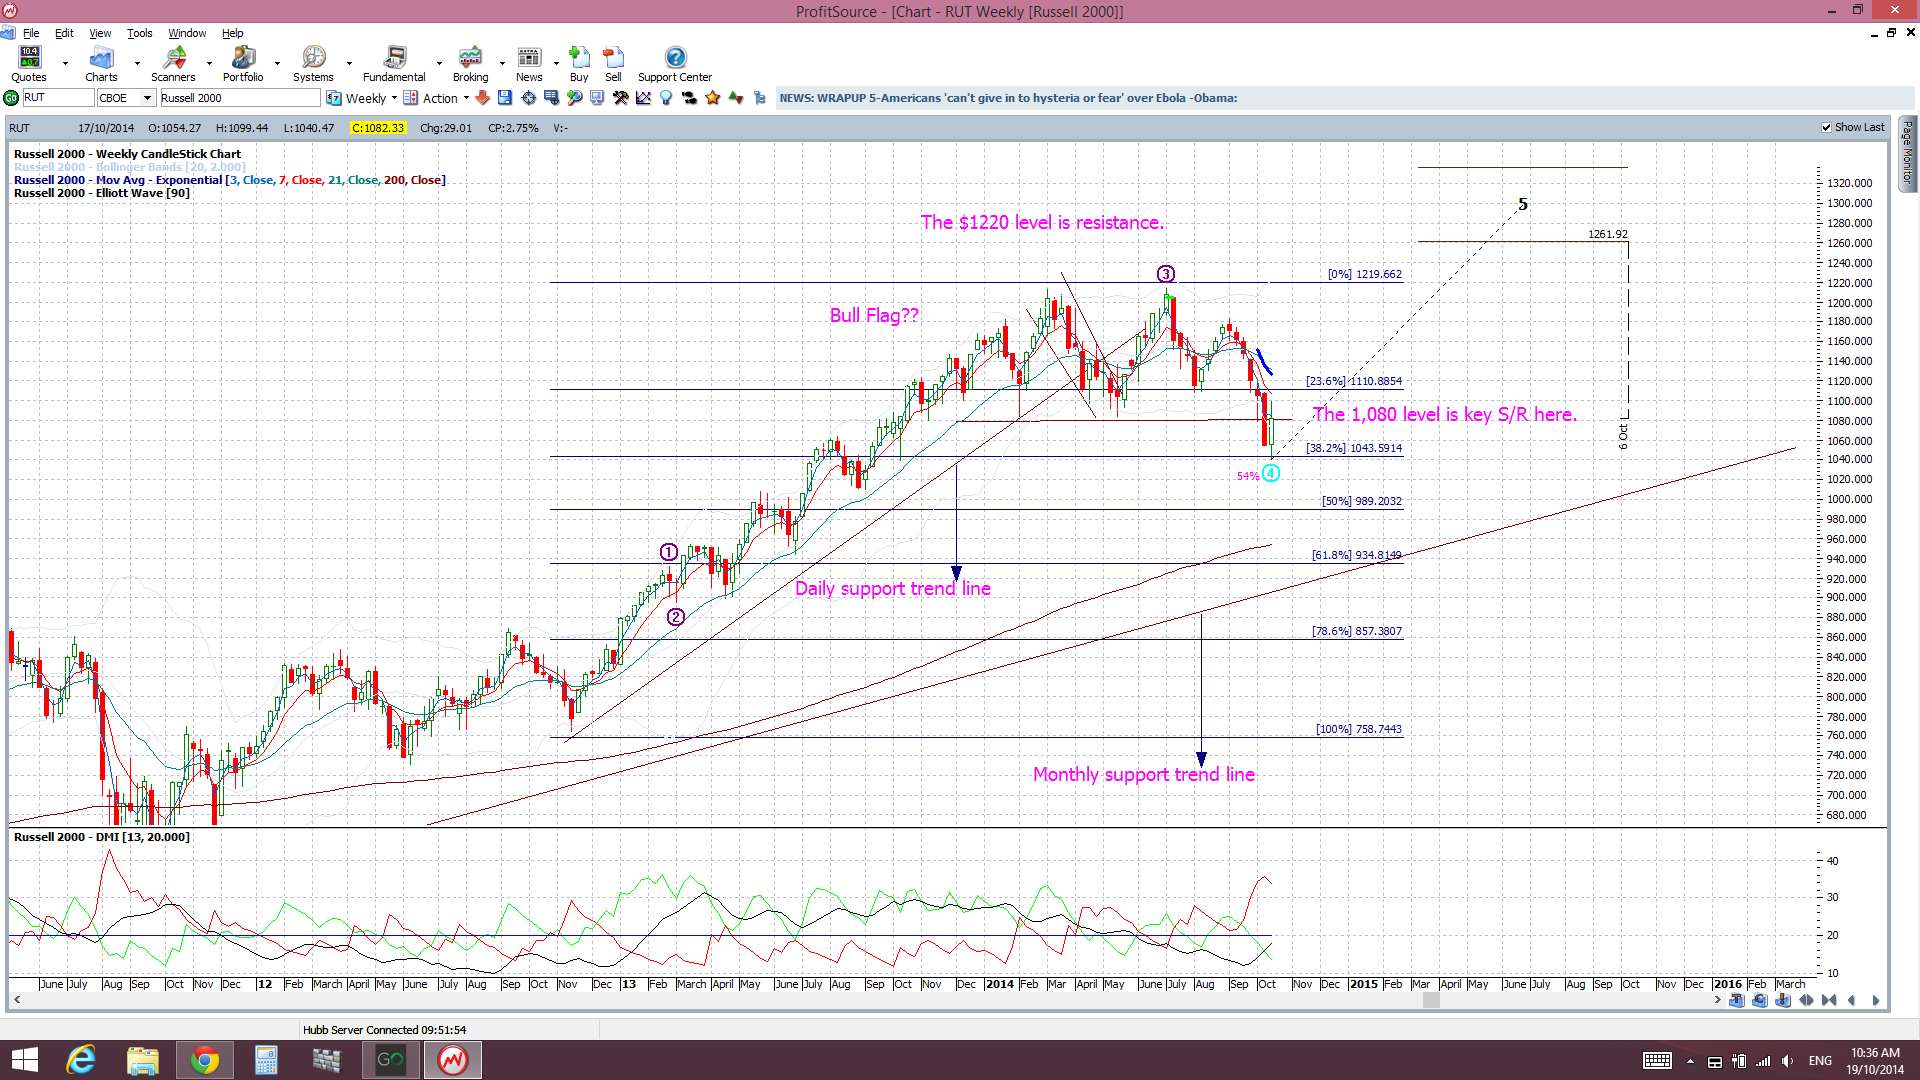
Will the S&P500 get down there though? The recent rally on the small cap index of the Russell 2000 might suggest that this latest stock sell off has come to an end. This index is viewed a kind of ‘canary in the coal mine’ and it closed last week with a bullish candle and back above a key support level. Add to this that the Elliott Wave indicator is suggesting a bull run from here and this may all point to an end to the selling:
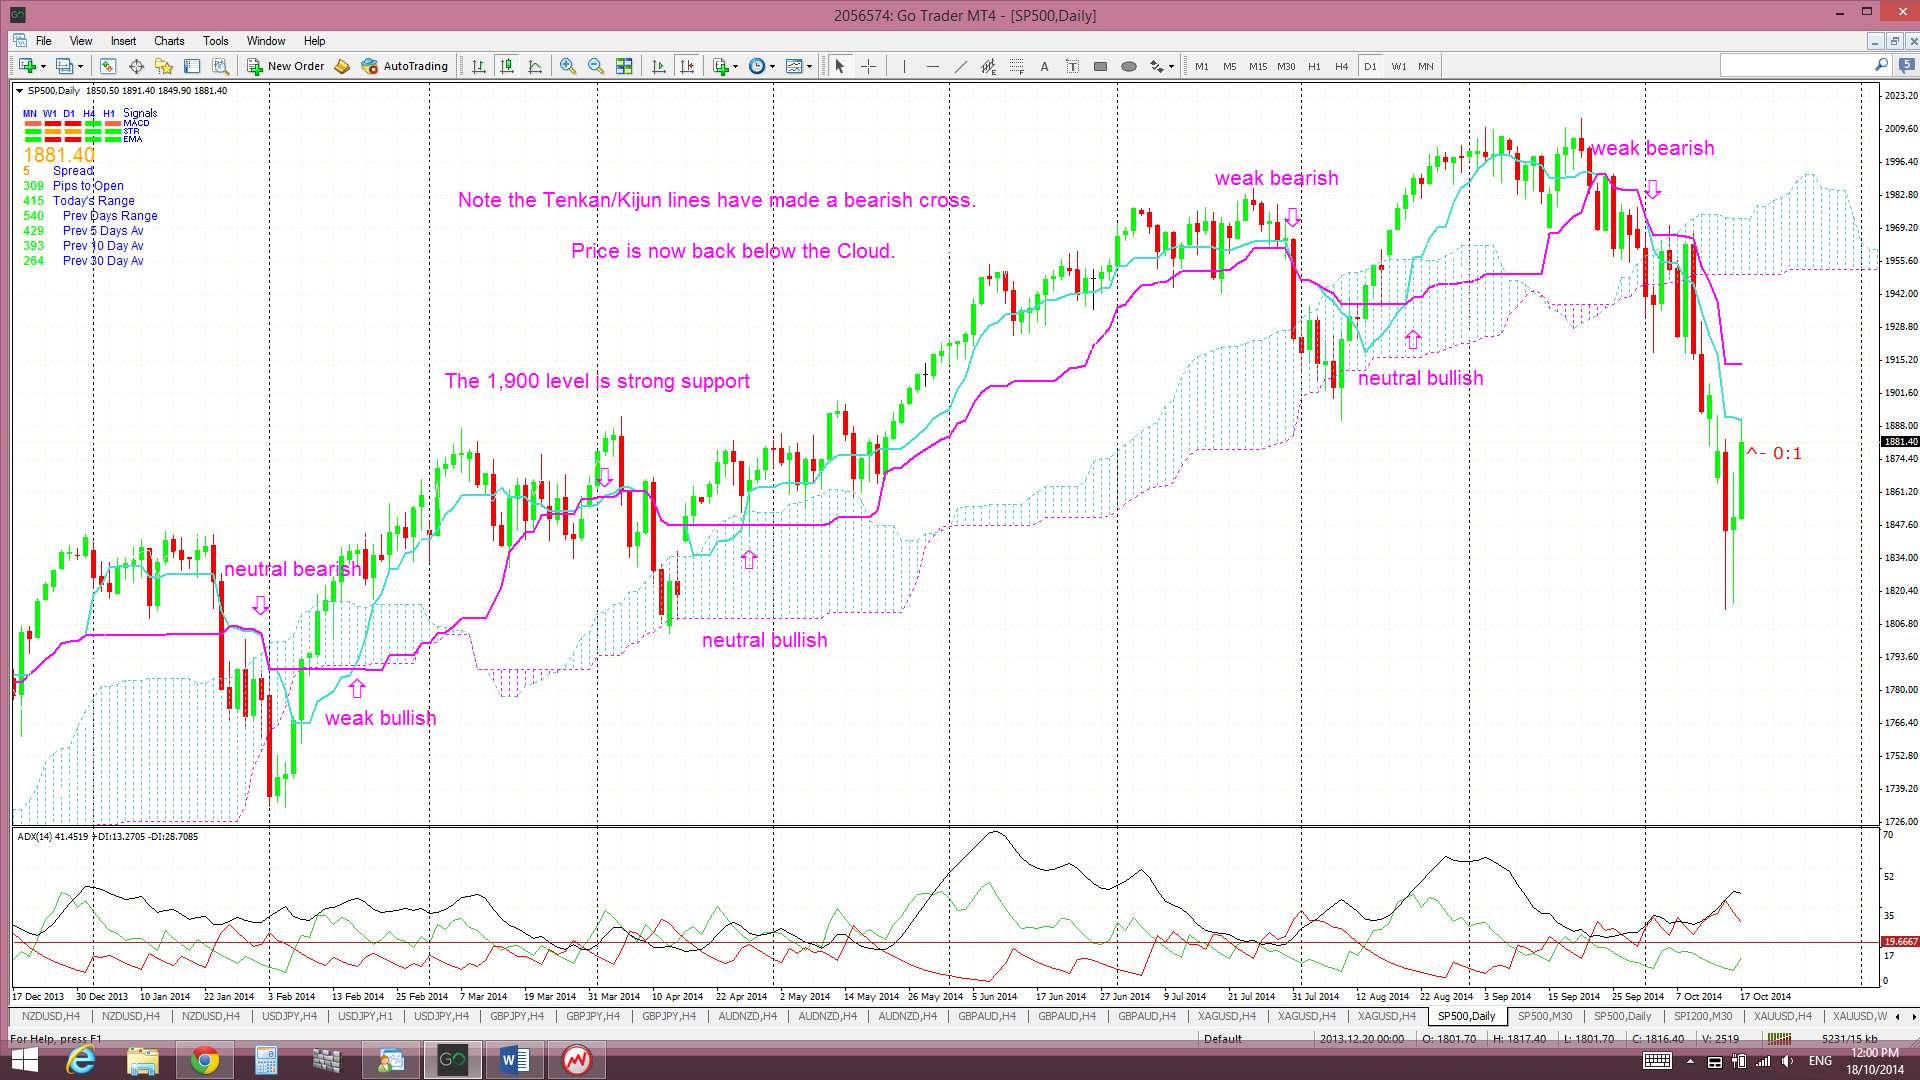
Thus, whilst I’m hoping for a deeper pull back I will keep an open mind and trade with the trend. The S&P500 is still below the daily Cloud, which is bearish, and any recovery effort here might make for choppy conditions if the index tries to move back up through the Ichimoku Cloud:
S&P500 daily Cloud:
So, over the coming weeks if you look and see the markets have had a bad sell off session………. we don’t want to see any faces like this:

I believe these markets need a deeper pull back to adequately underpin the next bullish run so……… what we want to see on any market down day……… is a face like this!

S&P500 to 1,600….Bring it on!
Hai, I see a delay in the winding up in oct sitting which is bullish for s&p