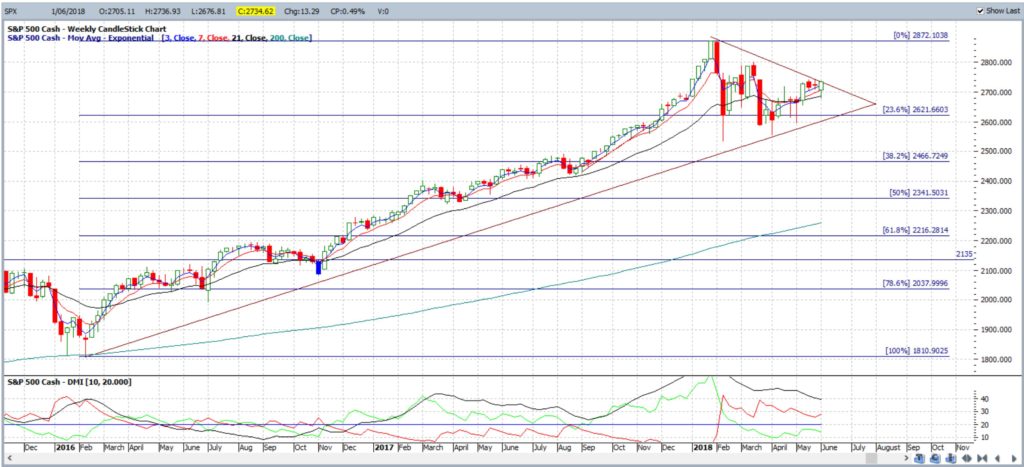
The S&P500 has been consolidating in a Flag style pattern for most of this year but price action is currently testing the upper trend line. Keep an eye on this latest push higher as any successful breakout might bring the 2,880 level into focus.
Charts: I am still having issue with the clarity of my Profit Source charts on my new 4K laptop but I’m persevering for the time being. This is why I have been posting fewer stock market chart updates however so, apologies for this.
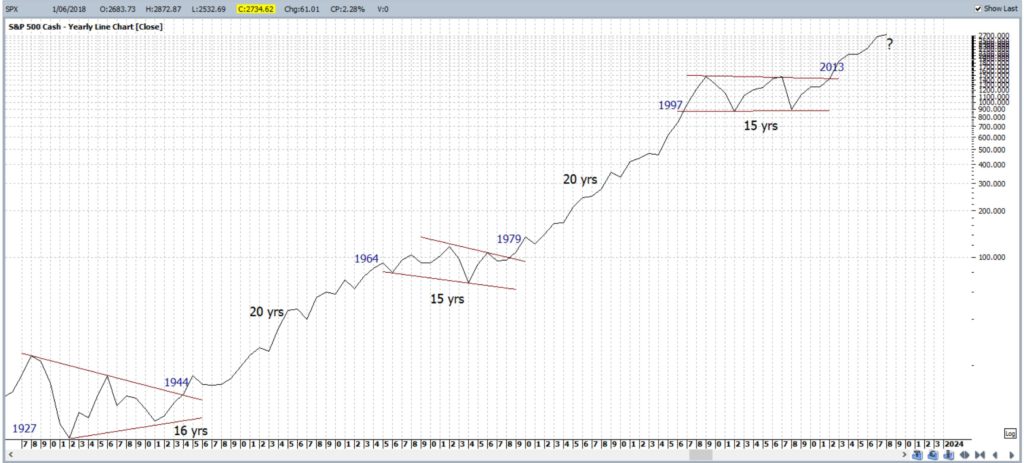
S&P500: multi-year: The multi-year chart shows that the S&P500 index has been in an overall uptrend since the 1920s. Yes, there are periods of lengthy sideways consolidation and the chart below would suggest that we have recently emerged from just such a period. Past performance is never a guarantee of the future, however, the repetitive nature of this trend is interesting, to say the least. Are we embarking on another 20-year uptrend?
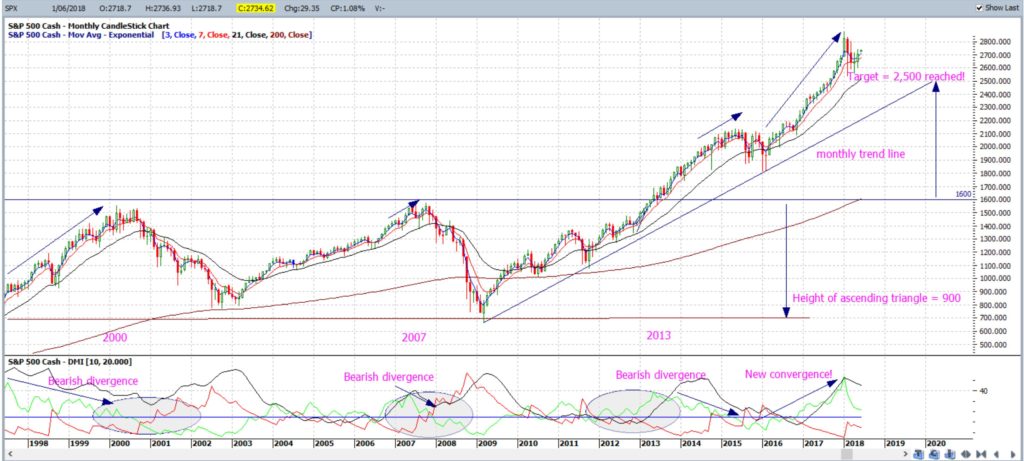
S&P500 monthly: The monthly support trend line remains intact and, if the multi-year chart above is any measure, then this latest uptrend could last a lot longer! The 1,600 breakout level on the chart below equates to the upper zone of the top Flag pattern (labelled 2013) on the multi-year chart above:
S&P500 weekly: the Flag trend lines on this weekly chart are constantly adjusted to keep pace with ADX momentum. So, even though this upper trend line is being tested, I would still like to see an uptick with the ADX to confirm any breakout and we are not seeing that just yet.
- Any successful breakout would bring the 2,880 level into focus as this is the nearest whole-number resistance level above the highest price
- Any bearish breakdown from this triangle would bring the weekly 61.8% fib into greater focus and this is down near previous S/R at 2,200:
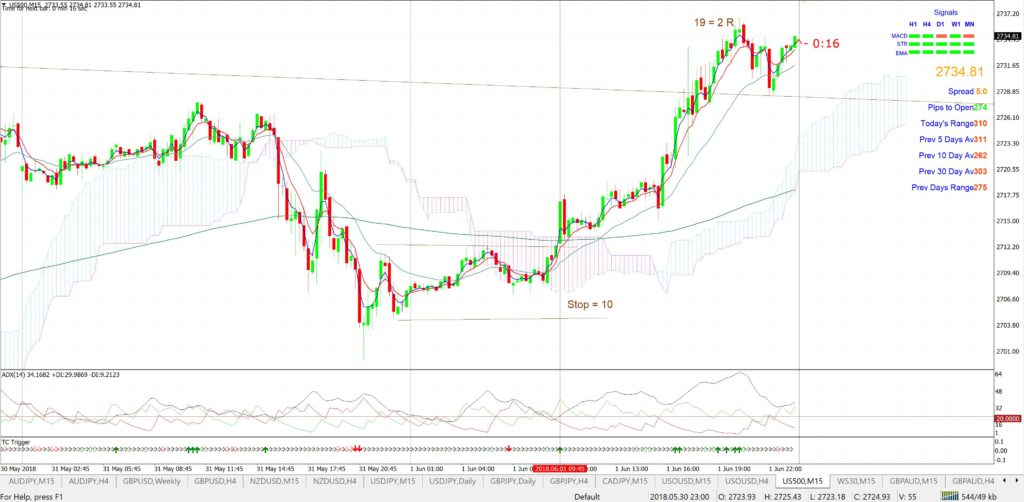
S&P500 15 min: I am trialing using my TC Trigger on the S&P500 15 min chart whilst I am in the European and US trading zone. The chart below shows there was an ok trade on Friday but waiting for NFP was the concern here. This chart also shows that the upper Flag trend line, derived from the weekly time-frame, has been broken and so I will be watching this zone with interest. My preference on the shorter time frame charts is to watch for TC signals that trigger out of relatively quiet, sideways price action after any breakout from the Asian range and so this is what I’ll be looking for on Monday. The benefit of this shorter time frame is that bias is not an issue; there will often be short bursts of up and down activity in any market move:


