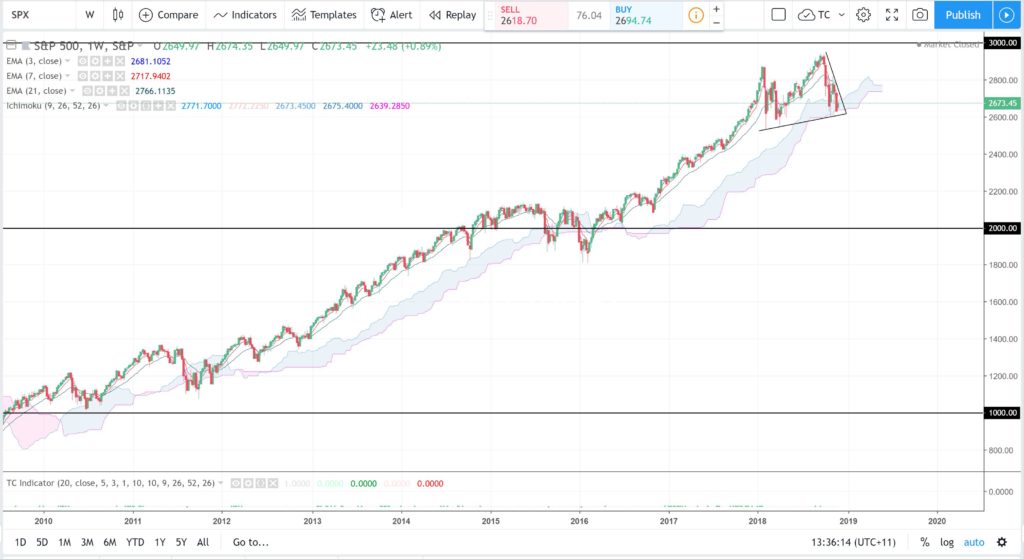
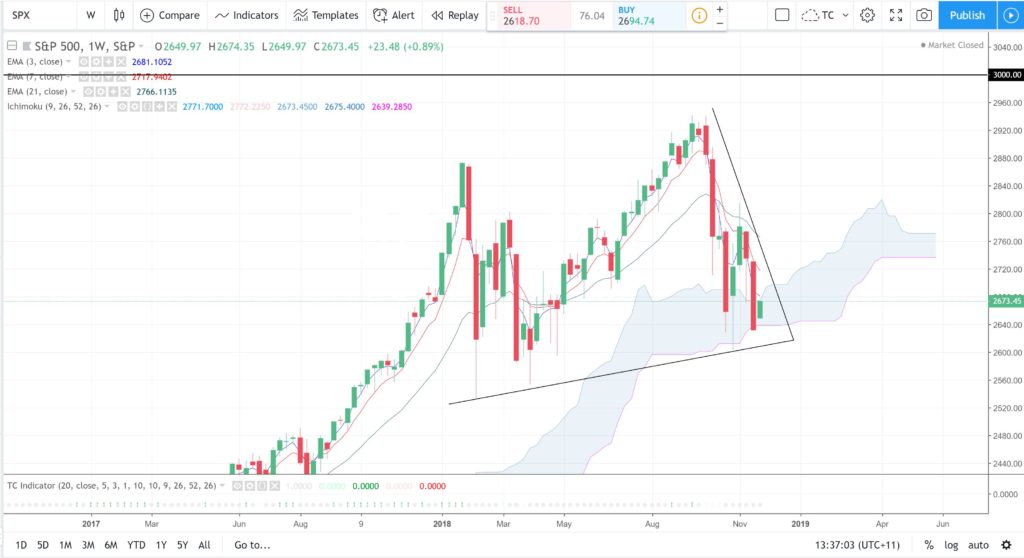
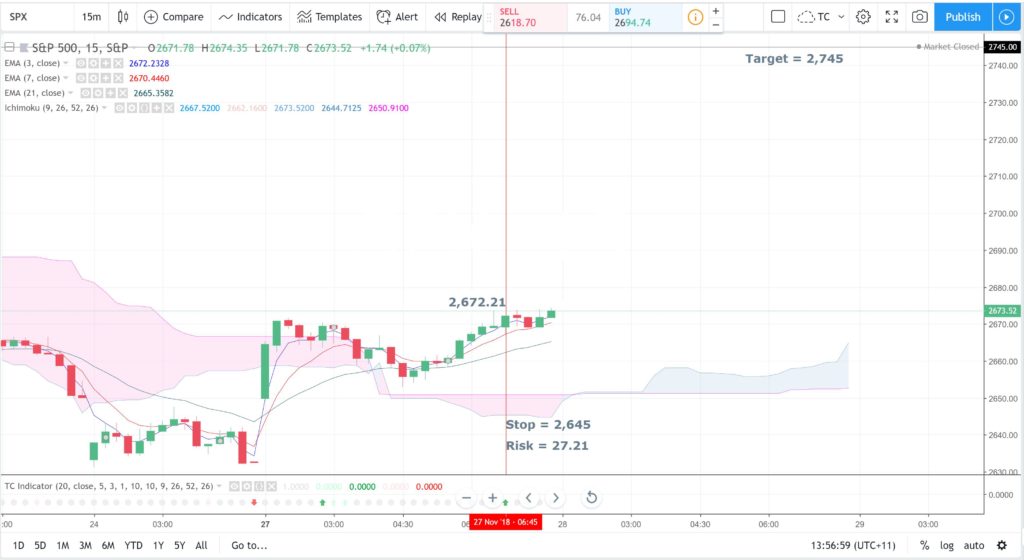
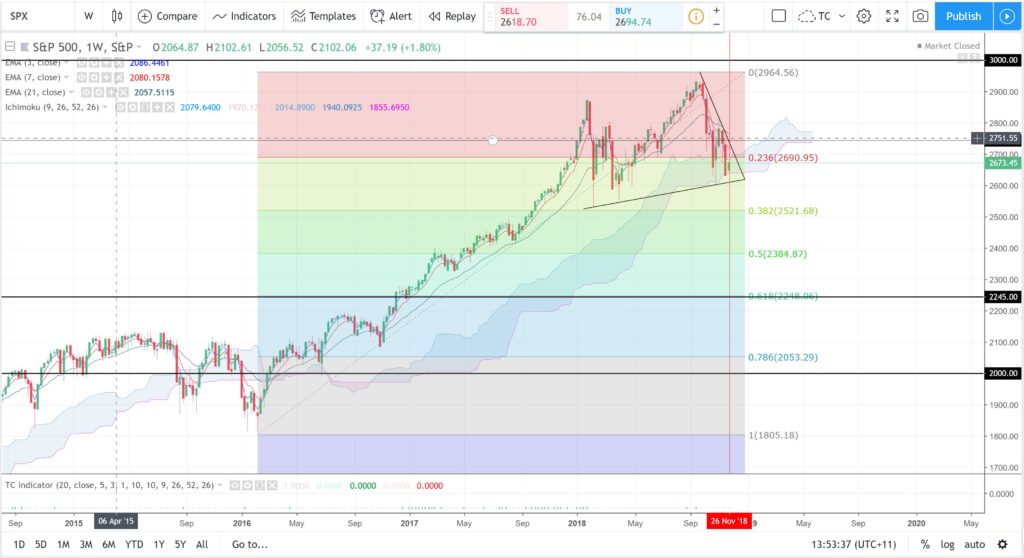
The S&P500 has been in a downtrend the last few months and has traded down to the bottom of the weekly Ichimoku Cloud. This region can often act as decent support though so I have been monitoring this region to see if price action tries to carve out a bounce from here at all; either a temporary relief rally or a recovery effort. The week has started off positively for the Index and there has been a new 15 min chart TC signal to LONG and so I’ll be watching for any follow-through.
S&P500 weekly: price action is trying to bounce up from the support of the bottom of the weekly Cloud so watch for any follow-through here:
S&P500 weekly: a close-up look at this weekly chart price action showing support from bottom of weekly Cloud:
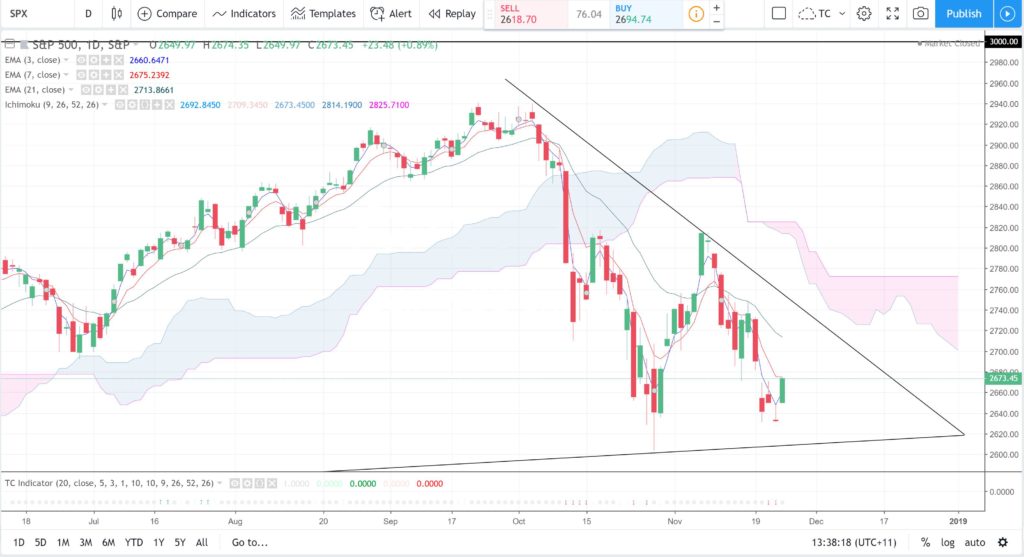
S&P500 daily: still consolidating under the Cloud on the daily chart:
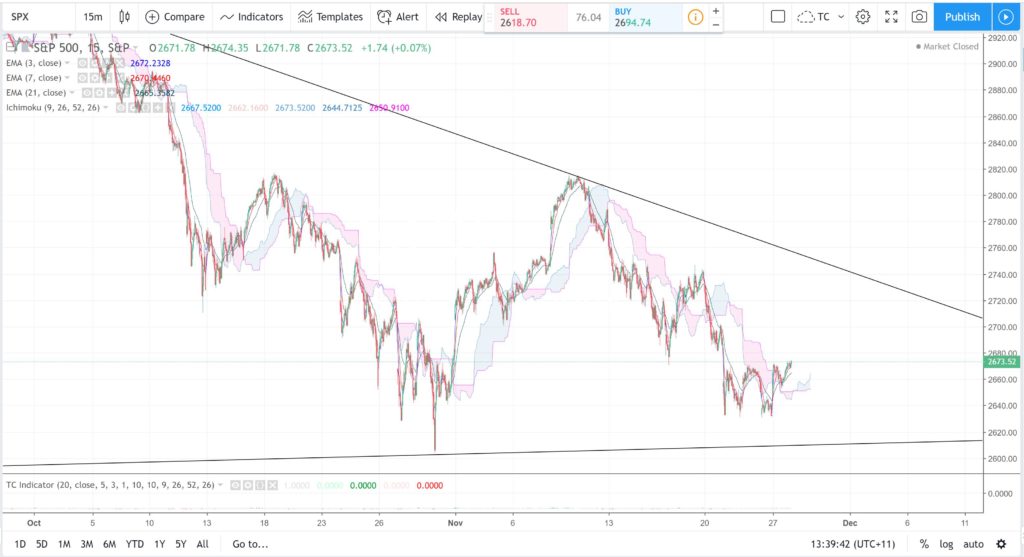
S&P500 15 min: the condensed 15 min chart shows price trying to recover above the Cloud:
S&P500 15 min: the 61.8% fib of the recent swing Low is near 2,745 and so that would be the target for any continued recovery move. This level also aligns with the bear trend line for extra confluence:
S&P500 15 min: There has been a recent TC 15 min LONG signal. Entry was at 2,672.21. The Stop would be 2,645 giving a Risk of 27.21 points. Any push up to the Target at 2,745 would mean a gain of 72.79 points. This would offer a Return on Risk for the trade of 72.79/27.21 = 2.6 R
S&P500 weekly: any breakdown though and close and hold below the weekly Cloud would have me looking for a push down to test 2,245 though ass this is near the 61.8% fib of the last swing High move:
Summary: Watch for any recovery effort on the S&P500 as it tries to hold above the bottom of the weekly Cloud. The target for any bullish recovery move is 2,745. Failure at the weekly Cloud though would have me looking for any push down towards 2,245.


