The S&P500 is chopping under its all time High of 2,940.91 (an intra-day High) but a key point to note is how Volume has been lacking with the latest push higher. Traders should watch Volume and Momentum as the index navigates this region for clues about the next move; whether that be up or down! In this article I review daily charts of the SPX, the S&P500 cash index, the SPY, the S&P500 ETF, the ES, the E-mini Futures contract and the VIX, the Volatility or, as it is sometimes called, the Fear index. This is technical analysis of the price action on these charts and I make no prediction about the next move on the index. I simply offer some metrics to monitor as the index navigates this major psychological hurdle and, as always, do your own due diligence and research and exercise appropriate risk management.
SPX daily: the S&P500 cash index:
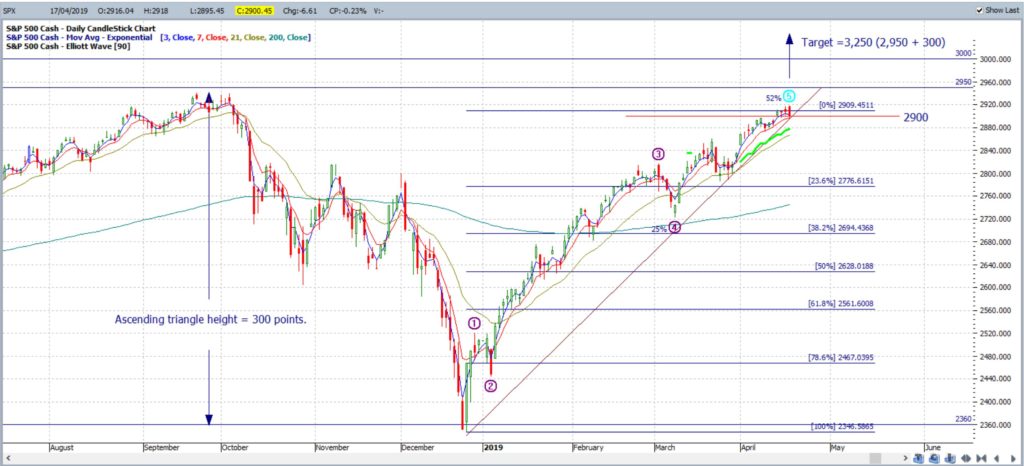
Inspection of the daily chart of the S&P500 reveals that the 2,950 and 3,000 levels that are featuring as key Resistance levels above current price. There are a few features to note about this daily chart:
- Firstly, a support trend line is in place under the latest swing High move that has been in play since December 2018. Any break and hold below this trend line would be a bearish signal but, as always, traders should watch in the first instance for any potential Bull Flag activity. However, if weakness persists this would bring the daily chart’s 61.8% Fibonacci retracement into focus and this is near the 2,560 level. There would be whole-number levels, such as 2,800, 2700, 2600 etc, to monitor prior to reaching the 61.8% deeper target.
- The second feature to note on the daily chart is the appearance of a potential bullish Ascending Triangle that looks to be forming. The height of this Triangle is about 300 points and so any break and hold above 2,950 would bring the 3,250 level into focus as a longer term target of any breakout move (2,950 + 300 = 3,250). However, the index would have to battle the hugely psychological 3,000 level first though!
- The Elliott Wave indicator shows that a Wave 5 move is in progress and is only 52% extended suggesting there is more potential room to move here.
SPX daily: the S&P500 cash index: Golden Cross
The next daily chart to consider is that of the Golden Cross. A Golden Cross is a bullish signal and occurs when the 50 Simple Moving Average (SMA) crosses above the 200 SMA. Conversely, a Death Cross is a bearish signal and occurs when the 50 SMA crosses below the 200 SMA. The daily chart below shows that there have been a few Death and Golden Crosses since 2012 but that the Golden Crosses have fared better with much longer duration. Traders should watch to see how this latest Golden Cross from March 29th travels; especially as the index nears 2,950 and 3,000 Resistance.
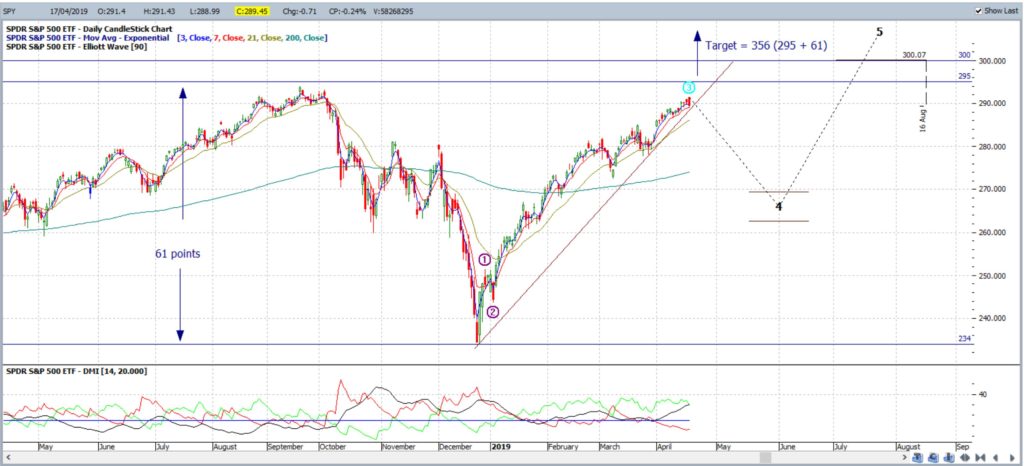
SPY daily: the S&P500 ETF: Price action for this chart is rather similar to the Index which is hardly surprising; it is a 1/10 scale of the index. Note here, though, how the Elliott Wave indicator suggests the potential that a bearish Wave 4 could be looming. However, any break and hold above 295 and 300 would be a bullish signal and I would then be looking for any style of Ascending Triangle breakout; as with the major index.
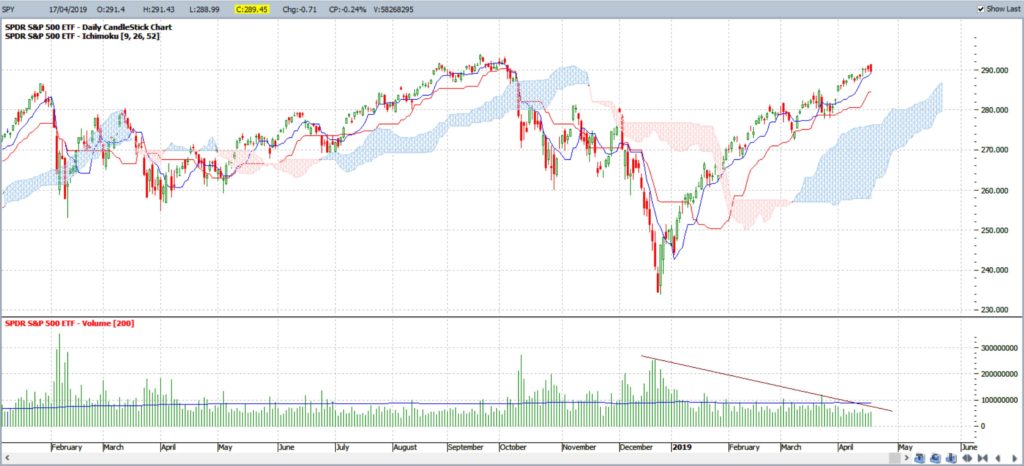
SPY daily: the S&P500 ETF: Ichimoku and Volume: the main points to note here is:
- the overall lack of Volume; it is below the 200 EMA, and
- the declining Volume
that has that has been evident with this latest rally; that being since the Dec 2018 low. Traders should watch for any Volume spike that evolves with any new price action and momentum breakout for added confluence.
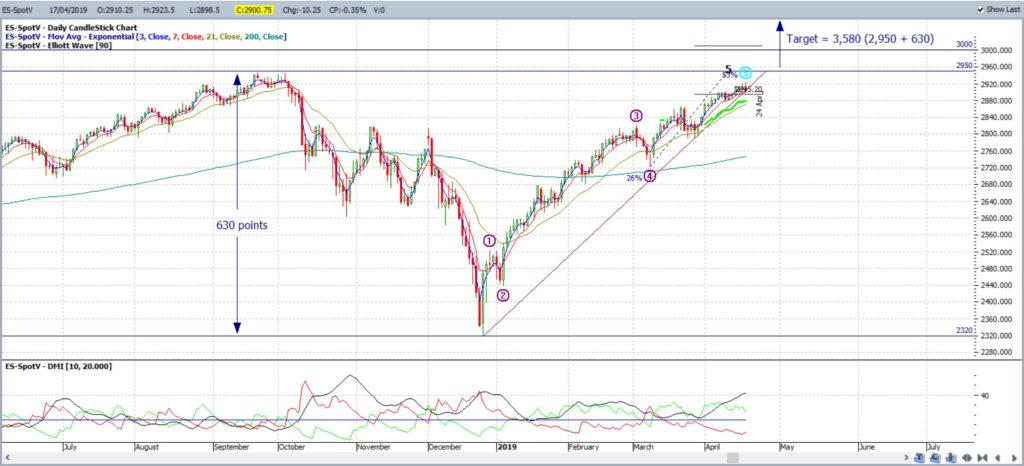
ES daily: the S&P500 E-mini Futures (continuous contract): Price action for this chart is, again, rather similar to the Index which is hardly surprising. Note here, though, how the Elliott Wave indicator shows a similar Wave 5 in progress.
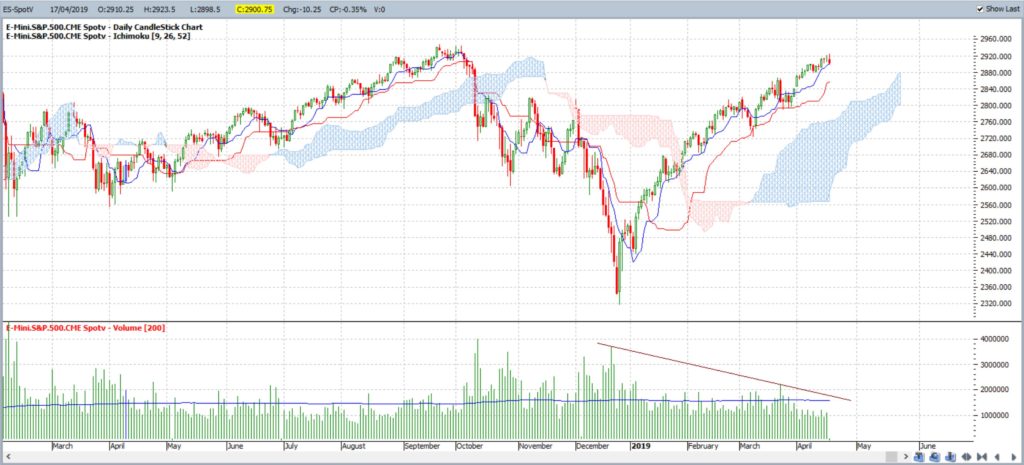
ES daily: the S&P500 E-mini Futures (continuous contract) with Ichimoku and Volume: the interesting feature with the E-mini Futures is also how Volume is below average and has also been declining since the rally of Dec 2018. As with the SPY, watch for any breakout with Volume, price action and momentum for added confluence.
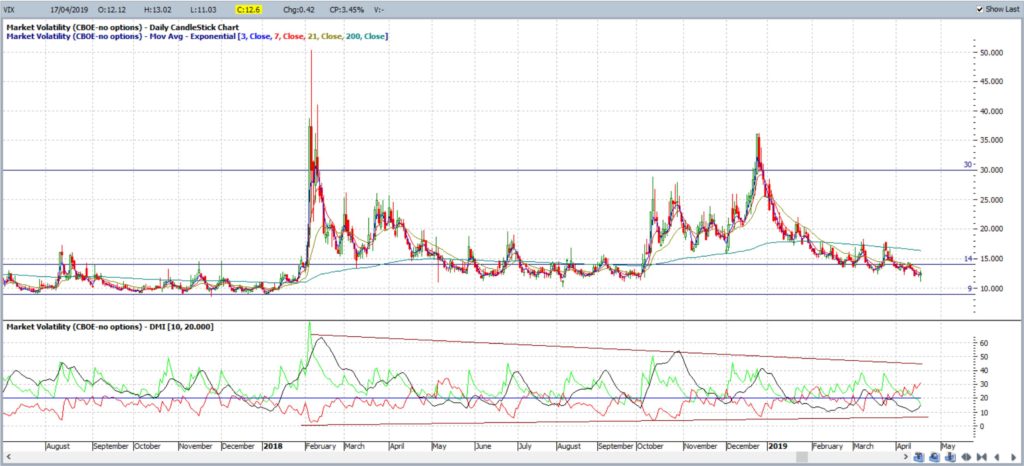
VIX daily: Volatility Index: the fear index remains low, below 14, and note the declining and converging momentum here.
Summary: The S&P500 index is nearing its previous all time High and the psychological resistance of 3,000. Price action has been in a rally since December 2018 but this rally has evolved on the back of low and declining Volume. Traders should watch for a Volume spike with any momentum and price action breakout, either up or down, for added confluence about the move. In this post I have also noted key levels to monitor for any upside and downside price action breakout


