Global stock market indices have been under considerable pressure the last few months and this has come from a range of factors including: the war in Ukraine, rising yields, rising fuel prices and rising inflation. These are fundamental reasons for a pause in the stock market rally but, given many global stock indices have been in an overall uptrend since the end of the Global Financial Crisis (2008-2009), a technical reason for pausing here is of no surprise either. Remember: markets do not travel in straight lines forever. There are a number of high-profile US listed stocks that have experienced decent pullbacks during this latest period and these are the focus of my technical analysis in this article. Many of these stocks are back down near long-term Support / Resistance levels and might be worth watching for any new directional move.
It is important that traders and investors do their own research as the analysis posted here is educational information only and merely offered as a guide for evaluating the charts of stocks that are experiencing a pullback and/or downtrend. This article was prepared near the end on May 2020, the week after the Dow Jones Index had printed 8 consecutive bearish weekly candles. In an interesting parallel, the last time this happened was back in 1923, following on after the previous pandemic event of the Spanish Flu (1918). The Great Market Crash of 1929 eventually followed that pandemic which is, no doubt, something worth keeping in mind.
Trying to pick bottoms in stock market moves is fraught with difficulty and hence the analogy of it being likened to ‘trying to catch a falling knife‘, however, market pullbacks can provide opportunities to enter stock positions at a discount to premium. Looking for quality stocks that are trading at a discount and that embark on a new uptrend with supporting momentum and / or volume underpins the educational framework used in this article. It is prudent at this point to remind traders and investors that they should only ever trade with funds they can afford to lose and only after seeking financial advice and developing their own well-tested trading / investment plan.
With regards to market pullbacks, my observation is that stocks suffer price retreats for, essentially, two main reasons:
- Fundamental pullback: when the fundamentals of the business change for the worse and the company outlook diminishes causing investors to sell out of the stock.
- Technical pullback: when the pullback is part of a broad-based technical pause in the market due to exhaustion after a lengthy market rally. The fundamentals of the business remain unchanged.
Traders and investors need to ask themselves these two questions about the current market pullback and about the stocks profiled in this article:
- Q1: Has the stock pulled back in price because the fundamentals of the business have changed and the company is no longer as profitable and viable?
or
- Q2: Has the stock pulled back simply because the broader market is pulling back following a lengthy market rally and the current bullish run has become exhausted and needed to pause?
As previously stated, individual traders and investors will need to do their own fundamental research to make these assessments but, if the stock pullback is assessed and evaluated as being due more so to the second scenario, then this stock may well be worth monitoring for any potential recovery and trading opportunities.
A number of the chart pullbacks featured in this article are shaping up into bullish-reversal descending wedges and these are the preferred chart patterns that I like to monitor. My preference is always to get into quality stocks, at a discounted price, and when the stock is embarking on a new momentum-based upswing. A bullish-reversal breakout from a descending wedge is a move that I find to be highly consistent and profitable.
This monitoring process involves mapping the bullish-reversal wedge with trend lines until there is a sign of some reversal by way of a trend line breakout that is supported by increasing bullish momentum. My preferred momentum indicator is the Average Directional Index (ADX) but some may prefer to use volume. I keep tracking the price lower as the stock pulls back, and extending the trend lines downwards, until any momentum-based reversal signal occurs.
To help identify targets for any potential bullish breakout I apply a Fibonacci retracement to the pullbacks, also called the swing low moves, and I look to the popular 61.8% Fibonacci retracement level in the first instance. I also look to see if this 61.8% retracement level aligns near any previous Support or Resistance reaction zones for the stock as this gives some added confluence, or credibility, to that area being a potential target for price action.
This article was prepared in late May 2022 so it may be some weeks before you read and assess these charts. My suggestion is to keep extending the downward sloping trend lines, if price action has continued lower, or to look for supporting evidence, by way of changing momentum, if there has already been a bullish reversal breakout.
Netflix: NFLX:
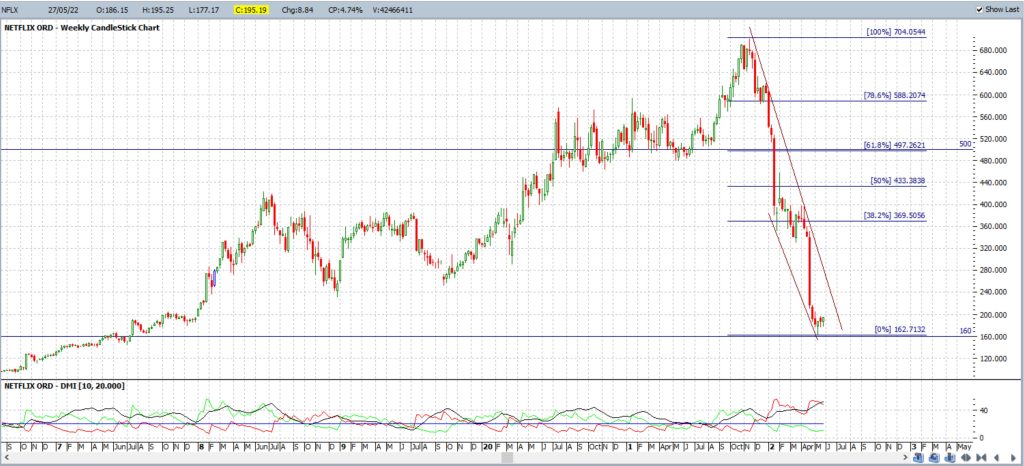
Netflix has experienced a deep pullback with this latest market decline and has moved from around $700 down to just above $160. The $160 level was a bit of a reaction zone for the stock back during 2017. Note, also, how this price decline has shaped up into a bullish-reversal descending wedge. It may be worth watching to see if this $160 level can hold as Support and if the bullish-reversal wedge can deliver a breakout. The swing low move has been mapped with a Fibonacci retracement and the popular 61.8% level aligns up near $500 which is also a region of some Support and Resistance activity and would be the main target for any bullish breakout move.
PayPal: PYPL
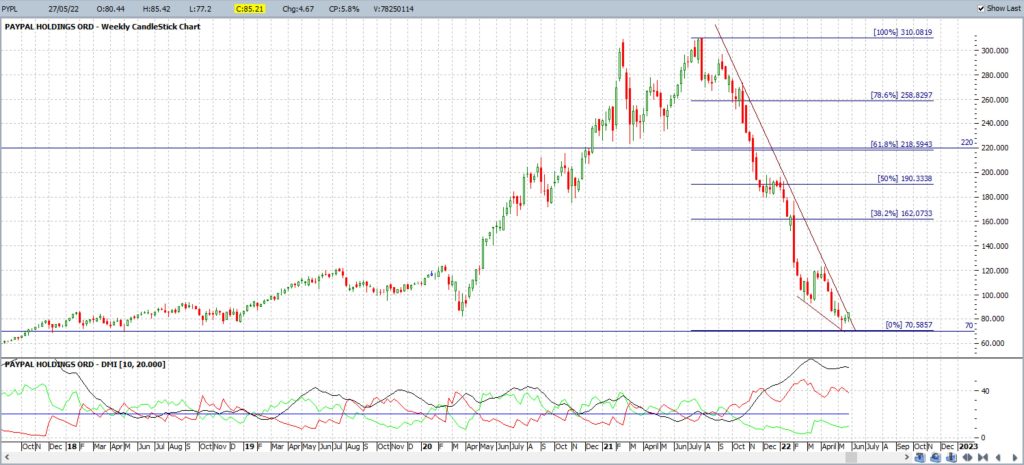
PayPal has experienced a deep pullback with this latest market decline and has moved from around $310 down to just above $70. This $70 level was a significant reaction zone for the stock and the chart reveals this was Support throughout most of 2018. Note, also, how this price decline has shaped up into a bullish-reversal descending wedge. It may be worth watching to see if this $70 Support level can hold and if the bullish-reversal wedge can deliver a breakout. The swing low move has been mapped with a Fibonacci retracement and the popular 61.8% level aligns up near $220 which is also a region of some Support and Resistance activity and would be the main target for any bullish breakout move.
Roku: ROKU
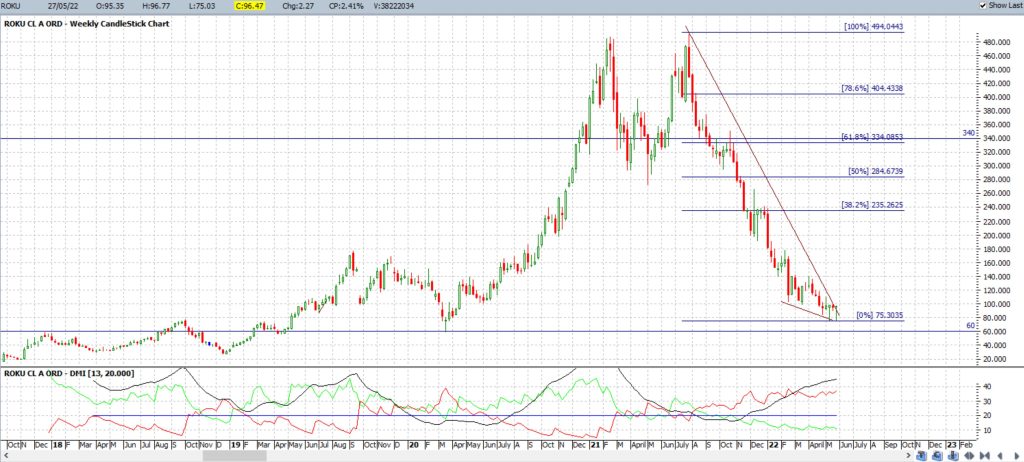
Roku has also experienced a deep pullback with this latest market decline and has moved from near $500 down to just above $60. This $60 level was a significant reaction zone for the stock and the chart reveals this was Resistance during 2018 and Support during 2019 and 2020. Note, also, how this price decline has shaped up into a bullish-reversal descending wedge. It may be worth watching to see if this $60 Support level can hold and if the bullish-reversal wedge can deliver a breakout. The swing low move has been mapped with a Fibonacci retracement and the popular 61.8% level aligns up near $340 which is also a region of some price reaction and would be the main target for any bullish breakout move.
Disney: DIS
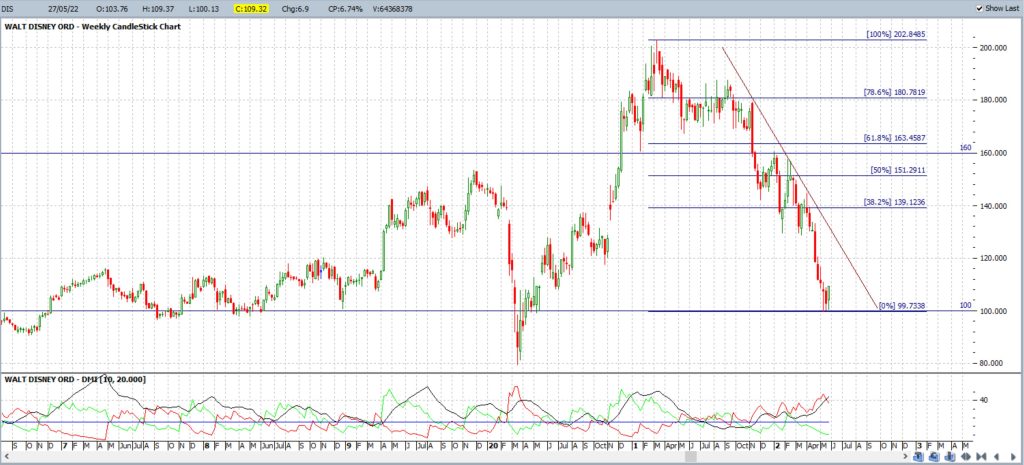
Disney is another stock that has experienced a deep pullback with this latest market decline and has essentially halved in value from around $200 to just above $100. This $100 level was a significant reaction zone for the stock throughout 2016 to 2020 so it may be worth watching to see if this $100 level can hold as Support this time around. The swing low move has been mapped with a Fibonacci retracement and the popular 61.8% level sits up near the $160 reaction zone and so would be the main target for any bullish recovery move. Technical analysts will note that the latest bullish weekly candle close has given the last three weekly candles a bit of a bullish-reversal Morning Star appearance.
eBAY: EBAY
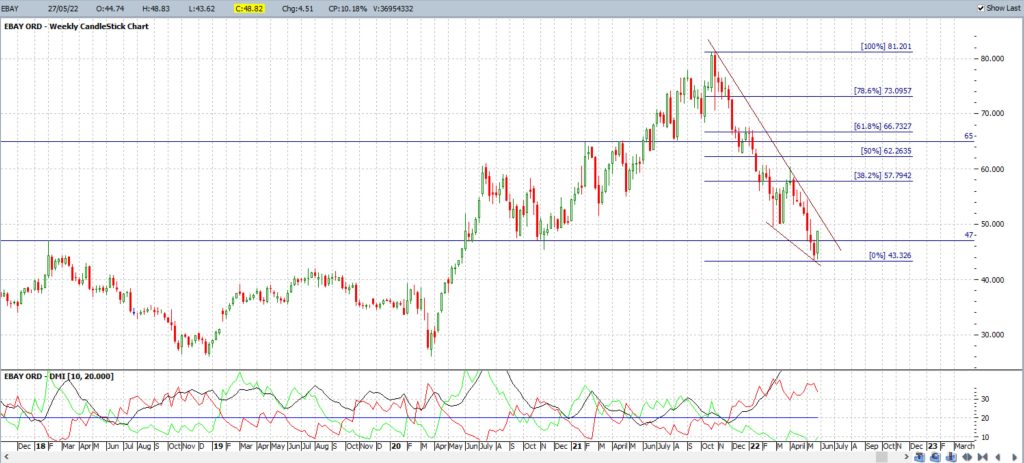
EBAY has also experienced a deep pullback with this latest market decline and has moved from around $80 to down near $47. This $47 level, a seemingly random number, was a significant reaction zone for the stock during 2018 and 2020. Note, also, how this price decline has shaped up into a bullish-reversal descending wedge. It may be worth watching to see if this $47 Support level can hold and if the bullish-reversal wedge can deliver a breakout. The swing low move has been mapped with a Fibonacci retracement and the popular 61.8% level sits up near $65 which is also a region of some price reaction and would be the main target for any bullish breakout move. Technical analysts will note that the latest bullish weekly candle close has given the last three weekly candles a bit of a bullish-reversal Morning Star appearance and there has been a close back above the $47 level.
ETSY: ETSY
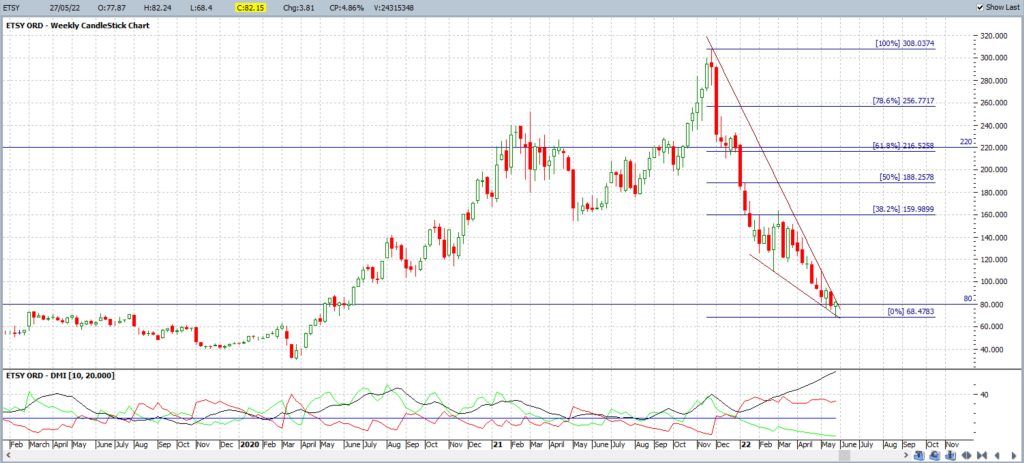
ETSY has also experienced a deep pullback with this latest market decline and has moved from around $300 to down near $80. This $80 level was a significant reaction zone for the stock during 2019 and 2020. Note, also, how this price decline has shaped up into a bullish-reversal descending wedge. It may be worth watching to see if this $80 Support level can hold and if the bullish-reversal wedge can deliver a breakout. The swing low move has been mapped with a Fibonacci retracement and the popular 61.8% level aligns up near $220 which is also a region of some price reaction and would be the main target for any bullish breakout move. The latest weekly candle here has also closed as a bullish-reversal Hammer candle and above the key $80 level.
OKTA: OKTA
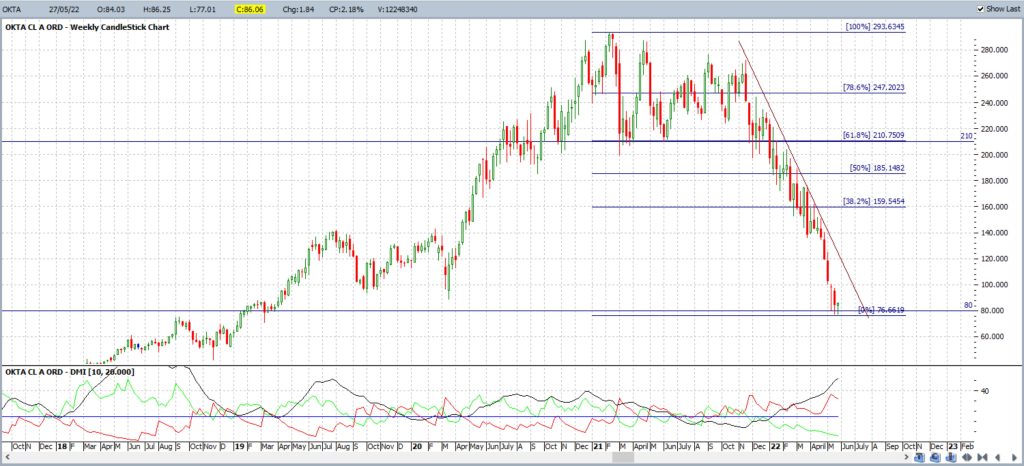
OKTA is another stock that has experienced a deep pullback with this latest market decline and has dropped from around $290 to just above $80. This $80 level was a reaction zone for the stock during 2018 and 2019 and so it may be worth watching to see if this $80 Support level can hold this time around. The swing low move has been mapped with a Fibonacci retracement and the popular 61.8% level sits up near the $210 reaction zone and so this would be the main target for any bullish recovery move. The latest weekly candle closed as a bullish-reversal Hammer candle and back above the key $80 level.
Shopify: SHOP
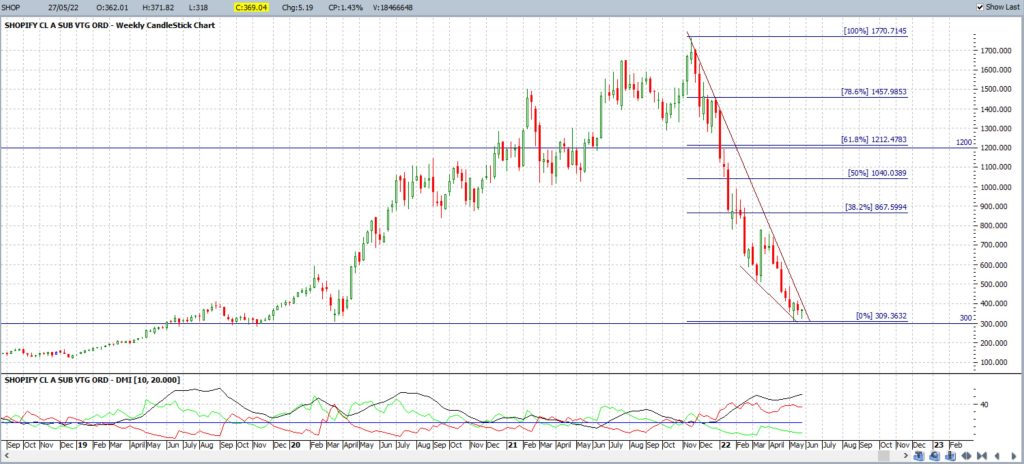
Shopify has experienced a deep pullback with this latest market decline and has moved from around $1,700 down to just above $300. This $300 level was a significant reaction zone for the stock during 2019 and 2020. Note, also, how this price decline has shaped up into a bullish-reversal descending wedge. It may be worth watching to see if this $300 Support level can hold and if the bullish-reversal wedge can deliver a breakout. The swing low move has been mapped with a Fibonacci retracement and the popular 61.8% level aligns up near $1,200 which is also a region of some Support and Resistance activity and would be the main target for any bullish breakout move.
Block: SQ
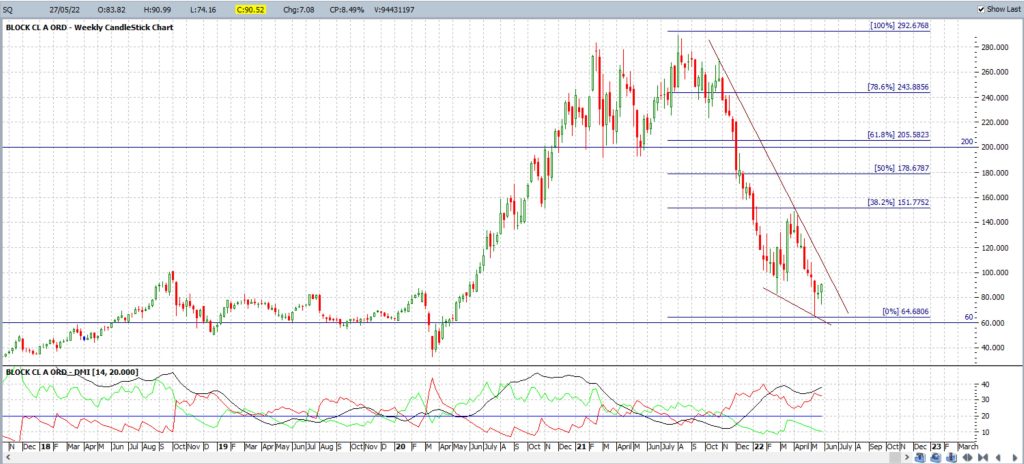
Block has experienced a deep pullback with this latest market decline and has moved from around $280 down to just above $60. This $60 level was a significant reaction zone for the stock during 2018, 2019 and 2020. Note, also, how this price decline has shaped up into a bullish-reversal descending wedge. It may be worth watching to see if this $60 Support level can hold and if the bullish-reversal wedge can deliver a breakout. The swing low move has been mapped with a Fibonacci retracement and the popular 61.8% level sits up near $200 which is also a region of some reaction activity and would be the main target for any bullish breakout move. Technical analysts will note that the latest bullish weekly candle close has given the last three weekly candles a bit of a bullish-reversal Morning Star appearance as well.
Atlassian: TEAM
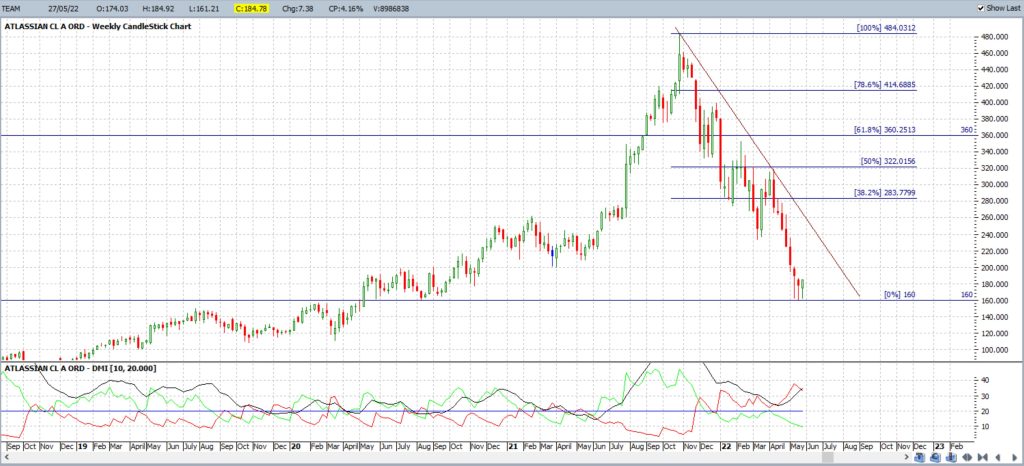
Atlassian is an Australian software stock, but listed on the NASDAQ, that has also experienced a deep pullback with this latest market decline and has dropped from around $480 to just above $160. This $160 level was a significant reaction zone for the stock throughout 2019 and 2020 so it may be worth watching to see if this $160 Support level can hold this time around. The swing low move has been mapped with a Fibonacci retracement and the popular 61.8% level sits up near the $340 reaction zone and so would be the main target for any bullish recovery move. The latest weekly candle closed as a bullish-reversal Hammer candle and above the key $160 level.
Final comments:
No one can be certain when the current market pullback may turn but technical analysts can watch charts for reaction at key Support levels, for trend line breakouts and for changes in momentum and /or volume for clues about any new directional market move. There is also no certainty that any new market bounce will form the bottom of this market move or just be a temporary Bear Market rally. The only factor an individual trader or investor can guarantee and control is their market exposure, or risk, and they should only ever use funds that are surplus to needs and that they are prepared to lose.


